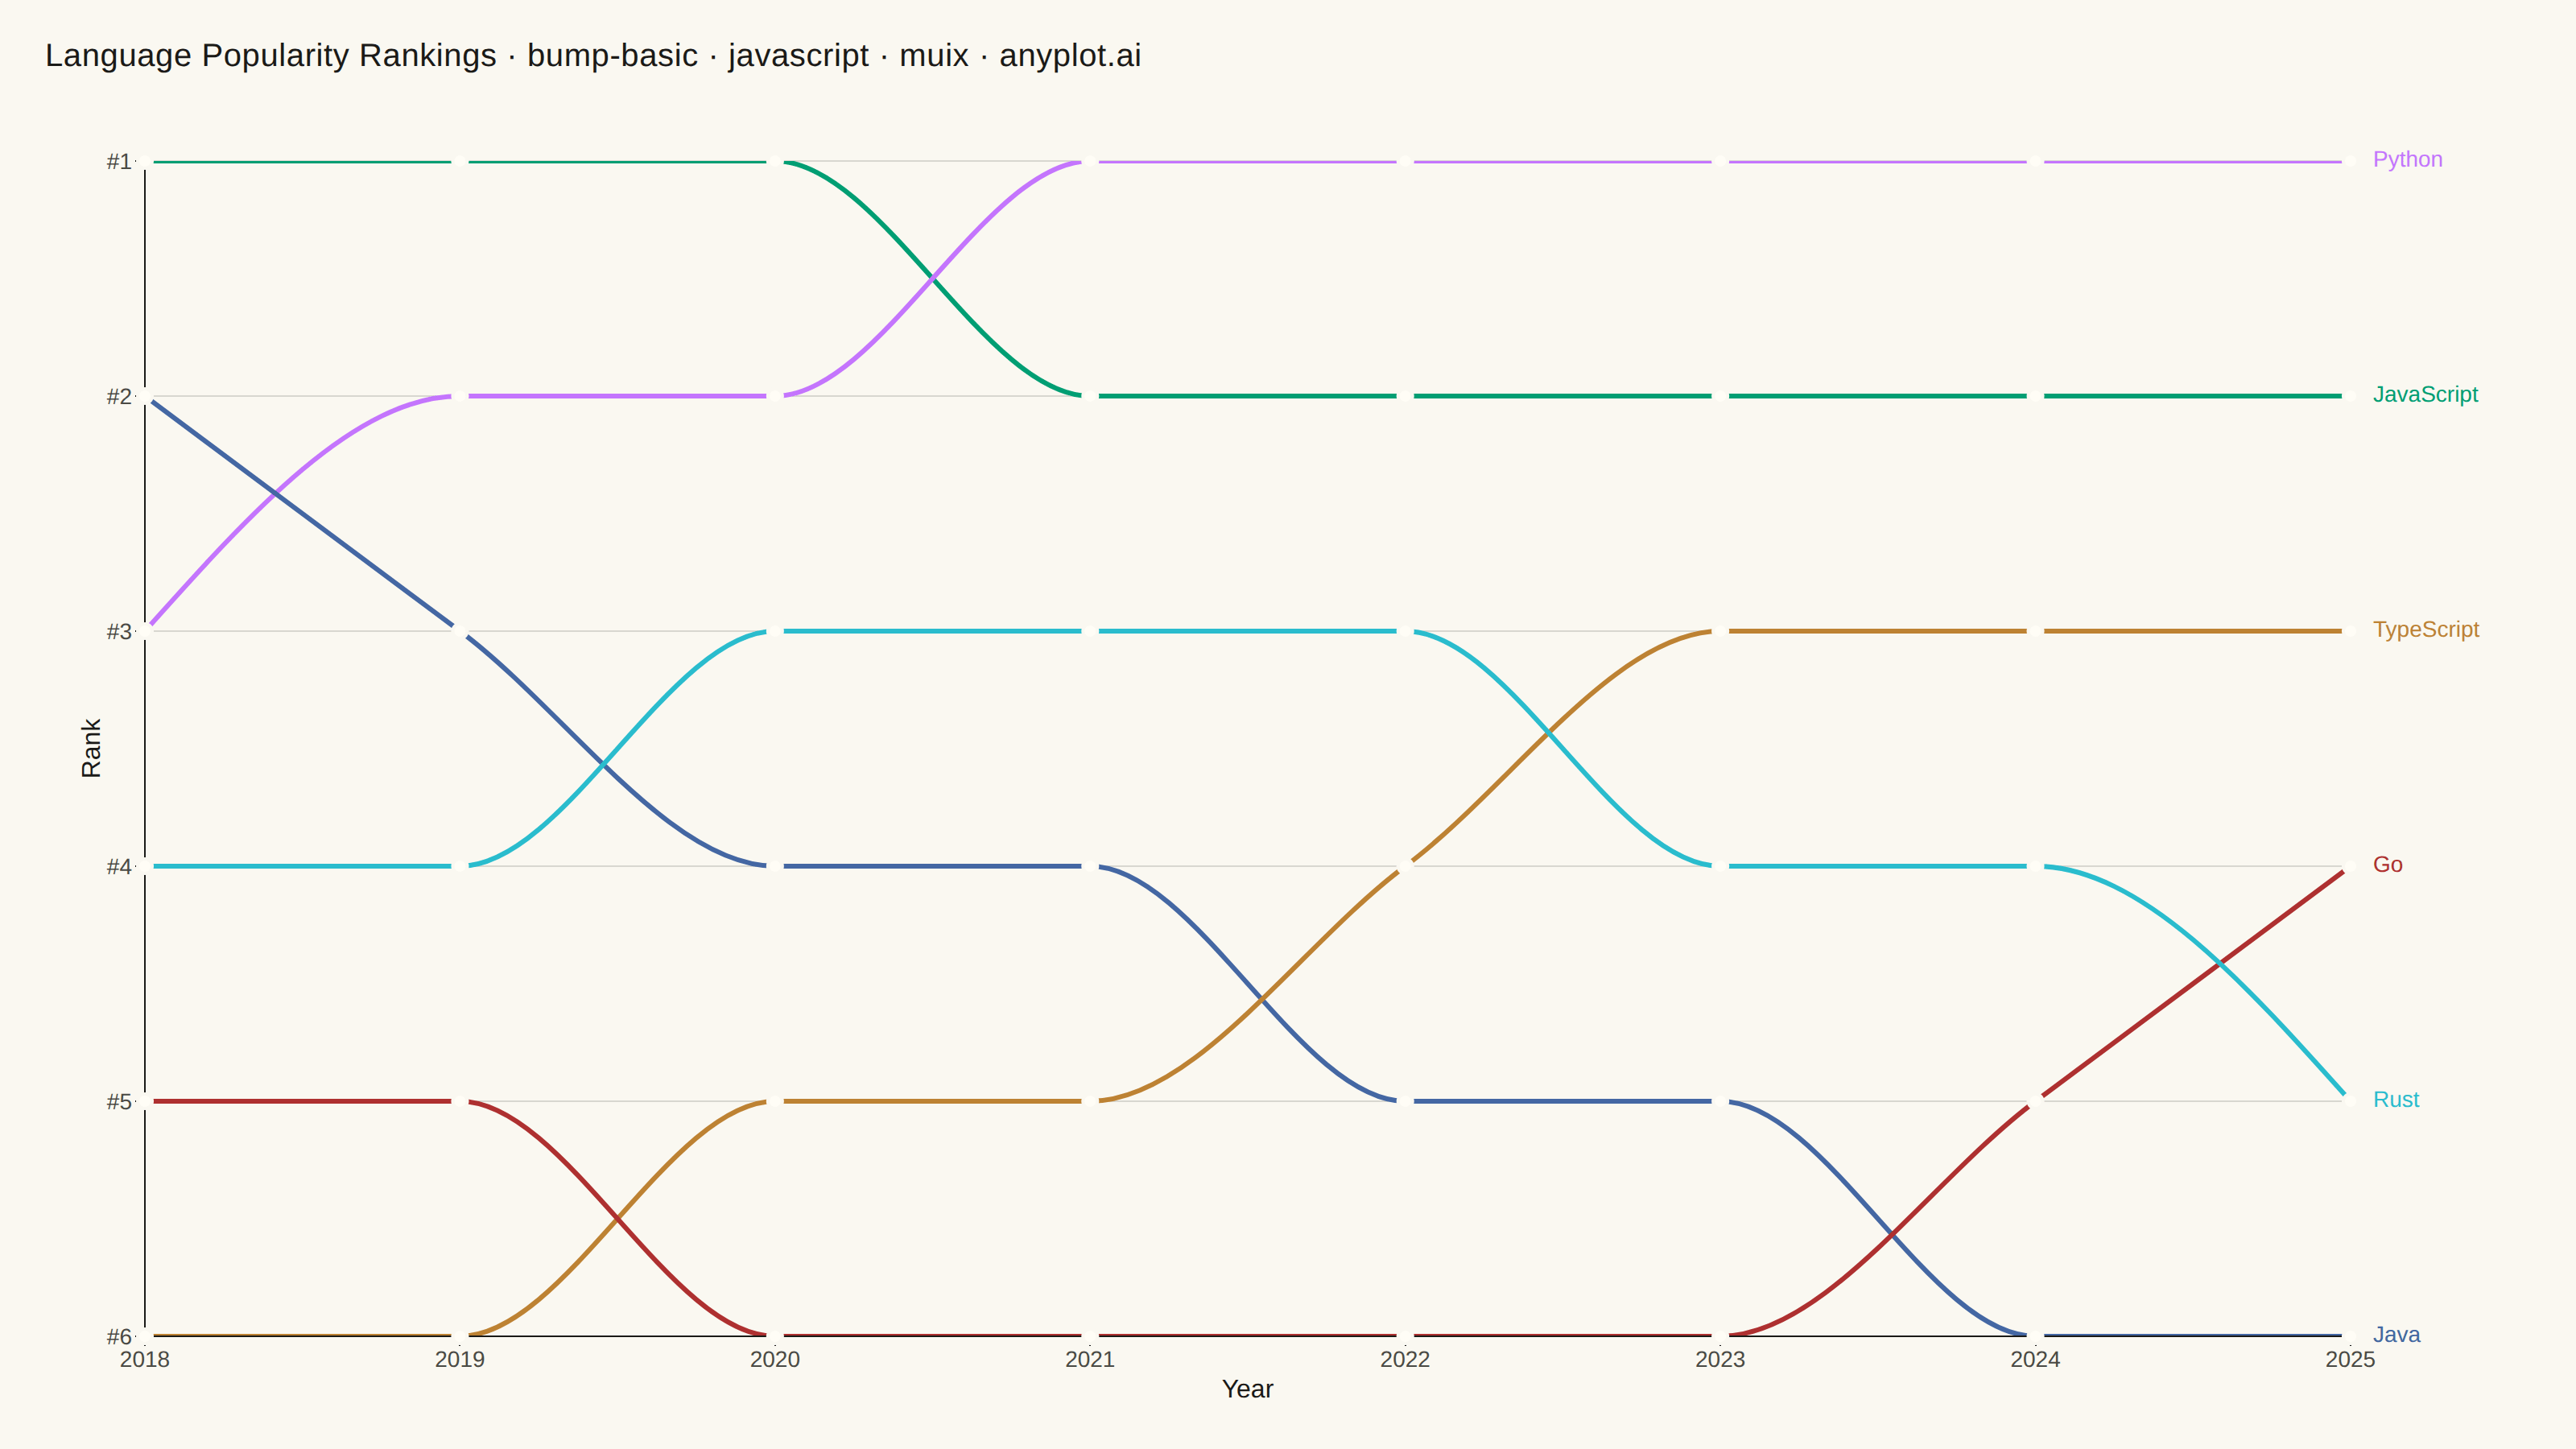
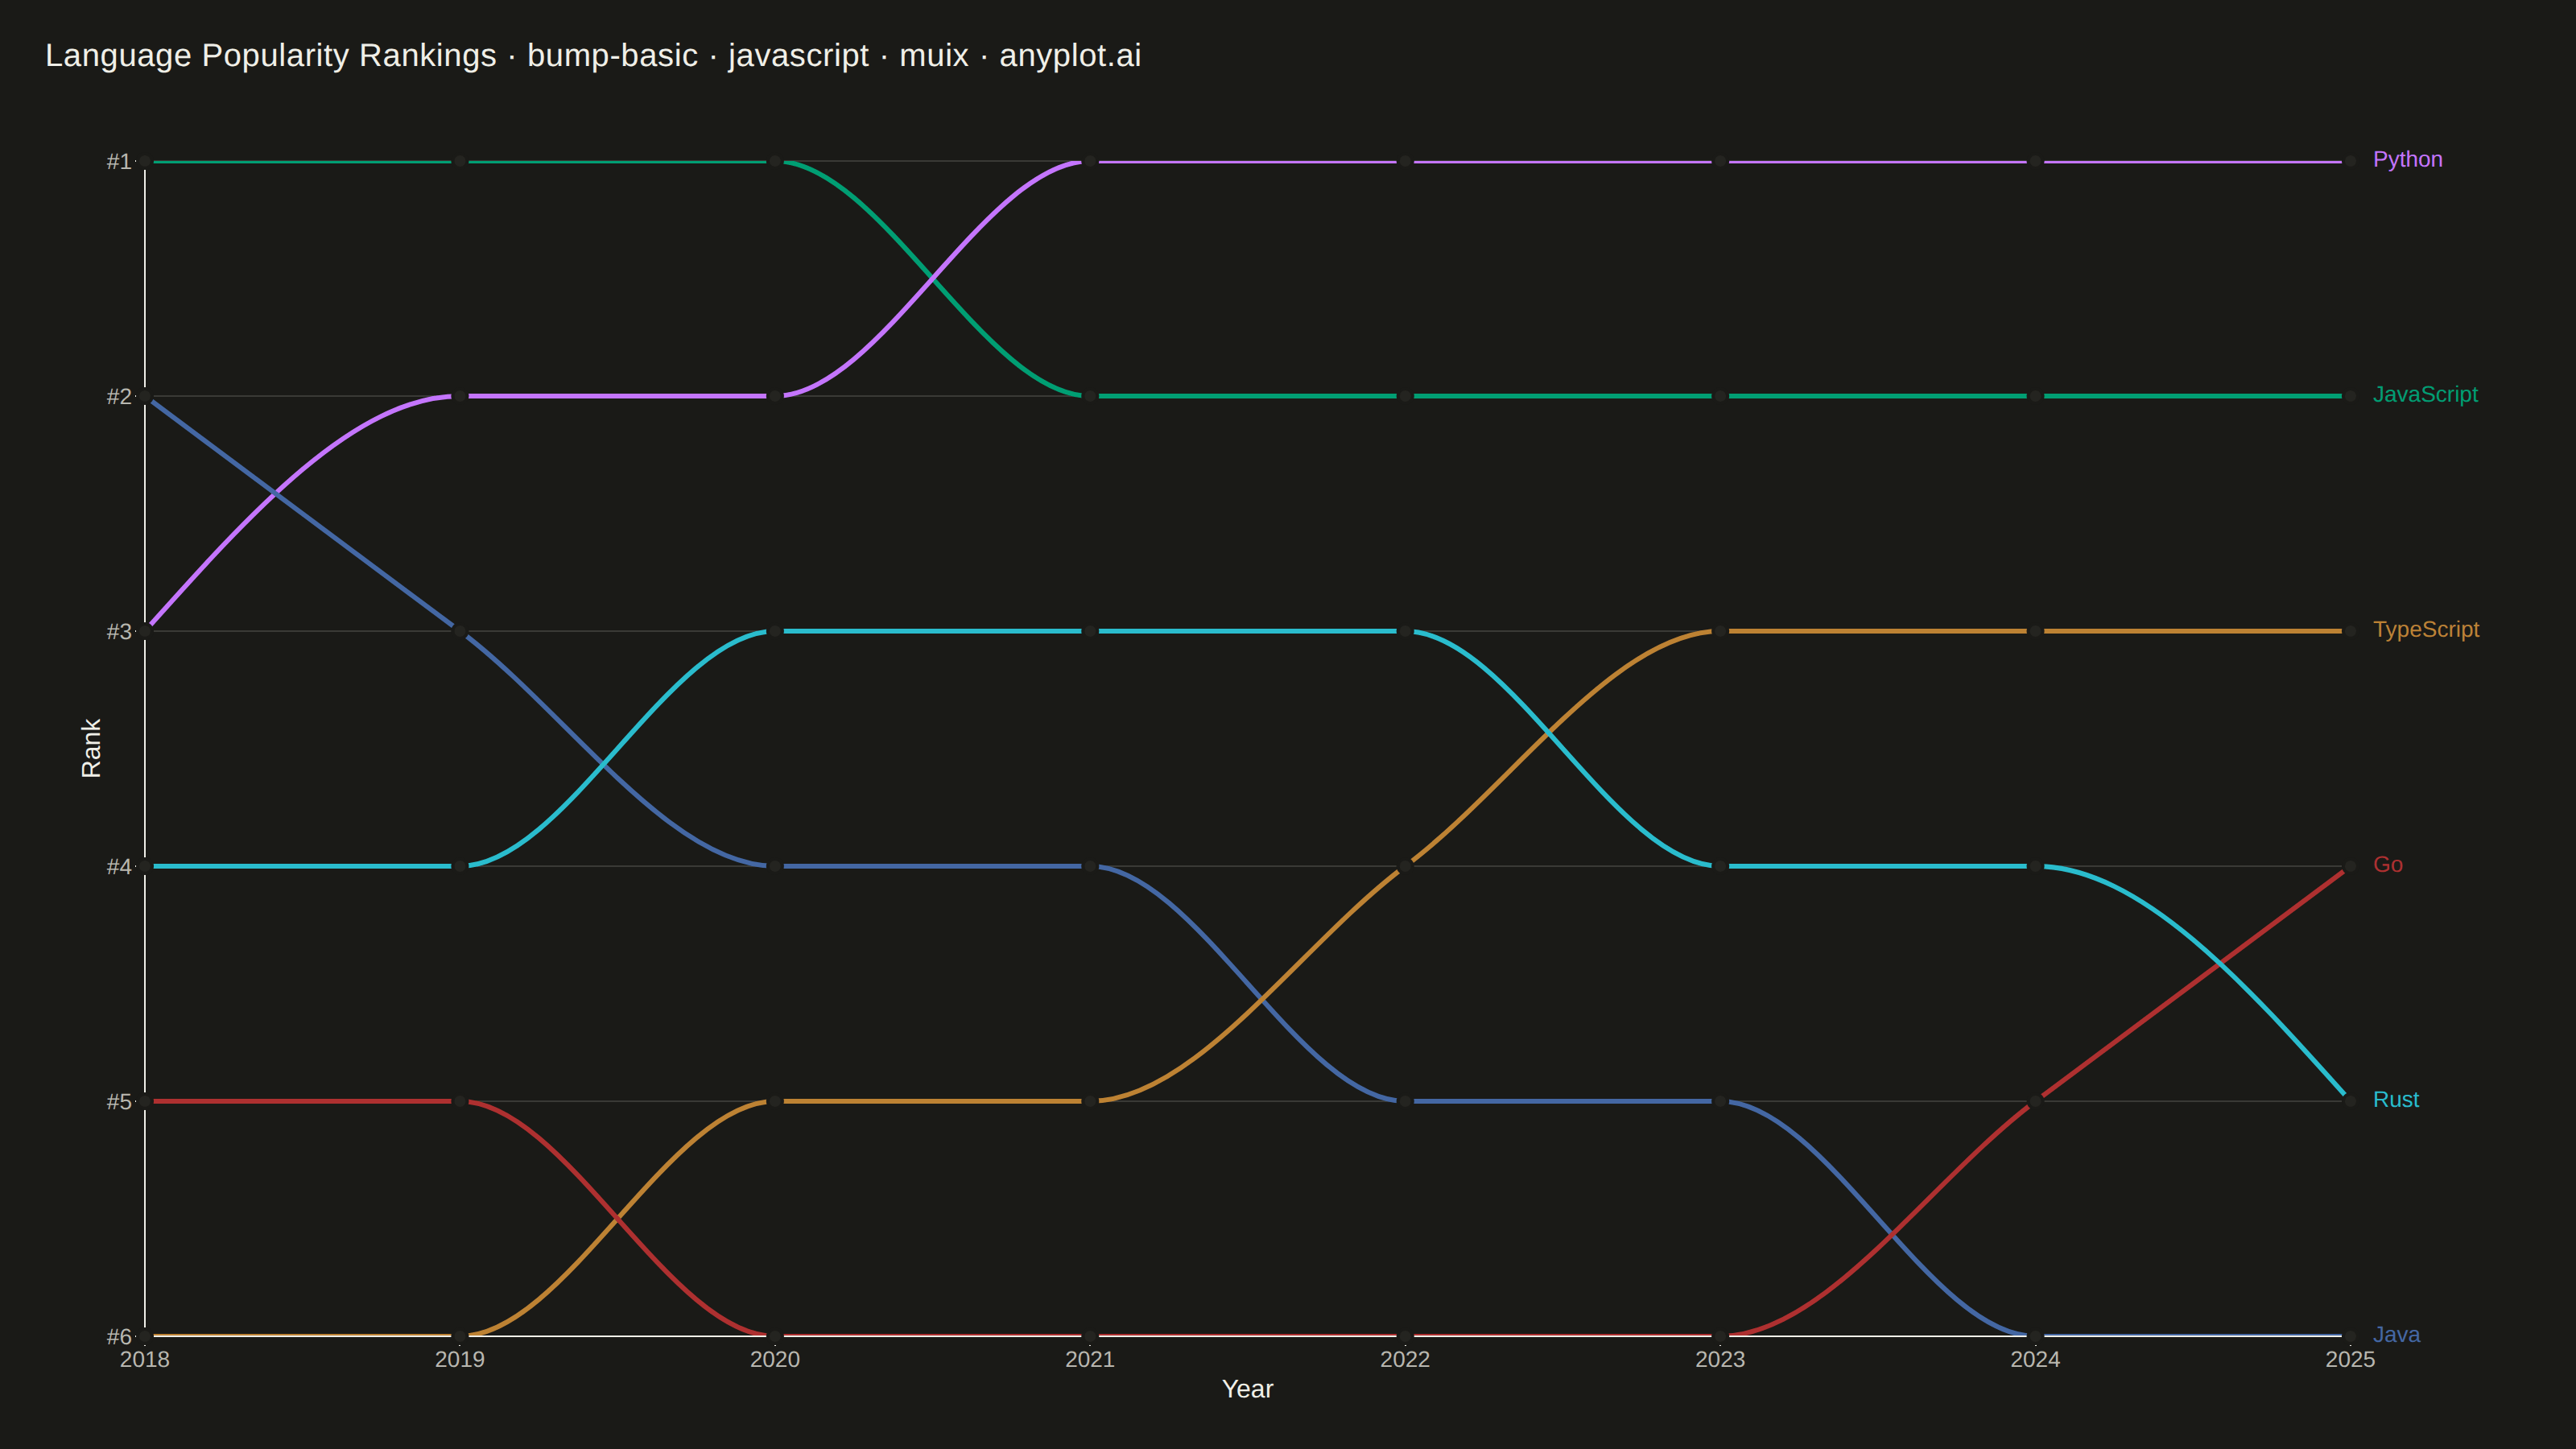
The same plot in 14 other libraries — JavaScript: Chart.js, D3.js, Apache ECharts, Highcharts; Python: Altair, Bokeh, lets-plot, Matplotlib, Plotly, plotnine, Pygal, Seaborn; R: ggplot2; Julia: Makie.jl. Compare all 15 side by side: Basic Bump Chart in Python, R, Julia and JavaScript.
A bump chart visualizes how rankings change over time by plotting rank positions and connecting them with lines. Unlike line charts that show values, bump charts focus specifically on ordinal rankings, making it easy to track position changes, overtakes, and rank stability across time periods.
// anyplot.ai
// bump-basic: Basic Bump Chart
// Library: muix 7.29.1 | JavaScript 22.23.2
// Quality: 90/100 | Created: 2026-08-24

import { LineChart } from "@mui/x-charts/LineChart";
import { useXScale, useYScale } from "@mui/x-charts/hooks";

const t = window.ANYPLOT_TOKENS;

// --- Data: programming-language popularity rank by year, 2018-2025 ----------
// Each year column is a permutation of 1..6 (one rank per language).
const YEARS = ["2018", "2019", "2020", "2021", "2022", "2023", "2024", "2025"];

const LANGUAGES = [
  { name: "JavaScript", ranks: [1, 1, 1, 2, 2, 2, 2, 2] },
  { name: "Python", ranks: [3, 2, 2, 1, 1, 1, 1, 1] },
  { name: "Java", ranks: [2, 3, 4, 4, 5, 5, 6, 6] },
  { name: "TypeScript", ranks: [6, 6, 5, 5, 4, 3, 3, 3] },
  { name: "Go", ranks: [5, 5, 6, 6, 6, 6, 5, 4] },
  { name: "Rust", ranks: [4, 4, 3, 3, 3, 4, 4, 5] },
];

// Slugified id (no spaces) so per-series CSS selectors stay valid.
const slug = (name) => name.replace(/\s+/g, "-");

const series = LANGUAGES.map((lang, i) => ({
  id: slug(lang.name),
  data: lang.ranks,
  label: lang.name,
  color: t.palette[i],
  showMark: true,
  curve: "monotoneX",
}));

// Direct end-of-line labels replace the legend — with 6 close hues, naming
// each line right where it finishes is a clearer identity cue than a
// color-matching exercise against a corner legend.
function EndLabels() {
  const xScale = useXScale();
  const yScale = useYScale();
  const xEnd = xScale(YEARS[YEARS.length - 1]);

  return (
    <g fontFamily="'Roboto','Helvetica Neue',Arial,sans-serif" fontSize={14}>
      {LANGUAGES.map((lang, i) => (
        <text
          key={lang.name}
          x={xEnd + 14}
          y={yScale(lang.ranks[lang.ranks.length - 1])}
          textAnchor="start"
          dominantBaseline="middle"
          fill={t.palette[i]}
          fontWeight={500}
        >
          {lang.name}
        </text>
      ))}
    </g>
  );
}

const TITLE = "Language Popularity Rankings · bump-basic · javascript · muix · anyplot.ai";
const TITLE_FONT_SIZE = Math.round(22 * Math.min(1, 67 / TITLE.length));
const TITLE_H = 70;

export default function Chart() {
  const { width, height } = window.ANYPLOT_SIZE;

  return (
    <div style={{ width, height, background: t.pageBg, boxSizing: "border-box" }}>
      <div style={{ height: TITLE_H, display: "flex", alignItems: "center", paddingLeft: 28 }}>
        <span
          style={{
            color: t.ink,
            fontSize: TITLE_FONT_SIZE,
            fontWeight: 500,
            fontFamily: "'Roboto','Helvetica Neue',Arial,sans-serif",
            letterSpacing: 0.3,
          }}
        >
          {TITLE}
        </span>
      </div>

      <LineChart
        width={width}
        height={height - TITLE_H}
        skipAnimation
        margin={{ top: 30, bottom: 70, left: 90, right: 140 }}
        xAxis={[
          {
            scaleType: "point",
            data: YEARS,
            label: "Year",
            labelStyle: { fontSize: 16, fill: t.ink },
            tickLabelStyle: { fontSize: 14, fill: t.inkSoft },
          },
        ]}
        yAxis={[
          {
            min: 1,
            max: 6,
            reverse: true,
            tickNumber: 6,
            valueFormatter: (v) => `#${Math.round(v)}`,
            label: "Rank",
            labelStyle: { fontSize: 16, fill: t.ink },
            tickLabelStyle: { fontSize: 14, fill: t.inkSoft },
          },
        ]}
        series={series}
        grid={{ horizontal: true, vertical: false }}
        slotProps={{ legend: { hidden: true } }}
        sx={{
          "& .MuiLineElement-root": { strokeWidth: 3 },
          "& .MuiMarkElement-root": { r: 5, stroke: t.pageBg, strokeWidth: 2 },
          "& .MuiChartsAxis-line": { stroke: t.inkSoft },
          "& .MuiChartsAxis-tick": { stroke: t.inkSoft },
          "& .MuiChartsGrid-line": { stroke: t.grid },
        }}
      >
        <EndLabels />
      </LineChart>
    </div>
  );
}
Runnable source as JSON, for any HTTP client: https://api.anyplot.ai/specs/bump-basic/muix/code. Any spec id and library id listed in llms-full.txt fit the same URL shape; every URL below is complete and callable.
{
  "spec_id": "bump-basic",
  "language": "javascript",
  "library": "muix",
  "page": "https://anyplot.ai/bump-basic/javascript/muix",
  "hub": "https://anyplot.ai/bump-basic",
  "code_json": "https://api.anyplot.ai/specs/bump-basic/muix/code",
  "spec_json": "https://api.anyplot.ai/specs/bump-basic",
  "render_light_png": "https://storage.googleapis.com/anyplot-images/plots/bump-basic/javascript/muix/plot-light.png",
  "render_dark_png": "https://storage.googleapis.com/anyplot-images/plots/bump-basic/javascript/muix/plot-dark.png",
  "interactive_light_html": "https://storage.googleapis.com/anyplot-images/plots/bump-basic/javascript/muix/plot-light.html",
  "interactive_dark_html": "https://storage.googleapis.com/anyplot-images/plots/bump-basic/javascript/muix/plot-dark.html",
  "quality_score": 90.0,
  "license": "MIT",
  "guide": "https://anyplot.ai/llms.txt"
}
Part of Basic Bump Chart on anyplot.ai.