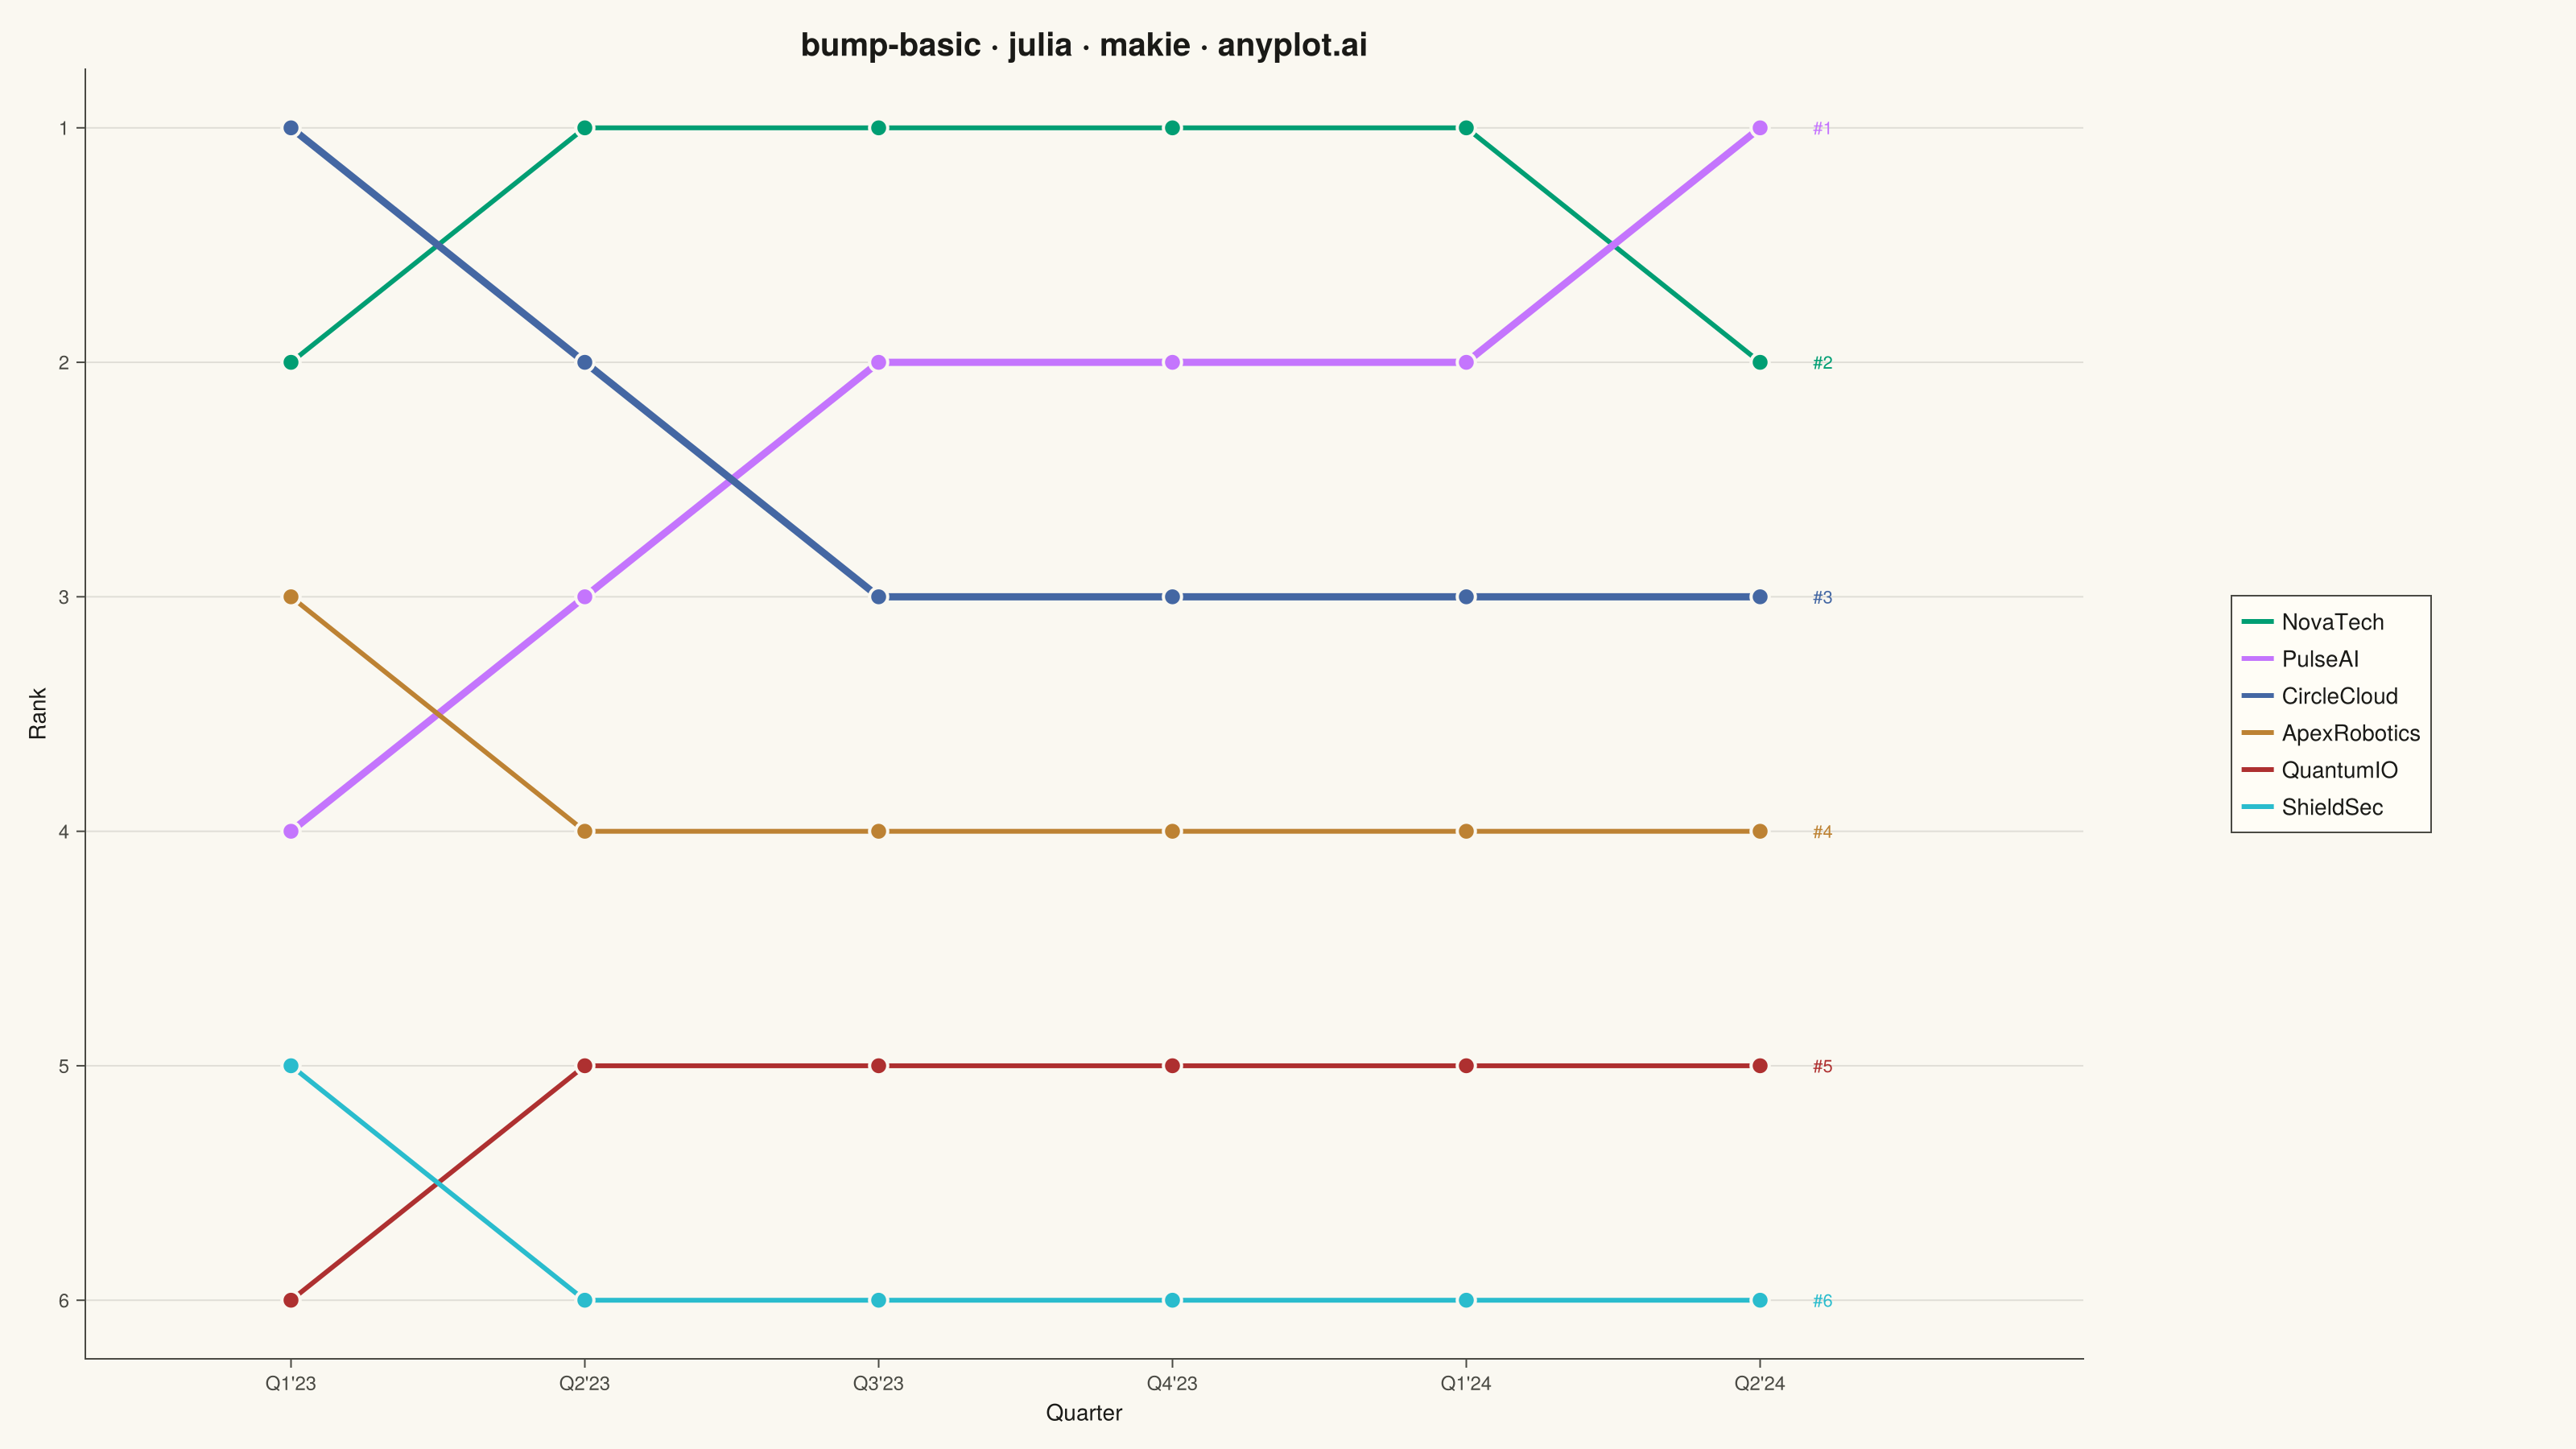
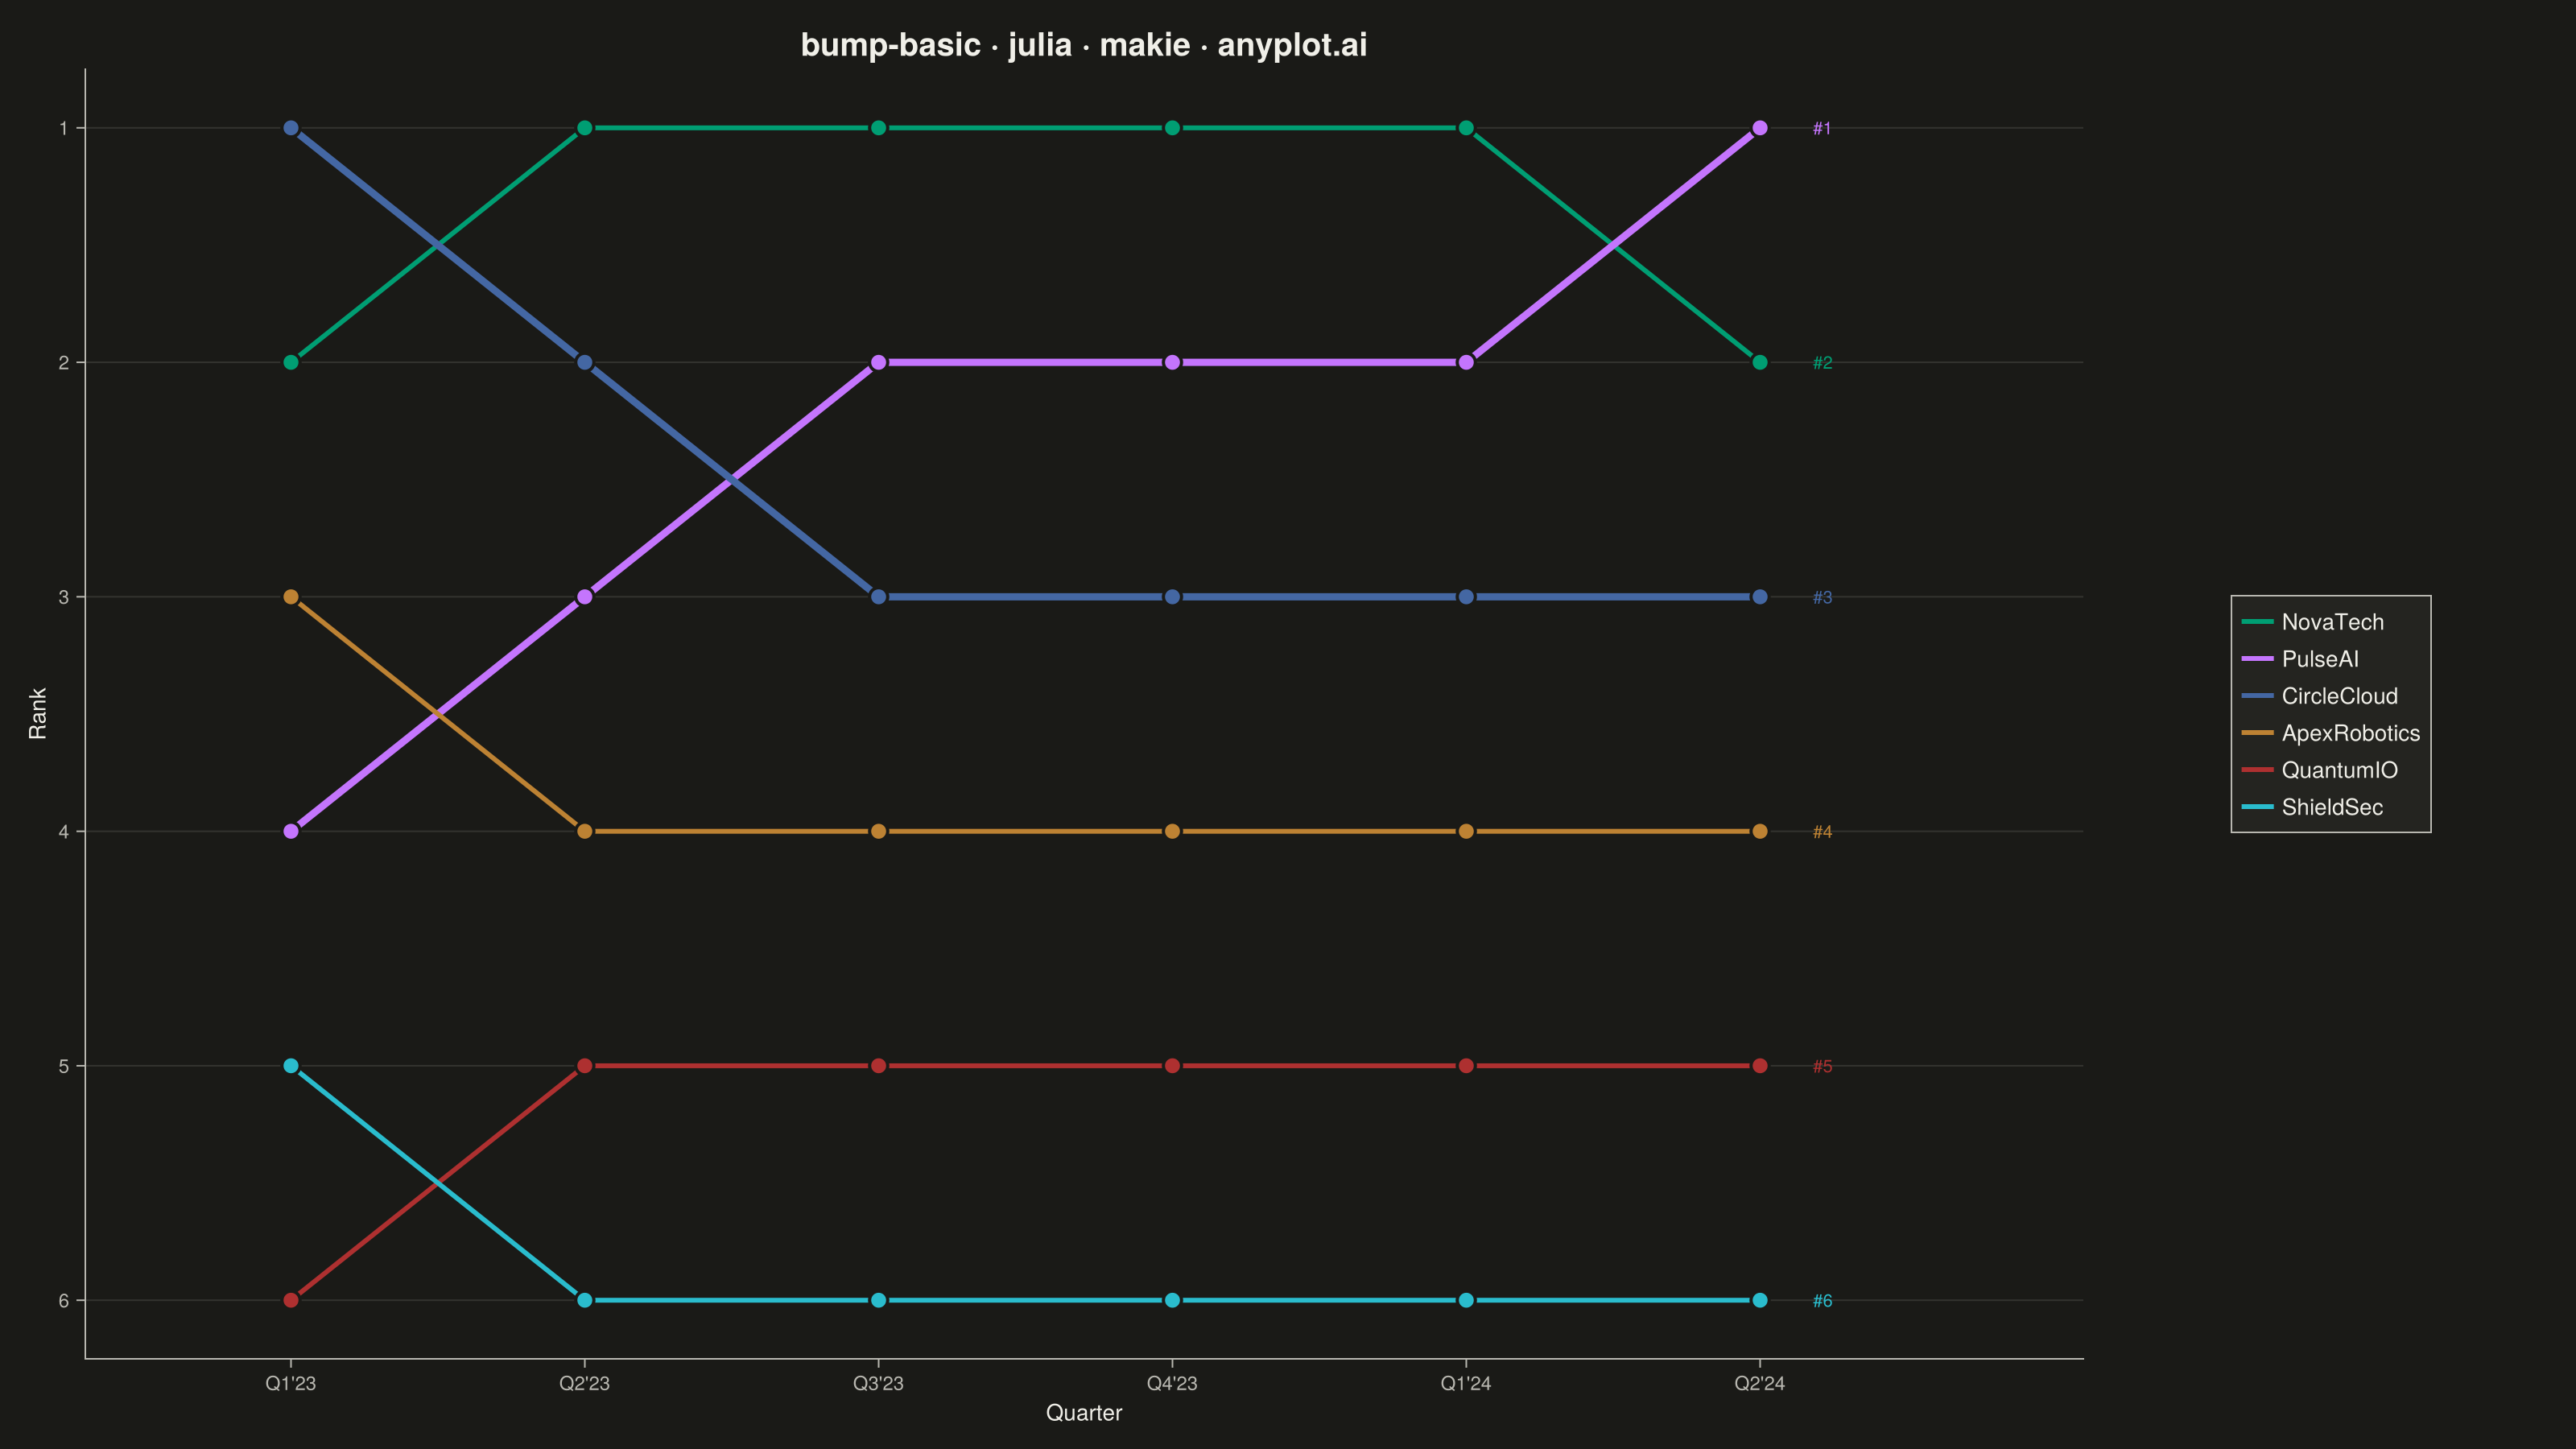
The same plot in 14 other libraries — Python: Altair, Bokeh, lets-plot, Matplotlib, Plotly, plotnine, Pygal, Seaborn; R: ggplot2; JavaScript: Chart.js, D3.js, Apache ECharts, Highcharts, MUI X Charts. Compare all 15 side by side: Basic Bump Chart in Python, R, Julia and JavaScript.
A bump chart visualizes how rankings change over time by plotting rank positions and connecting them with lines. Unlike line charts that show values, bump charts focus specifically on ordinal rankings, making it easy to track position changes, overtakes, and rank stability across time periods.
# anyplot.ai
# bump-basic: Basic Bump Chart
# Library: makie 0.22.10 | Julia 1.11.9
# Quality: 88/100 | Created: 2026-05-29

using CairoMakie
using Colors
using Random

Random.seed!(42)

# Theme tokens
const THEME       = get(ENV, "ANYPLOT_THEME", "light")
const PAGE_BG     = THEME == "light" ? colorant"#FAF8F1" : colorant"#1A1A17"
const ELEVATED_BG = THEME == "light" ? colorant"#FFFDF6" : colorant"#242420"
const INK         = THEME == "light" ? colorant"#1A1A17" : colorant"#F0EFE8"
const INK_SOFT    = THEME == "light" ? colorant"#4A4A44" : colorant"#B8B7B0"
const GRID_INK    = THEME == "light" ?
    RGBAf(26 / 255, 26 / 255, 23 / 255, 0.12) :
    RGBAf(240 / 255, 239 / 255, 232 / 255, 0.12)

const IMPRINT_PALETTE = [
    colorant"#009E73",
    colorant"#C475FD",
    colorant"#4467A3",
    colorant"#BD8233",
    colorant"#AE3030",
    colorant"#2ABCCD",
]

# Data — tech startup investor-ranking competition, Q1 2023 to Q2 2024
companies = ["NovaTech", "PulseAI", "CircleCloud", "ApexRobotics", "QuantumIO", "ShieldSec"]
quarters  = ["Q1'23", "Q2'23", "Q3'23", "Q4'23", "Q1'24", "Q2'24"]
n_periods   = length(quarters)
n_companies = length(companies)

# Rankings matrix (rows = companies, cols = quarters); 1 = highest rank
rankings = [
    2  1  1  1  1  2;   # NovaTech:     rises to top, then slips
    4  3  2  2  2  1;   # PulseAI:      steadily climbs to #1
    1  2  3  3  3  3;   # CircleCloud:  leads early, then fades
    3  4  4  4  4  4;   # ApexRobotics: stable mid-pack
    6  5  5  5  5  5;   # QuantumIO:    slight recovery
    5  6  6  6  6  6;   # ShieldSec:    slides to last
]

x = Float64.(1:n_periods)

# Plot
fig = Figure(
    size            = (1600, 900),
    fontsize        = 14,
    backgroundcolor = PAGE_BG,
)

ax = Axis(
    fig[1, 1];
    title              = "bump-basic · julia · makie · anyplot.ai",
    titlesize          = 20,
    titlecolor         = INK,
    xlabel             = "Quarter",
    ylabel             = "Rank",
    xlabelsize         = 14,
    ylabelsize         = 14,
    xlabelcolor        = INK,
    ylabelcolor        = INK,
    xticklabelsize     = 12,
    yticklabelsize     = 12,
    xticklabelcolor    = INK_SOFT,
    yticklabelcolor    = INK_SOFT,
    xtickcolor         = INK_SOFT,
    ytickcolor         = INK_SOFT,
    backgroundcolor    = PAGE_BG,
    topspinevisible    = false,
    rightspinevisible  = false,
    leftspinecolor     = INK_SOFT,
    bottomspinecolor   = INK_SOFT,
    xticks             = (x, quarters),
    yticks             = 1:n_companies,
    yreversed          = true,
    xgridvisible       = false,
    ygridvisible       = true,
    ygridcolor         = GRID_INK,
    xminorgridvisible  = false,
    yminorgridvisible  = false,
    limits             = (0.3, n_periods + 1.1, nothing, nothing),
)

for i in 1:n_companies
    ranks = Float64.(rankings[i, :])
    color = IMPRINT_PALETTE[i]
    # Thicker stroke on the two most dramatic arcs: PulseAI (#1 climber) and CircleCloud (biggest faller)
    lw = (i == 2 || i == 3) ? 4.5 : 3.0
    lines!(ax, x, ranks; color = color, linewidth = lw)
    scatter!(ax, x, ranks;
        color       = color,
        markersize  = 16,
        strokecolor = PAGE_BG,
        strokewidth = 2,
    )
    # Endpoint rank callouts via Makie's text! — surface final positions for storytelling
    text!(ax, n_periods + 0.18, Float64(rankings[i, end]);
        text     = "#$(rankings[i, end])",
        fontsize = 11,
        color    = color,
        align    = (:left, :center),
    )
end

legend_elements = [LineElement(color = IMPRINT_PALETTE[i], linewidth = 3.0) for i in 1:n_companies]
Legend(
    fig[1, 2],
    legend_elements,
    companies;
    backgroundcolor = ELEVATED_BG,
    framecolor      = INK_SOFT,
    labelcolor      = INK,
)

# Proportion the legend column to ~18% of figure width using colsize!
colsize!(fig.layout, 2, Relative(0.18))

# Save
save("plot-$(THEME).png", fig; px_per_unit = 2)
Runnable source as JSON, for any HTTP client: https://api.anyplot.ai/specs/bump-basic/makie/code. Any spec id and library id listed in llms-full.txt fit the same URL shape; every URL below is complete and callable.
{
  "spec_id": "bump-basic",
  "language": "julia",
  "library": "makie",
  "page": "https://anyplot.ai/bump-basic/julia/makie",
  "hub": "https://anyplot.ai/bump-basic",
  "code_json": "https://api.anyplot.ai/specs/bump-basic/makie/code",
  "spec_json": "https://api.anyplot.ai/specs/bump-basic",
  "render_light_png": "https://storage.googleapis.com/anyplot-images/plots/bump-basic/julia/makie/plot-light.png",
  "render_dark_png": "https://storage.googleapis.com/anyplot-images/plots/bump-basic/julia/makie/plot-dark.png",
  "quality_score": 88.0,
  "license": "MIT",
  "guide": "https://anyplot.ai/llms.txt"
}
Part of Basic Bump Chart on anyplot.ai.