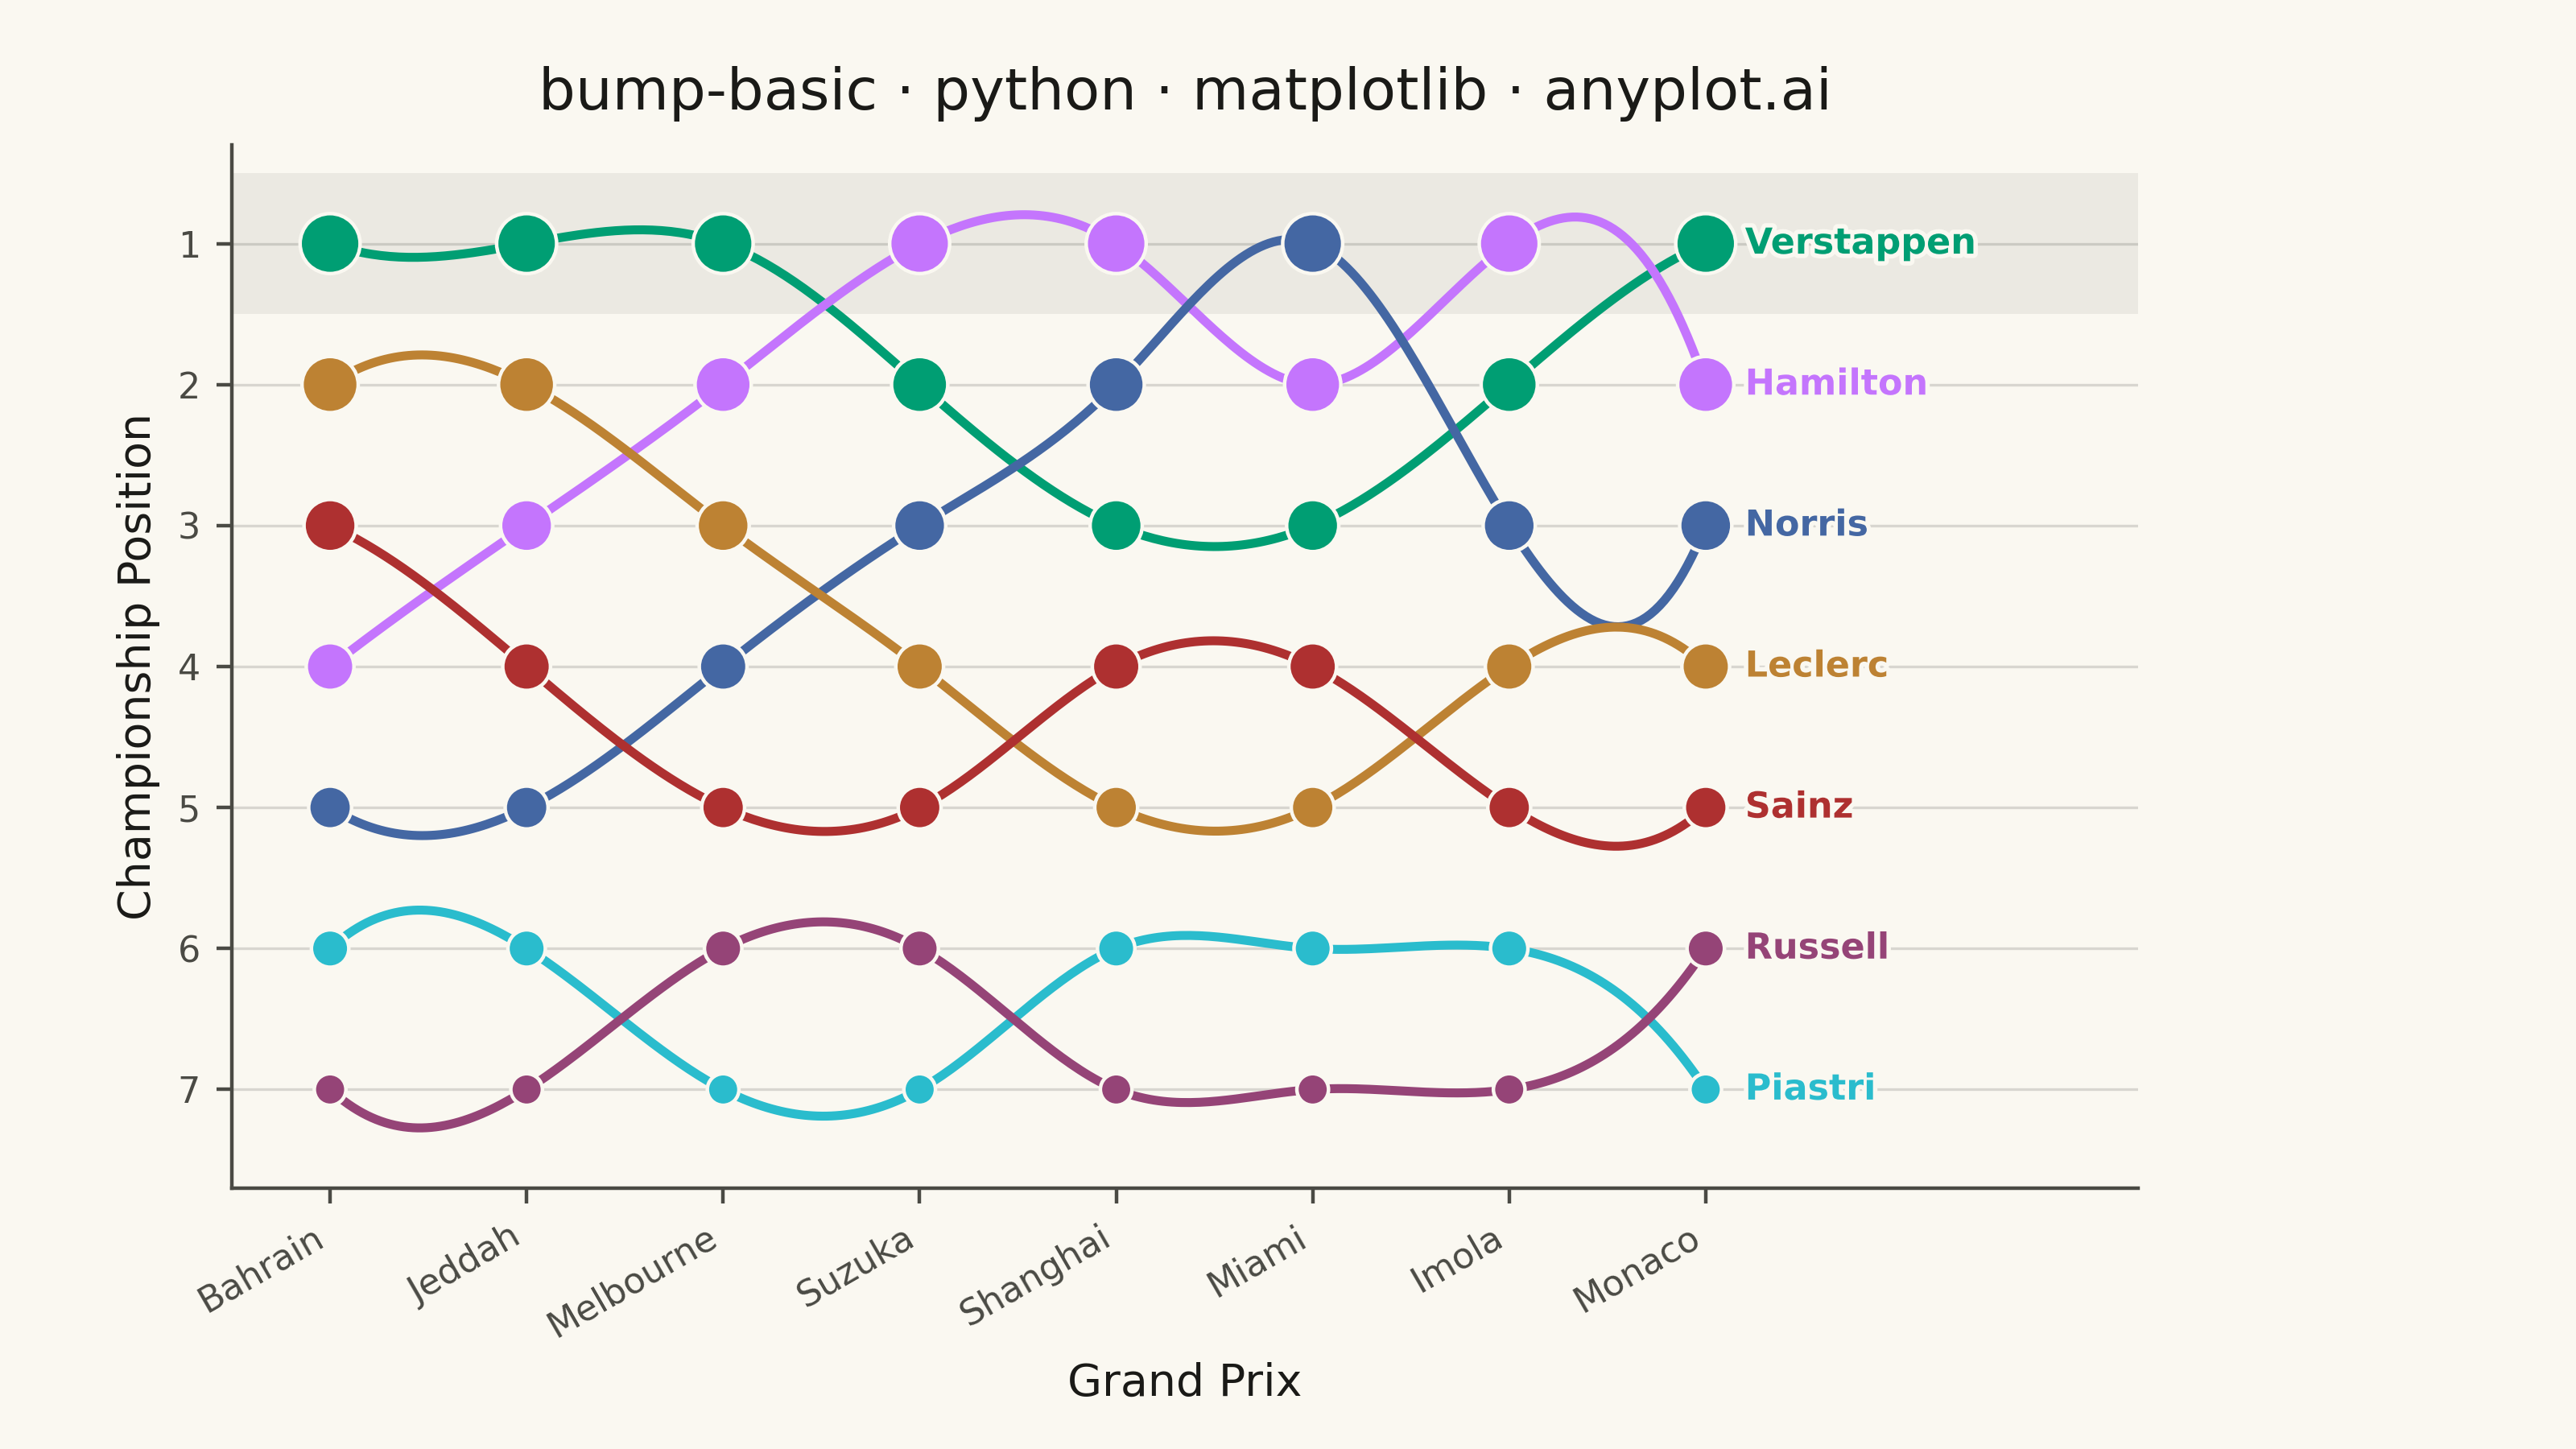
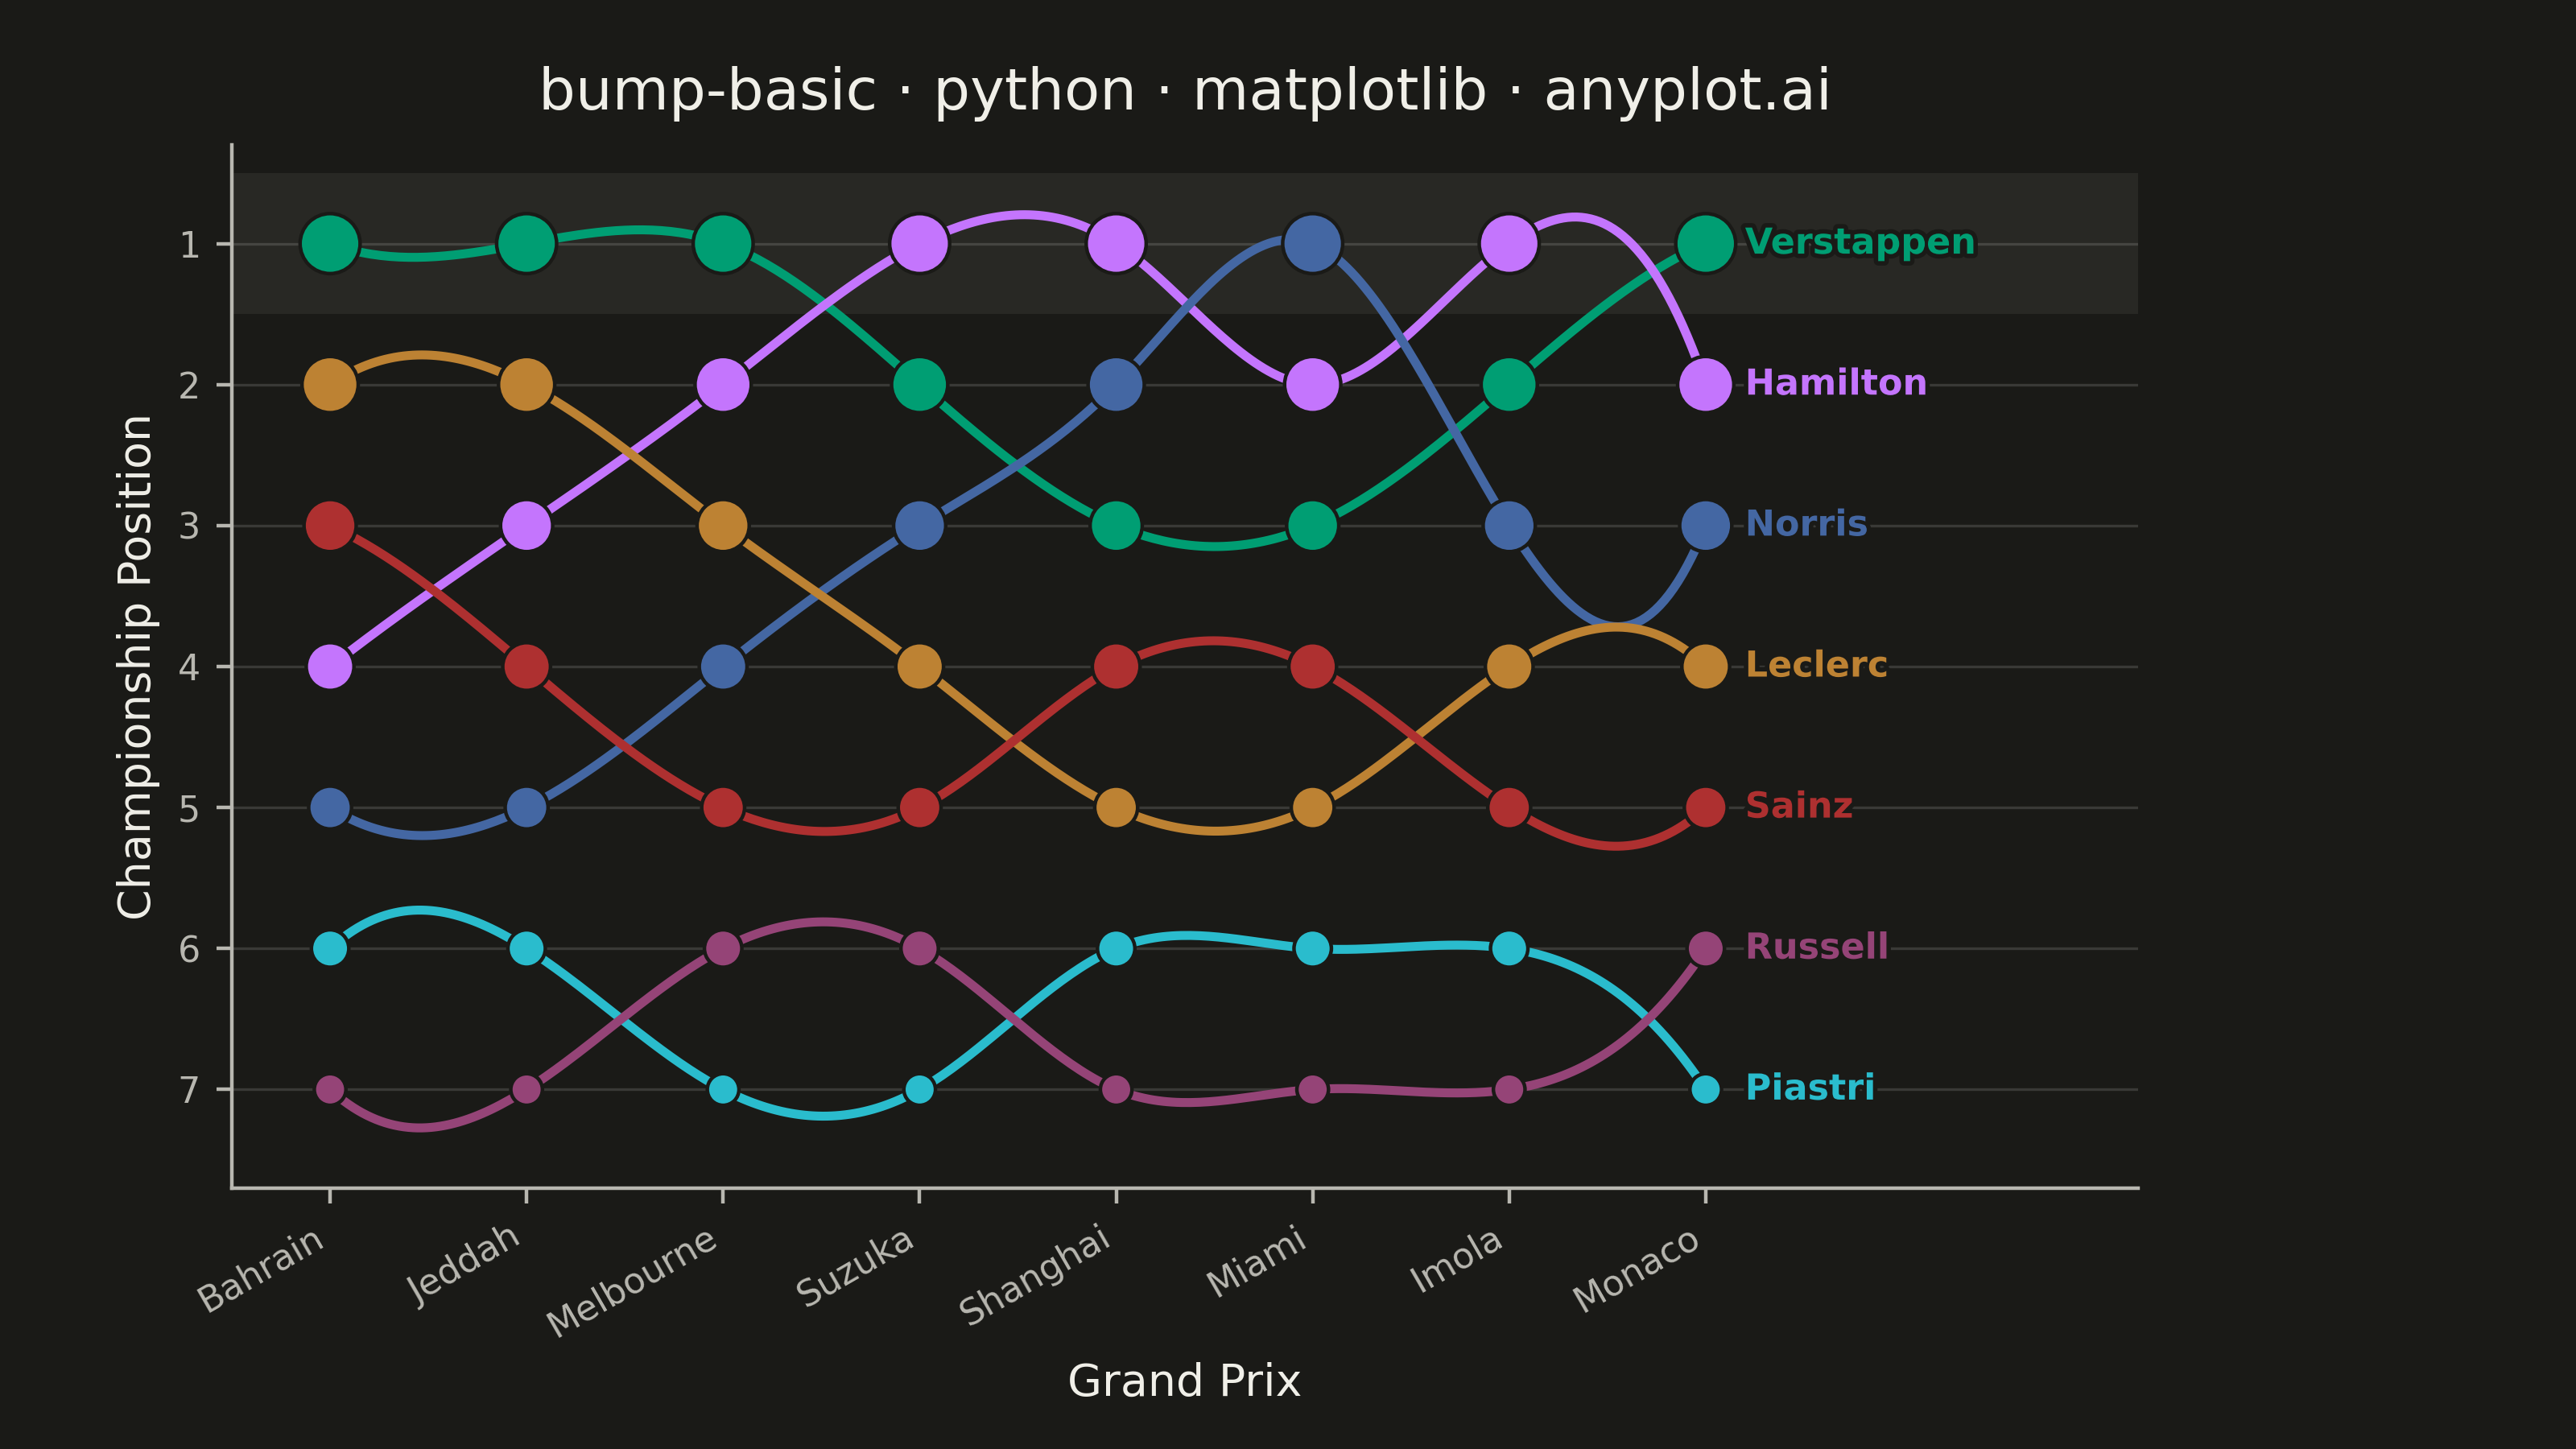
A bump chart visualizes how rankings change over time by plotting rank positions and connecting them with lines. Unlike line charts that show values, bump charts focus specifically on ordinal rankings, making it easy to track position changes, overtakes, and rank stability across time periods.
""" anyplot.ai
bump-basic: Basic Bump Chart
Library: matplotlib 3.10.9 | Python 3.13.13
Quality: 89/100 | Updated: 2026-05-29
"""

import os

import matplotlib.patheffects as pe
import matplotlib.pyplot as plt
import numpy as np
from scipy.interpolate import CubicSpline


# Theme
THEME = os.getenv("ANYPLOT_THEME", "light")
PAGE_BG = "#FAF8F1" if THEME == "light" else "#1A1A17"
ELEVATED_BG = "#FFFDF6" if THEME == "light" else "#242420"
INK = "#1A1A17" if THEME == "light" else "#F0EFE8"
INK_SOFT = "#4A4A44" if THEME == "light" else "#B8B7B0"
INK_MUTED = "#6B6A63" if THEME == "light" else "#A8A79F"

# Imprint palette — 8 hues, hybrid-v3 sort, theme-independent
IMPRINT_PALETTE = ["#009E73", "#C475FD", "#4467A3", "#BD8233", "#AE3030", "#2ABCCD", "#954477", "#99B314"]

# Data — Formula 1 driver standings over an 8-race season
drivers = ["Verstappen", "Hamilton", "Norris", "Leclerc", "Sainz", "Piastri", "Russell"]
races = ["Bahrain", "Jeddah", "Melbourne", "Suzuka", "Shanghai", "Miami", "Imola", "Monaco"]

rankings = {
    "Verstappen": [1, 1, 1, 2, 3, 3, 2, 1],
    "Hamilton": [4, 3, 2, 1, 1, 2, 1, 2],
    "Norris": [5, 5, 4, 3, 2, 1, 3, 3],
    "Leclerc": [2, 2, 3, 4, 5, 5, 4, 4],
    "Sainz": [3, 4, 5, 5, 4, 4, 5, 5],
    "Piastri": [6, 6, 7, 7, 6, 6, 6, 7],
    "Russell": [7, 7, 6, 6, 7, 7, 7, 6],
}

# Assign Imprint palette in canonical order
colors = {driver: IMPRINT_PALETTE[i] for i, driver in enumerate(drivers)}

# Canvas — landscape 3200 × 1800 px
fig, ax = plt.subplots(figsize=(8, 4.5), dpi=400, facecolor=PAGE_BG)
ax.set_facecolor(PAGE_BG)

x = np.arange(len(races))

# Subtle background band for the P1 zone — visual emphasis replacing narrative annotations
ax.axhspan(0.5, 1.5, color=INK_MUTED, alpha=0.10, zorder=0, linewidth=0)

for driver, ranks in rankings.items():
    ranks_arr = np.array(ranks)
    col = colors[driver]

    # Smooth S-curve bump line via cubic spline interpolation
    cs = CubicSpline(x, ranks_arr)
    x_smooth = np.linspace(x[0], x[-1], 300)
    y_smooth = cs(x_smooth)
    ax.plot(x_smooth, y_smooth, linewidth=2.0, color=col, zorder=3, solid_capstyle="round")

    # Markers — size encodes rank prominence: rank 1 → largest, rank 7 → smallest
    marker_s = [max(50, 180 - (r - 1) * 22) for r in ranks_arr]
    ax.scatter(x, ranks_arr, s=marker_s, color=col, edgecolors=PAGE_BG, linewidths=0.8, zorder=4)

    # End-of-line label with PAGE_BG stroke for legibility in both themes
    ax.text(
        x[-1] + 0.2,
        ranks_arr[-1],
        driver,
        fontsize=8,
        fontweight="bold",
        color=col,
        va="center",
        path_effects=[pe.withStroke(linewidth=2, foreground=PAGE_BG)],
    )

# Invert Y-axis so rank 1 is at the top
ax.set_ylim(0.3, len(drivers) + 0.7)
ax.invert_yaxis()

# Labels
title = "bump-basic · python · matplotlib · anyplot.ai"
ax.set_title(title, fontsize=13, fontweight="medium", color=INK, pad=8)
ax.set_xlabel("Grand Prix", fontsize=10, color=INK)
ax.set_ylabel("Championship Position", fontsize=10, color=INK)

ax.set_xticks(x)
ax.set_xticklabels(races, rotation=30, ha="right")
ax.set_yticks(range(1, len(drivers) + 1))
ax.tick_params(axis="both", labelsize=8, colors=INK_SOFT, labelcolor=INK_SOFT)

# Subtle horizontal grid at each rank row
ax.yaxis.grid(True, alpha=0.15, color=INK, linewidth=0.6, zorder=1)

# Spines — L-frame
ax.spines["top"].set_visible(False)
ax.spines["right"].set_visible(False)
ax.spines["left"].set_color(INK_SOFT)
ax.spines["bottom"].set_color(INK_SOFT)

# Extra horizontal space for end-of-line labels
ax.set_xlim(-0.5, len(races) - 1 + 2.2)

fig.subplots_adjust(left=0.09, right=0.83, top=0.90, bottom=0.18)
plt.savefig(f"plot-{THEME}.png", dpi=400, facecolor=PAGE_BG)
Runnable source as JSON, for any HTTP client: https://api.anyplot.ai/specs/bump-basic/matplotlib/code. Any spec id and library id listed in llms-full.txt fit the same URL shape; every URL below is complete and callable.
{
  "spec_id": "bump-basic",
  "language": "python",
  "library": "matplotlib",
  "page": "https://anyplot.ai/bump-basic/python/matplotlib",
  "hub": "https://anyplot.ai/bump-basic",
  "code_json": "https://api.anyplot.ai/specs/bump-basic/matplotlib/code",
  "spec_json": "https://api.anyplot.ai/specs/bump-basic",
  "render_light_png": "https://storage.googleapis.com/anyplot-images/plots/bump-basic/python/matplotlib/plot-light.png",
  "render_dark_png": "https://storage.googleapis.com/anyplot-images/plots/bump-basic/python/matplotlib/plot-dark.png",
  "quality_score": 89.0,
  "license": "MIT",
  "guide": "https://anyplot.ai/llms.txt"
}
Part of Basic Bump Chart on anyplot.ai.