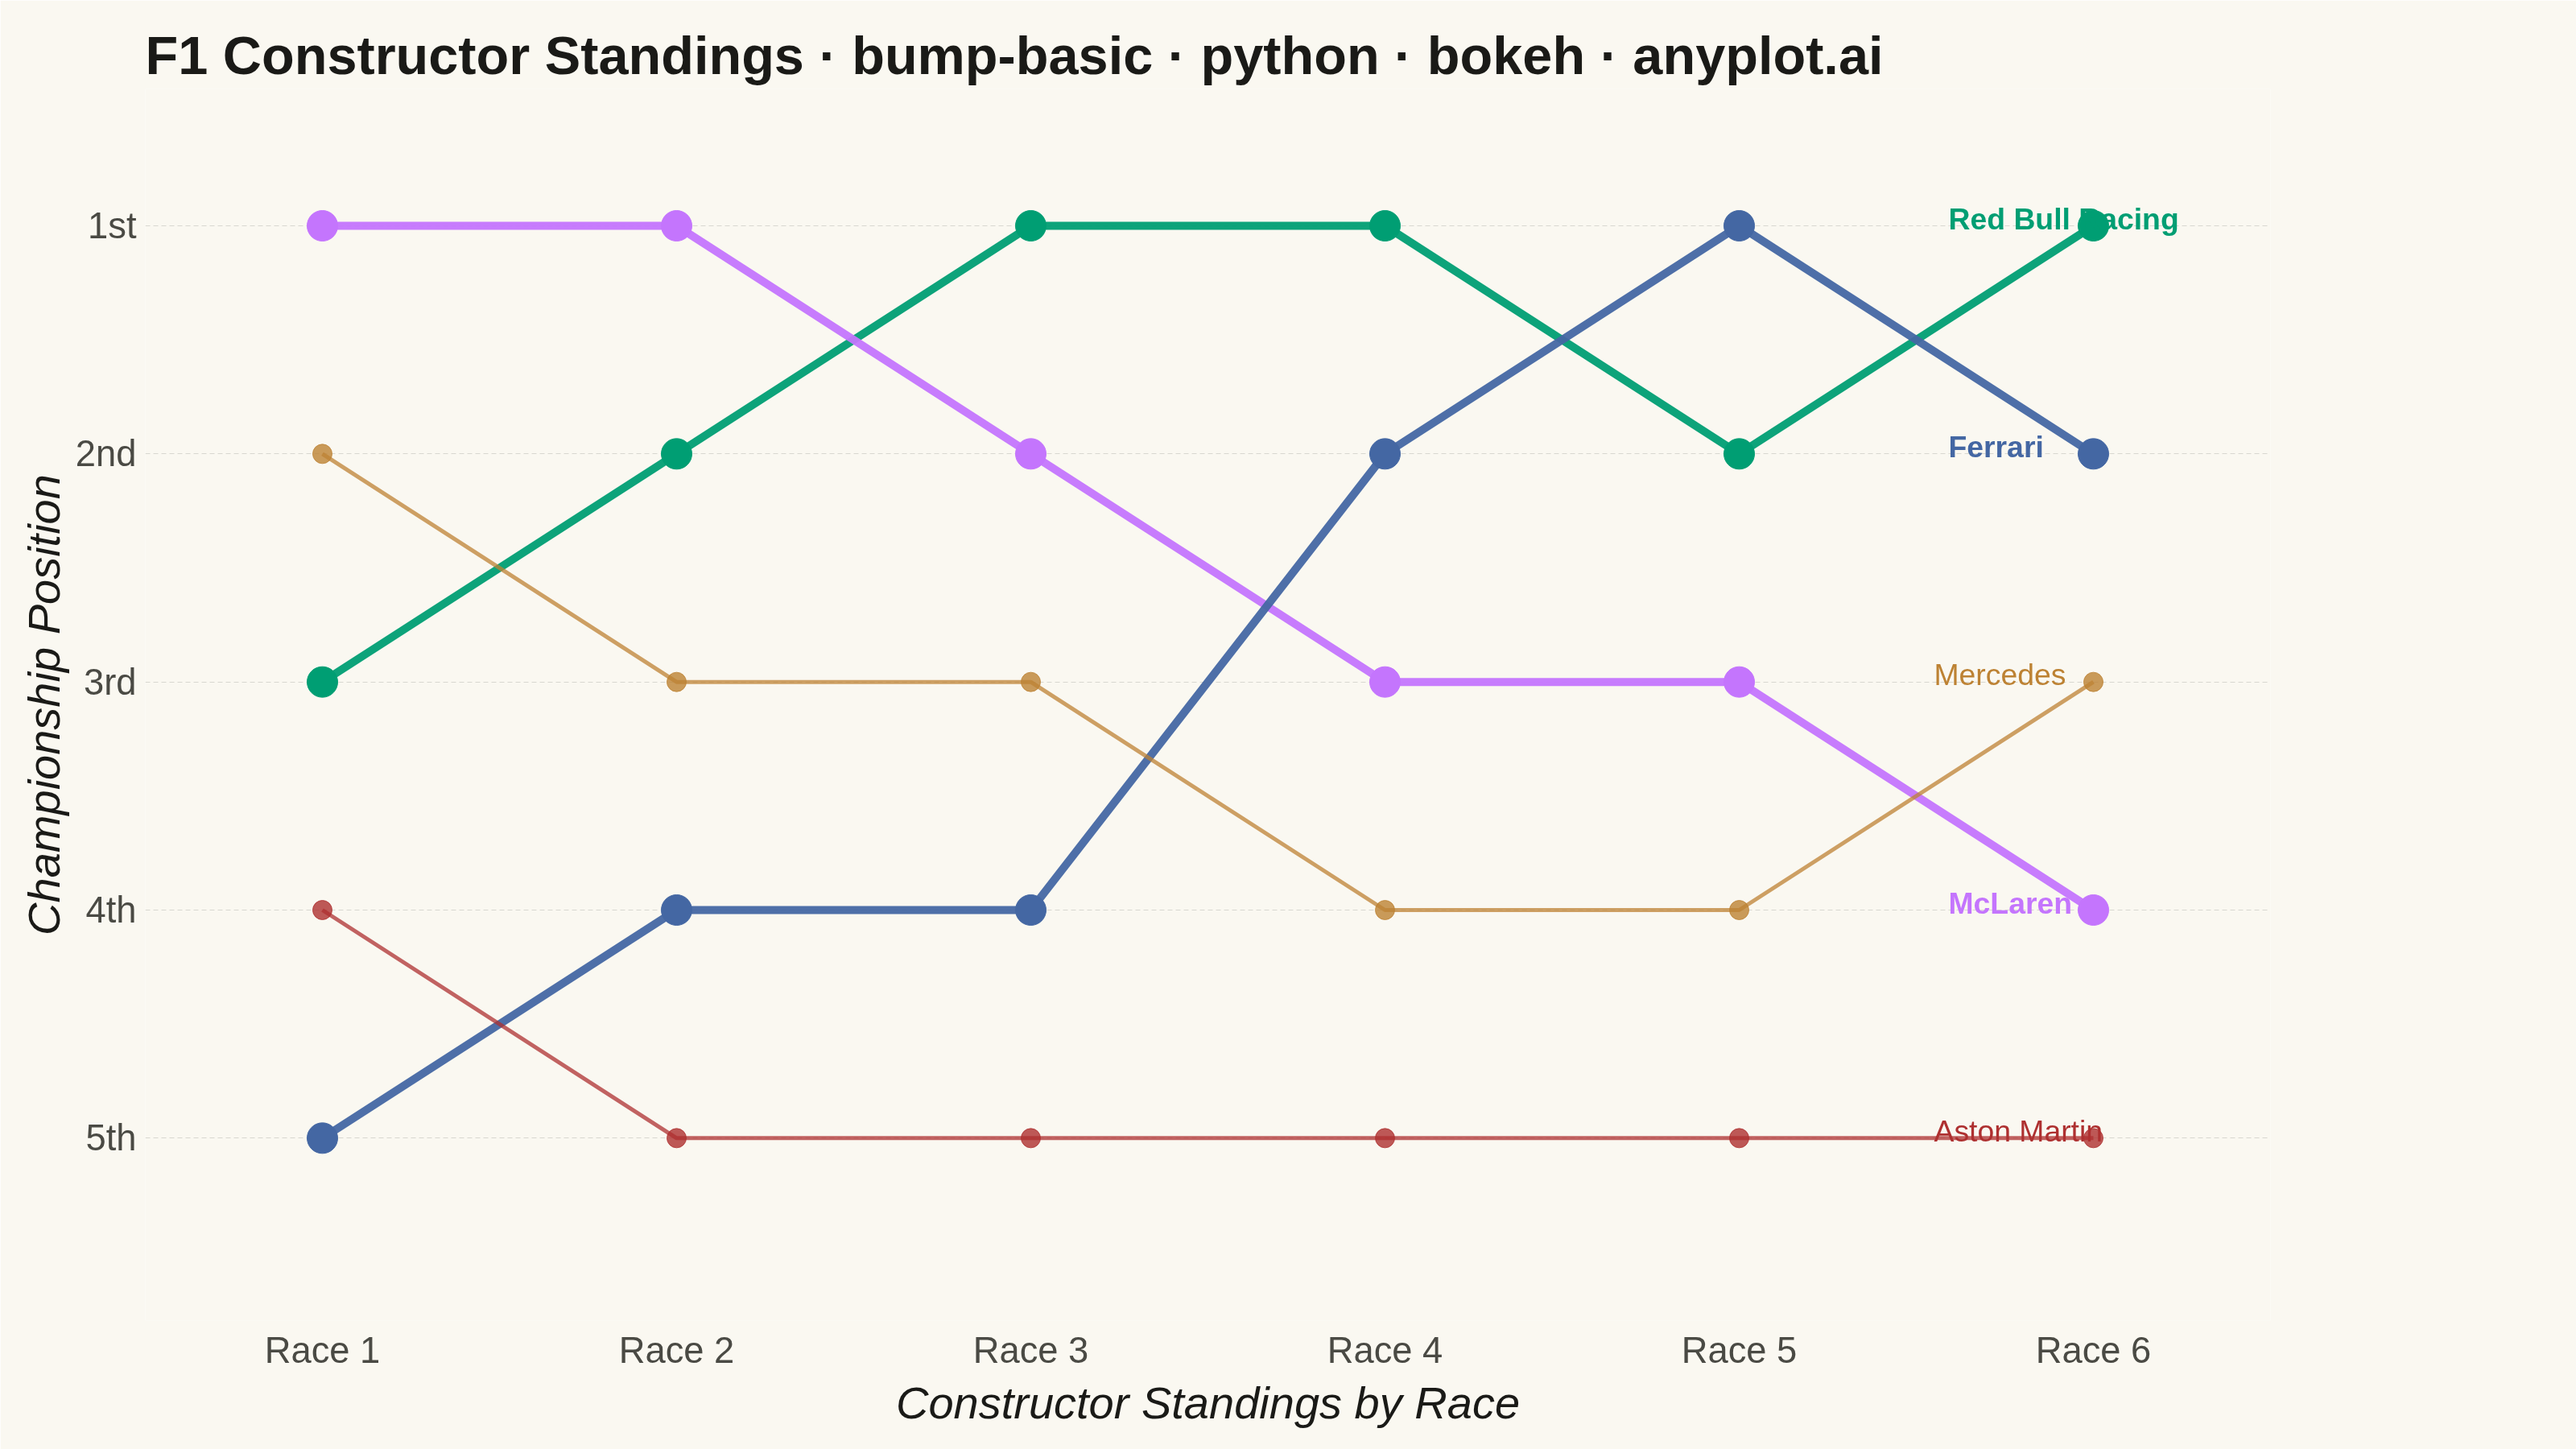
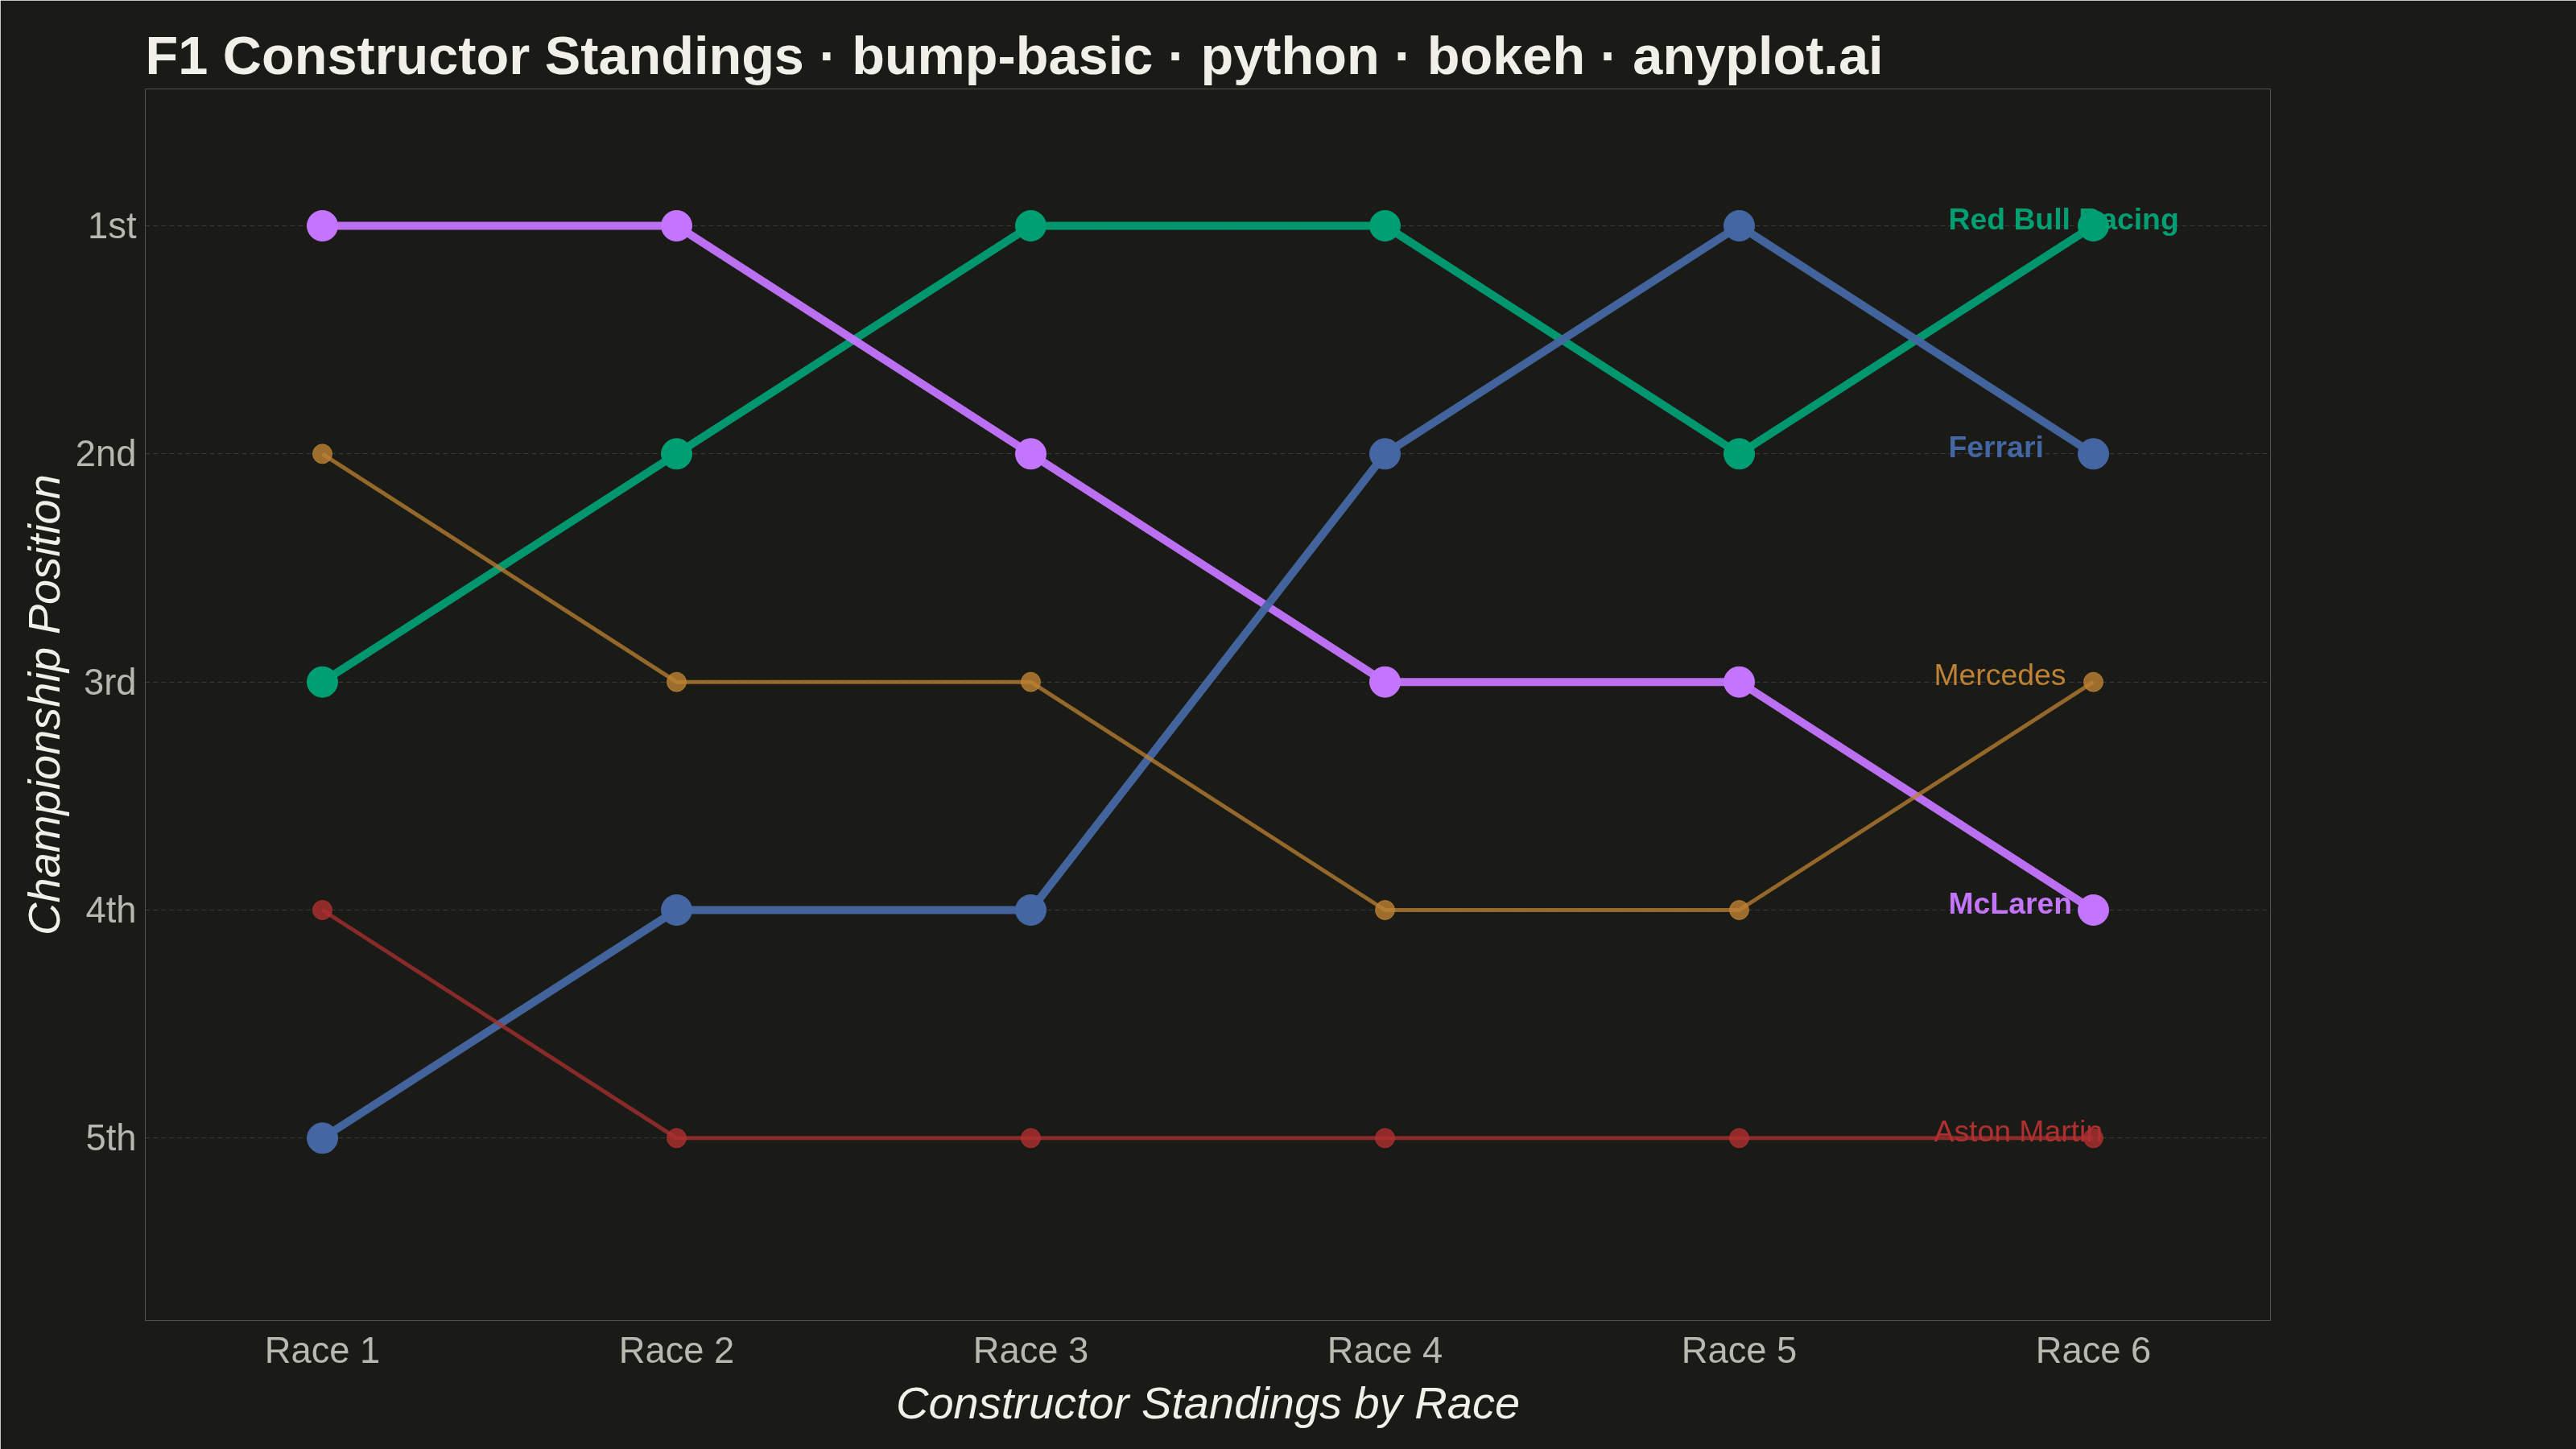
A bump chart visualizes how rankings change over time by plotting rank positions and connecting them with lines. Unlike line charts that show values, bump charts focus specifically on ordinal rankings, making it easy to track position changes, overtakes, and rank stability across time periods.
""" anyplot.ai
bump-basic: Basic Bump Chart
Library: bokeh 3.9.0 | Python 3.13.13
Quality: 88/100 | Updated: 2026-05-29
"""

import sys


# Remove the script's own directory so 'bokeh' resolves to the installed package,
# not this script file (bokeh.py would shadow the bokeh package otherwise).
if sys.path and sys.path[0]:
    sys.path = sys.path[1:]

import os
import time
from pathlib import Path

from bokeh.io import output_file, save
from bokeh.models import ColumnDataSource, CustomJSTickFormatter, FixedTicker, Label
from bokeh.plotting import figure
from bokeh.resources import INLINE
from selenium import webdriver
from selenium.webdriver.chrome.options import Options


# Theme tokens — Imprint palette, theme-adaptive chrome
THEME = os.getenv("ANYPLOT_THEME", "light")
PAGE_BG = "#FAF8F1" if THEME == "light" else "#1A1A17"
ELEVATED_BG = "#FFFDF6" if THEME == "light" else "#242420"
INK = "#1A1A17" if THEME == "light" else "#F0EFE8"
INK_SOFT = "#4A4A44" if THEME == "light" else "#B8B7B0"

# Imprint categorical palette — 8 hues, hybrid-v3 sort, theme-independent
IMPRINT_PALETTE = ["#009E73", "#C475FD", "#4467A3", "#BD8233", "#AE3030", "#2ABCCD", "#954477", "#99B314"]

# Data — Formula 1 constructor standings over a 6-race stretch
entities = ["Red Bull Racing", "McLaren", "Ferrari", "Mercedes", "Aston Martin"]
periods = ["Race 1", "Race 2", "Race 3", "Race 4", "Race 5", "Race 6"]

rankings = {
    "Red Bull Racing": [3, 2, 1, 1, 2, 1],
    "McLaren": [1, 1, 2, 3, 3, 4],
    "Ferrari": [5, 4, 4, 2, 1, 2],
    "Mercedes": [2, 3, 3, 4, 4, 3],
    "Aston Martin": [4, 5, 5, 5, 5, 5],
}

# Highlight entities with dramatic rank changes
highlight = {"Ferrari", "Red Bull Racing", "McLaren"}

# Title length → scale font size (floor 34pt)
title_str = "F1 Constructor Standings · bump-basic · python · bokeh · anyplot.ai"
n = len(title_str)
ratio = 67 / n if n > 67 else 1.0
title_fontsize = f"{max(34, round(50 * ratio))}pt"

# Figure — 3200×1800 landscape; toolbar_location=None keeps PNG at exact height
p = figure(
    width=3200,
    height=1800,
    title=title_str,
    x_range=periods,
    y_range=(5.8, 0.4),
    x_axis_label="Constructor Standings by Race",
    y_axis_label="Championship Position",
    toolbar_location=None,
    min_border_bottom=160,
    min_border_left=180,
    min_border_top=110,
    min_border_right=380,  # extra right margin for end-of-line team labels
)

# Lines and markers for each entity with visual hierarchy
for i, (entity, ranks) in enumerate(rankings.items()):
    source = ColumnDataSource(data={"x": periods, "y": ranks})
    is_highlight = entity in highlight
    lw = 10 if is_highlight else 5
    alpha_line = 0.95 if is_highlight else 0.75
    alpha_marker = 1.0 if is_highlight else 0.80
    marker_size = 38 if is_highlight else 24
    color = IMPRINT_PALETTE[i]

    p.line(x="x", y="y", source=source, line_width=lw, line_color=color, line_alpha=alpha_line)
    p.scatter(x="x", y="y", source=source, size=marker_size, color=color, alpha=alpha_marker)

    # End-of-line label at the final race position (integer index for categorical axis)
    label = Label(
        x=len(periods) - 1,
        y=ranks[-1],
        text=entity,
        text_font_size="28pt",
        text_color=color,
        text_alpha=1.0,
        text_font_style="bold" if is_highlight else "normal",
        x_offset=40 if is_highlight else 22,
        y_offset=-12,
    )
    p.add_layout(label)

# Font sizes — canonical 3200×1800 values
p.title.text_font_size = title_fontsize
p.title.text_font_style = "bold"
p.title.text_color = INK
p.xaxis.axis_label_text_font_size = "42pt"
p.yaxis.axis_label_text_font_size = "42pt"
p.xaxis.major_label_text_font_size = "34pt"
p.yaxis.major_label_text_font_size = "34pt"

# Theme-adaptive chrome
p.xaxis.axis_label_text_color = INK
p.yaxis.axis_label_text_color = INK
p.xaxis.major_label_text_color = INK_SOFT
p.yaxis.major_label_text_color = INK_SOFT

# Remove spines and ticks for a clean bump chart look
p.xaxis.axis_line_color = None
p.yaxis.axis_line_color = None
p.xaxis.major_tick_line_color = None
p.yaxis.major_tick_line_color = None
p.xaxis.minor_tick_line_color = None
p.yaxis.minor_tick_line_color = None

# Grid — horizontal guide lines only, very subtle
p.xgrid.grid_line_color = None
p.ygrid.grid_line_color = INK
p.ygrid.grid_line_alpha = 0.15
p.ygrid.grid_line_dash = [6, 4]

# Y-axis ordinal labels (1st, 2nd, 3rd…) via CustomJSTickFormatter
p.yaxis.ticker = FixedTicker(ticks=[1, 2, 3, 4, 5])
p.yaxis.formatter = CustomJSTickFormatter(
    code="""
    const suffixes = {1: 'st', 2: 'nd', 3: 'rd', 4: 'th', 5: 'th'};
    return tick + (suffixes[tick] || 'th');
"""
)

# Background
p.background_fill_color = PAGE_BG
p.border_fill_color = PAGE_BG
p.outline_line_color = None

# Save interactive HTML with inline resources so headless Chrome can render
# without network access (CDN-loaded bokeh JS fails in CI sandbox).
output_file(f"plot-{THEME}.html")
save(p, resources=INLINE)

# Screenshot via headless Chrome — use CDP setDeviceMetricsOverride so the
# inner viewport is authoritative (--window-size alone gives 1661 instead of 1800)
W, H = 3200, 1800
opts = Options()
for arg in (
    "--headless=new",
    "--no-sandbox",
    "--disable-dev-shm-usage",
    "--disable-gpu",
    f"--window-size={W},{H}",
    "--hide-scrollbars",
):
    opts.add_argument(arg)
driver = webdriver.Chrome(options=opts)
driver.execute_cdp_cmd(
    "Emulation.setDeviceMetricsOverride", {"width": W, "height": H, "deviceScaleFactor": 1, "mobile": False}
)
driver.get(f"file://{Path(f'plot-{THEME}.html').resolve()}")
time.sleep(3)
driver.save_screenshot(f"plot-{THEME}.png")
driver.quit()

# Pin saved PNG to exact target dims so the post-render gate always passes
from PIL import Image as _PILImage


_img = _PILImage.open(f"plot-{THEME}.png").convert("RGB")
if _img.size != (W, H):
    _norm = _PILImage.new("RGB", (W, H), PAGE_BG)
    _norm.paste(_img, ((W - _img.size[0]) // 2, (H - _img.size[1]) // 2))
    _norm.save(f"plot-{THEME}.png")
Runnable source as JSON, for any HTTP client: https://api.anyplot.ai/specs/bump-basic/bokeh/code. Any spec id and library id listed in llms-full.txt fit the same URL shape; every URL below is complete and callable.
{
  "spec_id": "bump-basic",
  "language": "python",
  "library": "bokeh",
  "page": "https://anyplot.ai/bump-basic/python/bokeh",
  "hub": "https://anyplot.ai/bump-basic",
  "code_json": "https://api.anyplot.ai/specs/bump-basic/bokeh/code",
  "spec_json": "https://api.anyplot.ai/specs/bump-basic",
  "render_light_png": "https://storage.googleapis.com/anyplot-images/plots/bump-basic/python/bokeh/plot-light.png",
  "render_dark_png": "https://storage.googleapis.com/anyplot-images/plots/bump-basic/python/bokeh/plot-dark.png",
  "interactive_light_html": "https://storage.googleapis.com/anyplot-images/plots/bump-basic/python/bokeh/plot-light.html",
  "interactive_dark_html": "https://storage.googleapis.com/anyplot-images/plots/bump-basic/python/bokeh/plot-dark.html",
  "quality_score": 88.0,
  "license": "MIT",
  "guide": "https://anyplot.ai/llms.txt"
}
Part of Basic Bump Chart on anyplot.ai.