The same plot in 14 other libraries — JavaScript: D3.js, Apache ECharts, Highcharts, MUI X Charts; Python: Altair, Bokeh, lets-plot, Matplotlib, Plotly, plotnine, Pygal, Seaborn; R: ggplot2; Julia: Makie.jl. Compare all 15 side by side: Beer-Lambert Calibration Curve in Python, R, Julia and JavaScript.
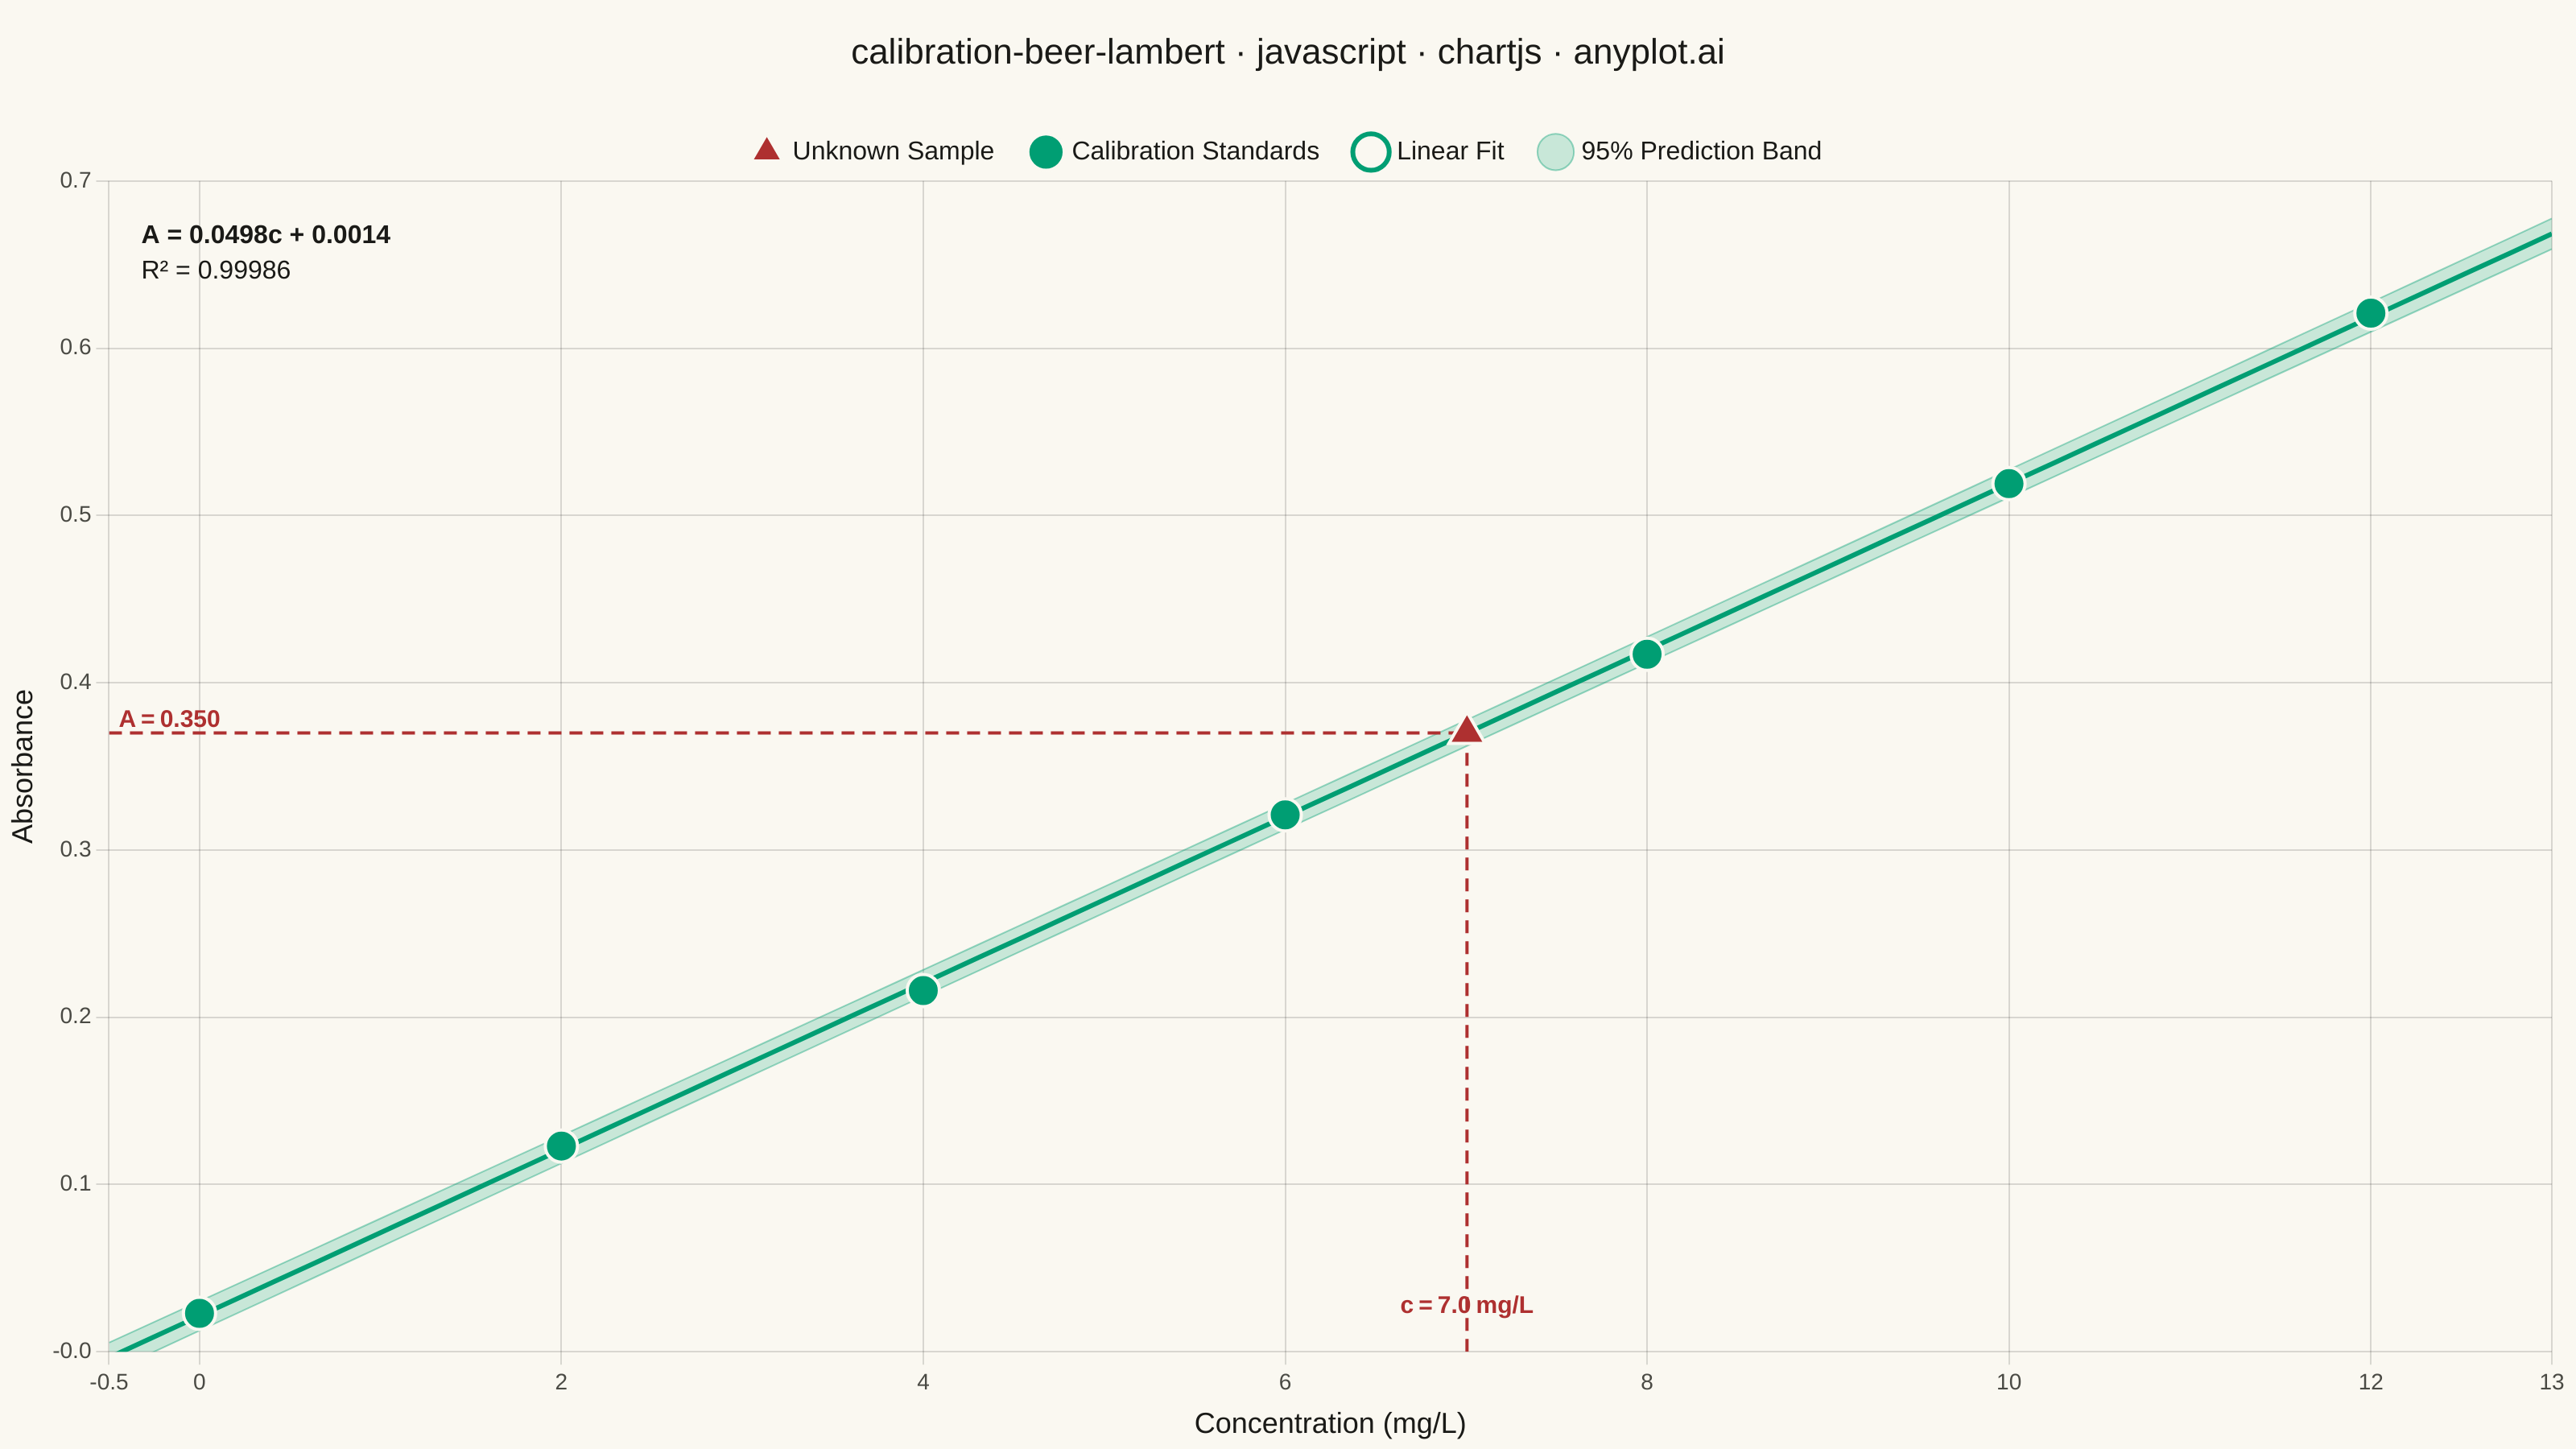
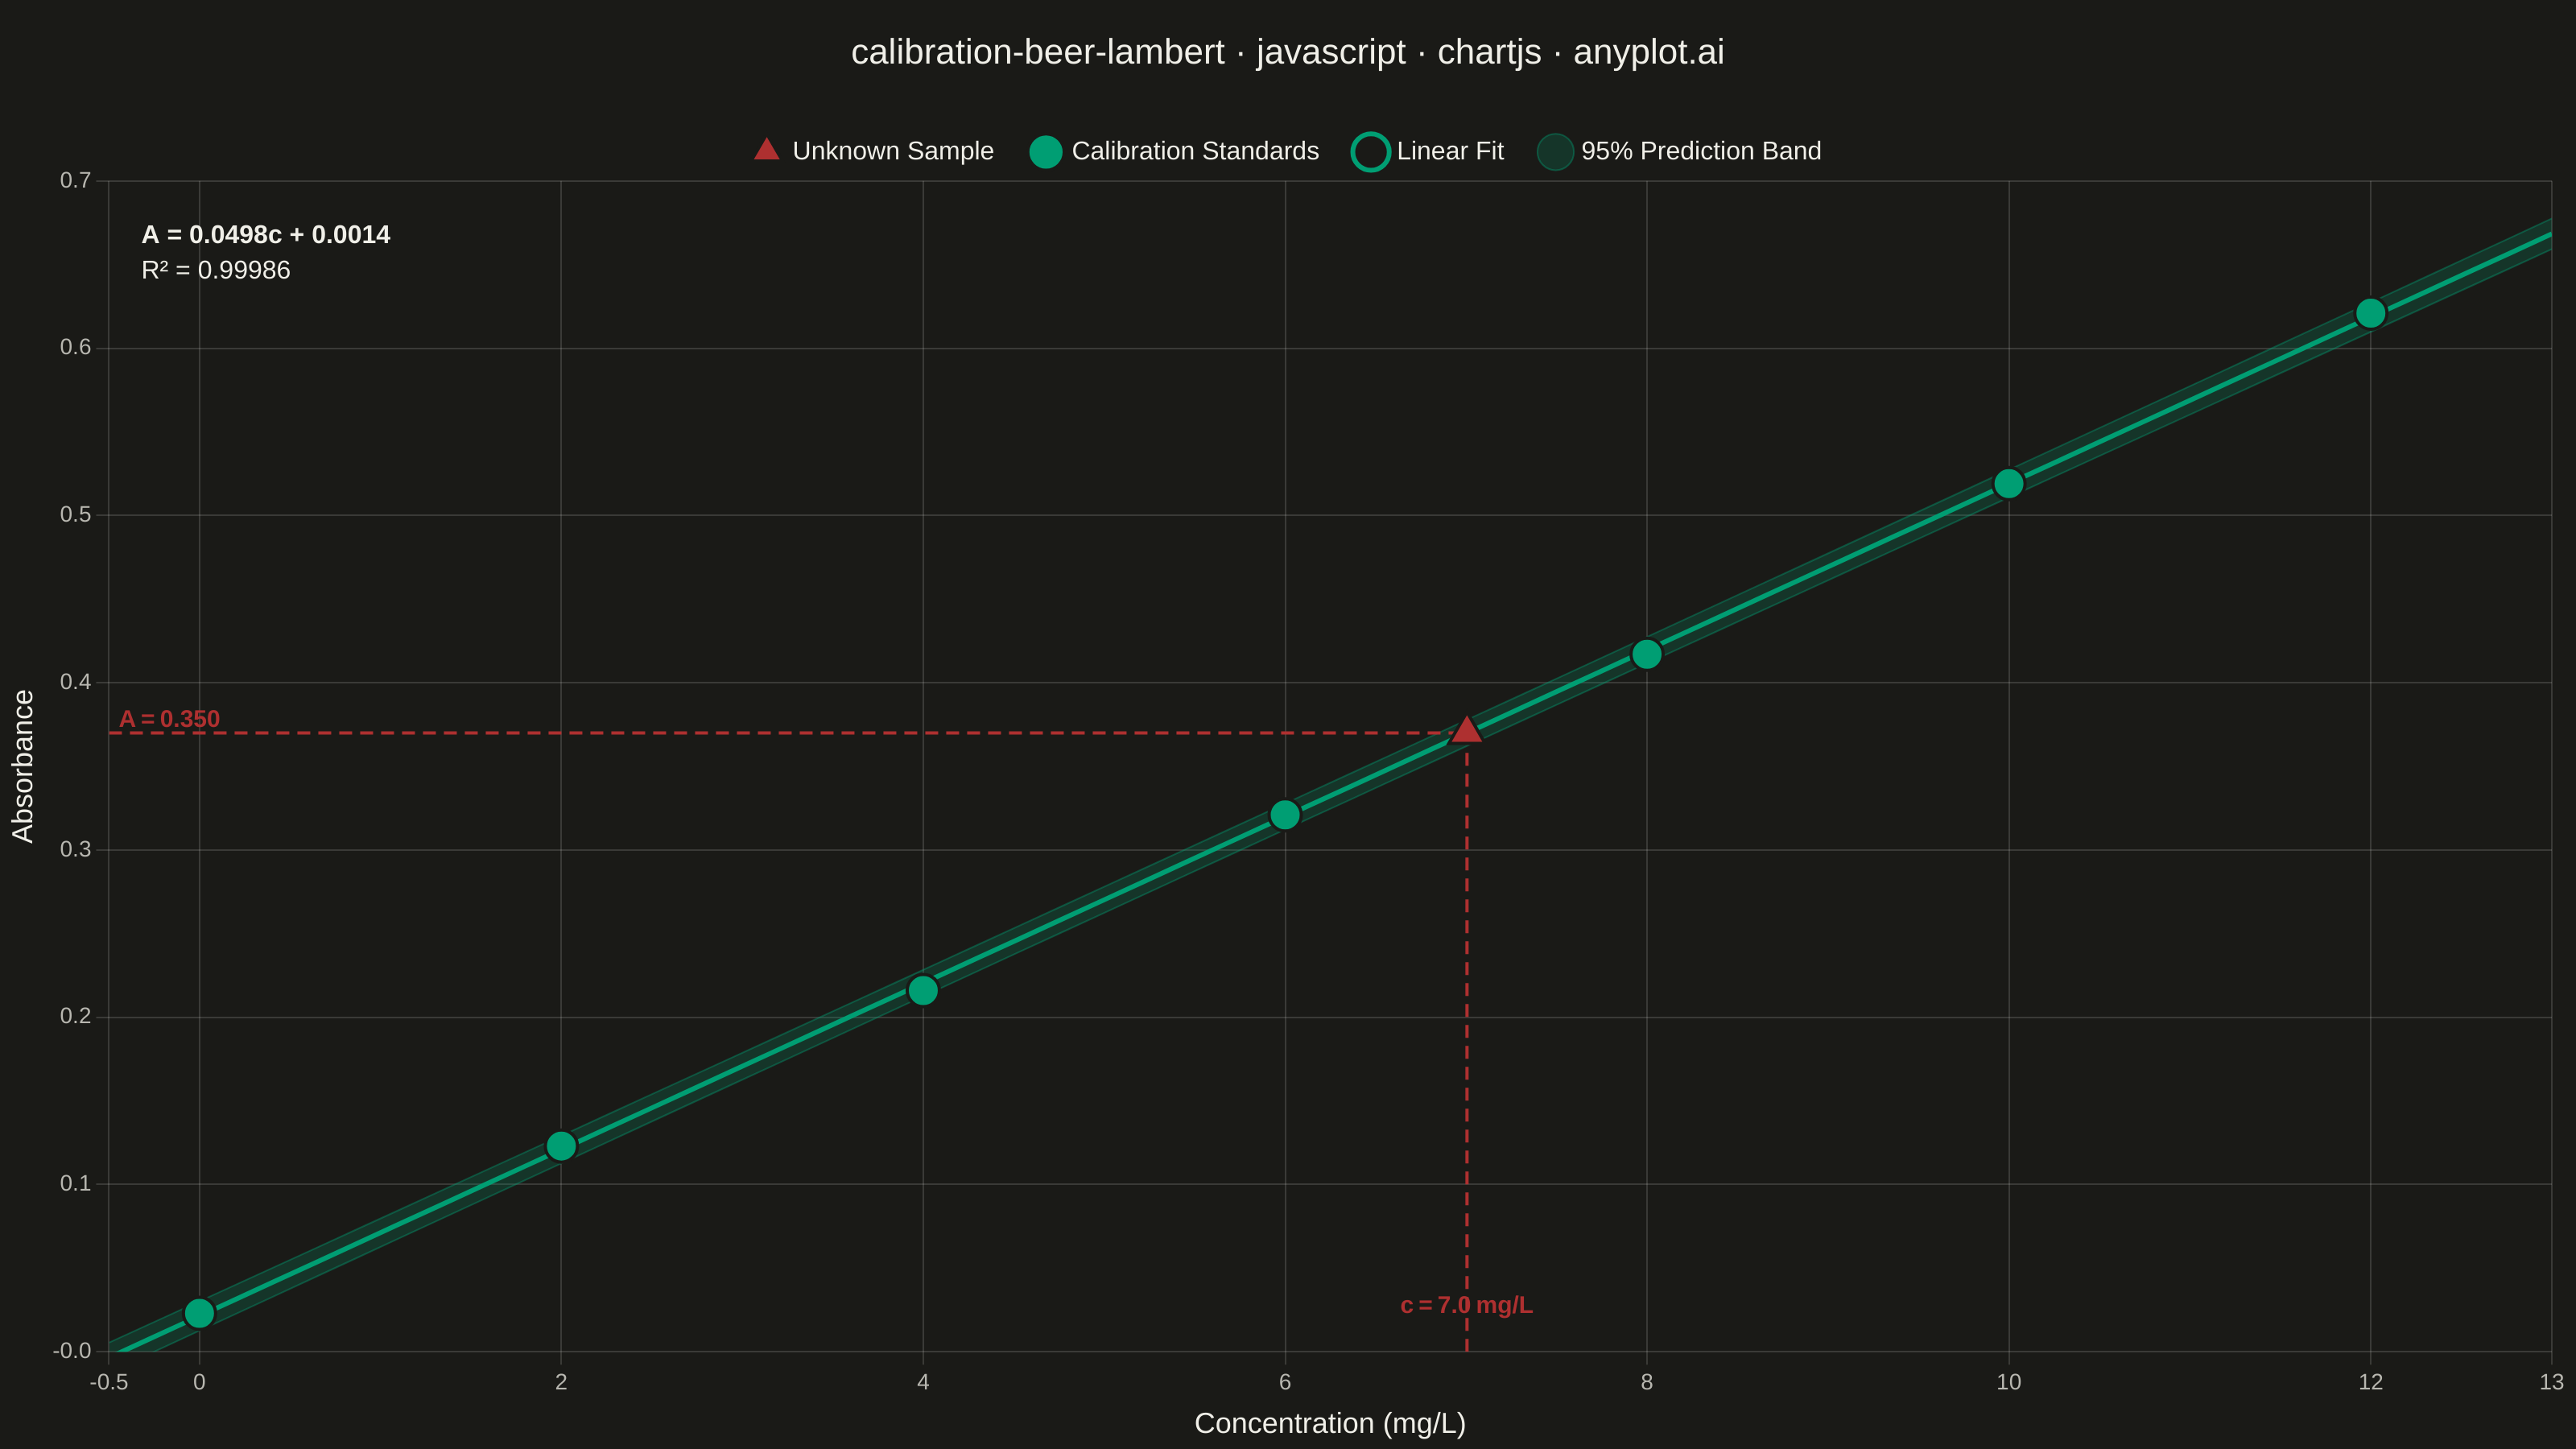
A calibration curve plotting absorbance versus concentration following Beer-Lambert law (A = εlc). Measured calibration standards are shown as scatter points with a linear regression fit line. The regression equation (y = mx + b) and R² value are displayed on the plot. An example unknown sample is marked with dashed lines extending to both axes, demonstrating how the curve is used to determine concentration from a measured absorbance. This plot is fundamental in analytical chemistry for quantitative spectrophotometric analysis.
// anyplot.ai
// calibration-beer-lambert: Beer-Lambert Calibration Curve
// Library: chartjs 4.4.7 | JavaScript 22.22.3
// Quality: 91/100 | Created: 2026-06-03

const t = window.ANYPLOT_TOKENS;

// --- Data -------------------------------------------------------------------
const concentrations = [0, 2, 4, 6, 8, 10, 12];
const absorbances    = [0.003, 0.103, 0.196, 0.301, 0.397, 0.499, 0.601];

const n     = concentrations.length;
const sumX  = concentrations.reduce((a, b) => a + b, 0);
const sumY  = absorbances.reduce((a, b) => a + b, 0);
const xMean = sumX / n;
const yMean = sumY / n;
const sumXY = concentrations.reduce((acc, x, i) => acc + x * absorbances[i], 0);
const sumX2 = concentrations.reduce((acc, x) => acc + x * x, 0);
const ssXX  = sumX2 - n * xMean * xMean;

const slope     = (sumXY - n * xMean * yMean) / ssXX;
const intercept = yMean - slope * xMean;
const ssRes     = absorbances.reduce((acc, y, i) => acc + (y - (slope * concentrations[i] + intercept)) ** 2, 0);
const ssTot     = absorbances.reduce((acc, y) => acc + (y - yMean) ** 2, 0);
const r2        = 1 - ssRes / ssTot;
const se        = Math.sqrt(ssRes / (n - 2));

// Dense grid for smooth regression + PI curves
const gridX    = Array.from({ length: 60 }, (_, i) => -0.5 + i * 13.5 / 59);
const gridY    = gridX.map(x => slope * x + intercept);
const tCrit    = 2.571;  // t_{0.025, df=5} for 95% prediction interval
const piMargin = gridX.map(x =>
  tCrit * se * Math.sqrt(1 + 1 / n + (x - xMean) ** 2 / ssXX)
);

// Unknown sample: measured absorbance → determined concentration
const unknownAbs  = 0.350;
const unknownConc = (unknownAbs - intercept) / slope;

// Annotation strings
const intSign = intercept >= 0 ? '+' : '−';
const eqLine  = `A = ${slope.toFixed(4)}c ${intSign} ${Math.abs(intercept).toFixed(4)}`;
const r2Line  = `R² = ${r2.toFixed(5)}`;

// --- Mount ------------------------------------------------------------------
const canvas = document.createElement("canvas");
document.getElementById("container").appendChild(canvas);

// --- Plugins ----------------------------------------------------------------
const bgPlugin = {
  id: 'bg',
  beforeDraw(chart) {
    const { ctx, width, height } = chart;
    ctx.save();
    ctx.fillStyle = t.pageBg;
    ctx.fillRect(0, 0, width, height);
    ctx.restore();
  }
};

const annotPlugin = {
  id: 'annot',
  afterDraw(chart) {
    const { ctx, chartArea: { left, top, bottom }, scales } = chart;
    ctx.save();

    // Regression equation (top-left of plot area)
    ctx.fillStyle = t.ink;
    ctx.textAlign = 'left';
    ctx.font = `bold 16px -apple-system, BlinkMacSystemFont, "Segoe UI", sans-serif`;
    ctx.fillText(eqLine, left + 20, top + 34);
    ctx.font = `16px -apple-system, BlinkMacSystemFont, "Segoe UI", sans-serif`;
    ctx.fillText(r2Line, left + 20, top + 56);

    // Axis readouts for the unknown sample
    const xPx = scales.x.getPixelForValue(unknownConc);
    const yPx = scales.y.getPixelForValue(unknownAbs);
    ctx.fillStyle = t.palette[4];
    ctx.font = `bold 15px -apple-system, BlinkMacSystemFont, "Segoe UI", sans-serif`;
    ctx.textAlign = 'left';
    ctx.fillText(`A = ${unknownAbs.toFixed(3)}`, left + 6, yPx - 8);
    ctx.textAlign = 'center';
    ctx.fillText(`c = ${unknownConc.toFixed(1)} mg/L`, xPx, bottom - 28);

    ctx.restore();
  }
};

// --- Chart ------------------------------------------------------------------
new Chart(canvas, {
  type: "line",
  data: {
    datasets: [
      {
        label: "95% Prediction Band",
        data: gridX.map((x, i) => ({ x, y: gridY[i] + piMargin[i] })),
        borderColor: t.palette[0] + "66",
        backgroundColor: t.palette[0] + "33",
        fill: "+1",
        pointRadius: 0,
        tension: 0,
        borderWidth: 1,
        showLine: true,
        order: 6,
      },
      {
        label: "_pi_lower",
        data: gridX.map((x, i) => ({ x, y: gridY[i] - piMargin[i] })),
        borderColor: t.palette[0] + "66",
        backgroundColor: "transparent",
        fill: false,
        pointRadius: 0,
        tension: 0,
        borderWidth: 1,
        showLine: true,
        order: 6,
      },
      {
        label: "Linear Fit",
        data: gridX.map((x, i) => ({ x, y: gridY[i] })),
        borderColor: t.palette[0],
        backgroundColor: "transparent",
        fill: false,
        pointRadius: 0,
        tension: 0,
        borderWidth: 3,
        showLine: true,
        order: 4,
      },
      {
        label: "Calibration Standards",
        data: concentrations.map((x, i) => ({ x, y: absorbances[i] })),
        backgroundColor: t.palette[0],
        borderColor: t.pageBg,
        borderWidth: 2,
        pointRadius: 10,
        showLine: false,
        order: 2,
      },
      {
        label: "Unknown Sample",
        data: [{ x: unknownConc, y: unknownAbs }],
        backgroundColor: t.palette[4],
        borderColor: t.pageBg,
        borderWidth: 2,
        pointRadius: 13,
        pointStyle: "triangle",
        showLine: false,
        order: 1,
      },
      {
        label: "_h_dash",
        data: [{ x: -0.5, y: unknownAbs }, { x: unknownConc, y: unknownAbs }],
        borderColor: t.palette[4],
        borderDash: [8, 5],
        borderWidth: 2,
        pointRadius: 0,
        fill: false,
        showLine: true,
        order: 3,
      },
      {
        label: "_v_dash",
        data: [{ x: unknownConc, y: -0.02 }, { x: unknownConc, y: unknownAbs }],
        borderColor: t.palette[4],
        borderDash: [8, 5],
        borderWidth: 2,
        pointRadius: 0,
        fill: false,
        showLine: true,
        order: 3,
      },
    ],
  },
  options: {
    responsive: true,
    maintainAspectRatio: false,
    animation: false,
    plugins: {
      title: {
        display: true,
        text: "calibration-beer-lambert · javascript · chartjs · anyplot.ai",
        color: t.ink,
        font: { size: 22, weight: "500" },
        padding: { top: 20, bottom: 16 },
      },
      legend: {
        position: "top",
        labels: {
          color: t.ink,
          font: { size: 16 },
          filter: item => !item.text.startsWith("_"),
          usePointStyle: true,
          padding: 24,
        },
      },
    },
    scales: {
      x: {
        type: "linear",
        min: -0.5,
        max: 13,
        title: {
          display: true,
          text: "Concentration (mg/L)",
          color: t.ink,
          font: { size: 18 },
        },
        ticks: {
          color: t.inkSoft,
          font: { size: 14 },
          stepSize: 2,
        },
        grid: { color: t.grid },
        border: { display: false },
      },
      y: {
        min: -0.02,
        max: 0.68,
        title: {
          display: true,
          text: "Absorbance",
          color: t.ink,
          font: { size: 18 },
        },
        ticks: {
          color: t.inkSoft,
          font: { size: 14 },
          stepSize: 0.1,
        },
        grid: { color: t.grid },
        border: { display: false },
      },
    },
  },
  plugins: [bgPlugin, annotPlugin],
});
Runnable source as JSON, for any HTTP client: https://api.anyplot.ai/specs/calibration-beer-lambert/chartjs/code. Any spec id and library id listed in llms-full.txt fit the same URL shape; every URL below is complete and callable.
{
  "spec_id": "calibration-beer-lambert",
  "language": "javascript",
  "library": "chartjs",
  "page": "https://anyplot.ai/calibration-beer-lambert/javascript/chartjs",
  "hub": "https://anyplot.ai/calibration-beer-lambert",
  "code_json": "https://api.anyplot.ai/specs/calibration-beer-lambert/chartjs/code",
  "spec_json": "https://api.anyplot.ai/specs/calibration-beer-lambert",
  "render_light_png": "https://storage.googleapis.com/anyplot-images/plots/calibration-beer-lambert/javascript/chartjs/plot-light.png",
  "render_dark_png": "https://storage.googleapis.com/anyplot-images/plots/calibration-beer-lambert/javascript/chartjs/plot-dark.png",
  "interactive_light_html": "https://storage.googleapis.com/anyplot-images/plots/calibration-beer-lambert/javascript/chartjs/plot-light.html",
  "interactive_dark_html": "https://storage.googleapis.com/anyplot-images/plots/calibration-beer-lambert/javascript/chartjs/plot-dark.html",
  "quality_score": 91.0,
  "license": "MIT",
  "guide": "https://anyplot.ai/llms.txt"
}
Part of Beer-Lambert Calibration Curve on anyplot.ai.