The same plot in 14 other libraries — Python: Altair, Bokeh, lets-plot, Matplotlib, Plotly, plotnine, Pygal, Seaborn; Julia: Makie.jl; JavaScript: Chart.js, D3.js, Apache ECharts, Highcharts, MUI X Charts. Compare all 15 side by side: Beer-Lambert Calibration Curve in Python, R, Julia and JavaScript.
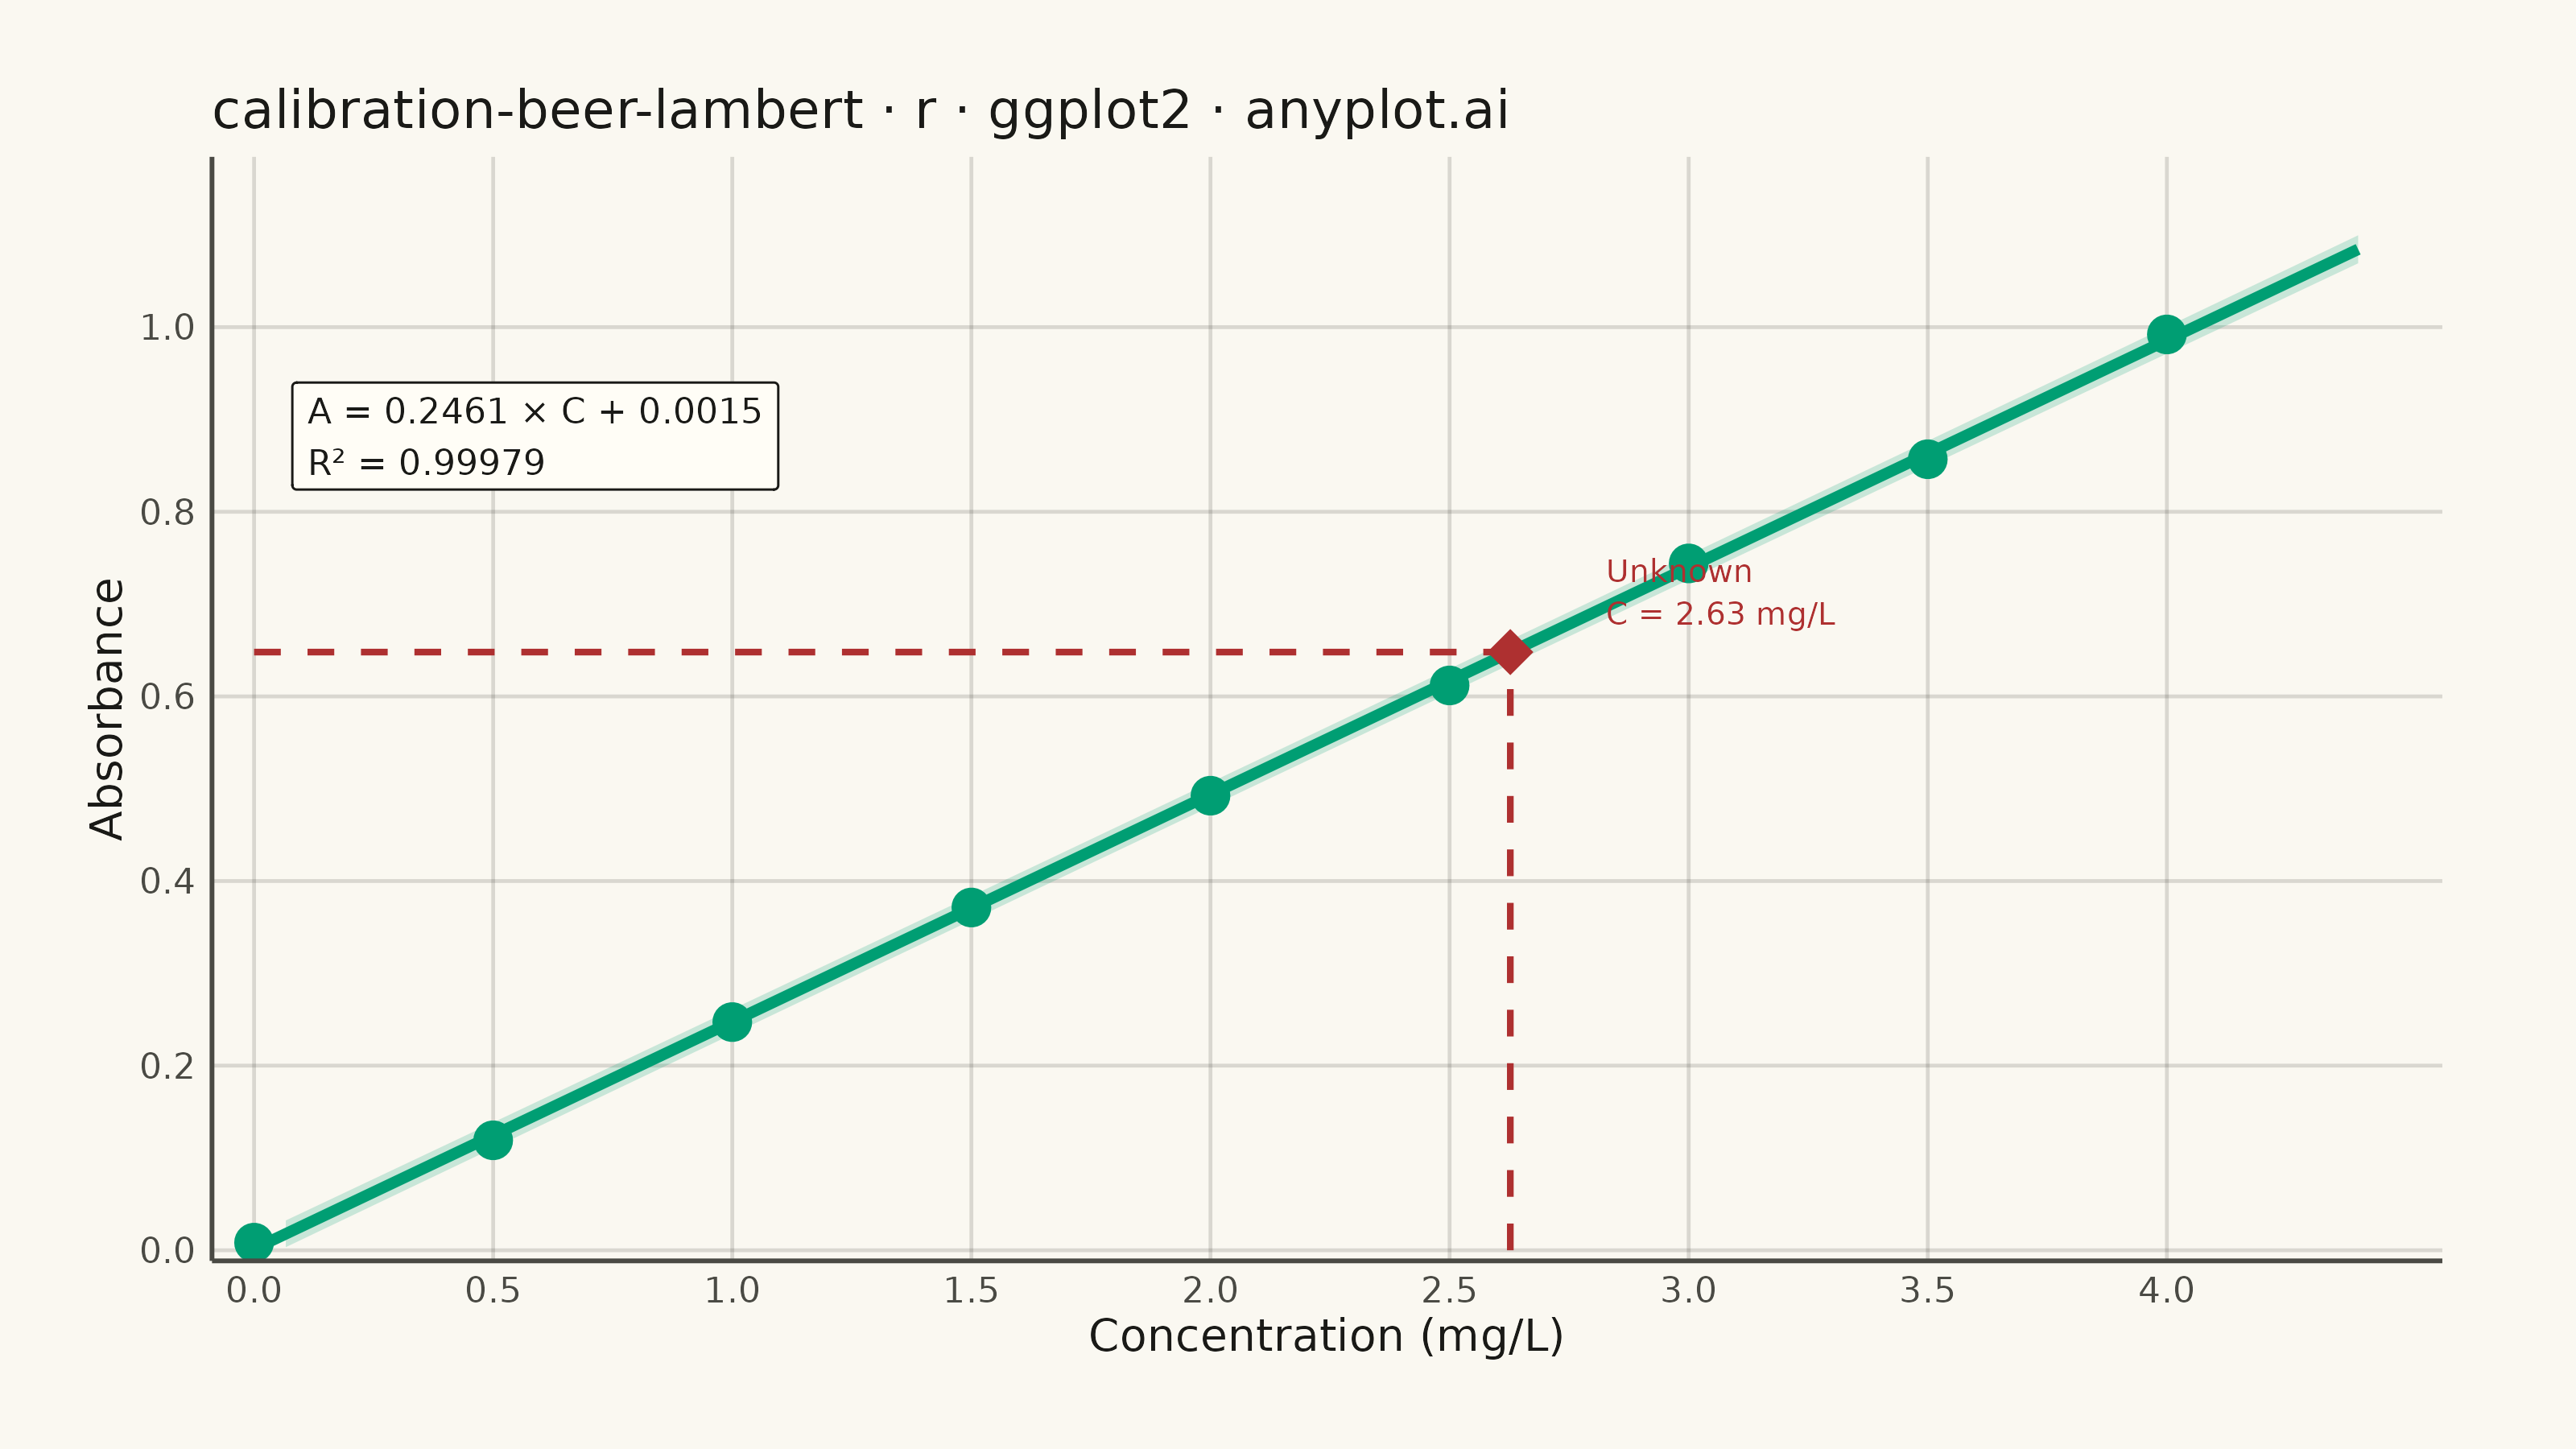
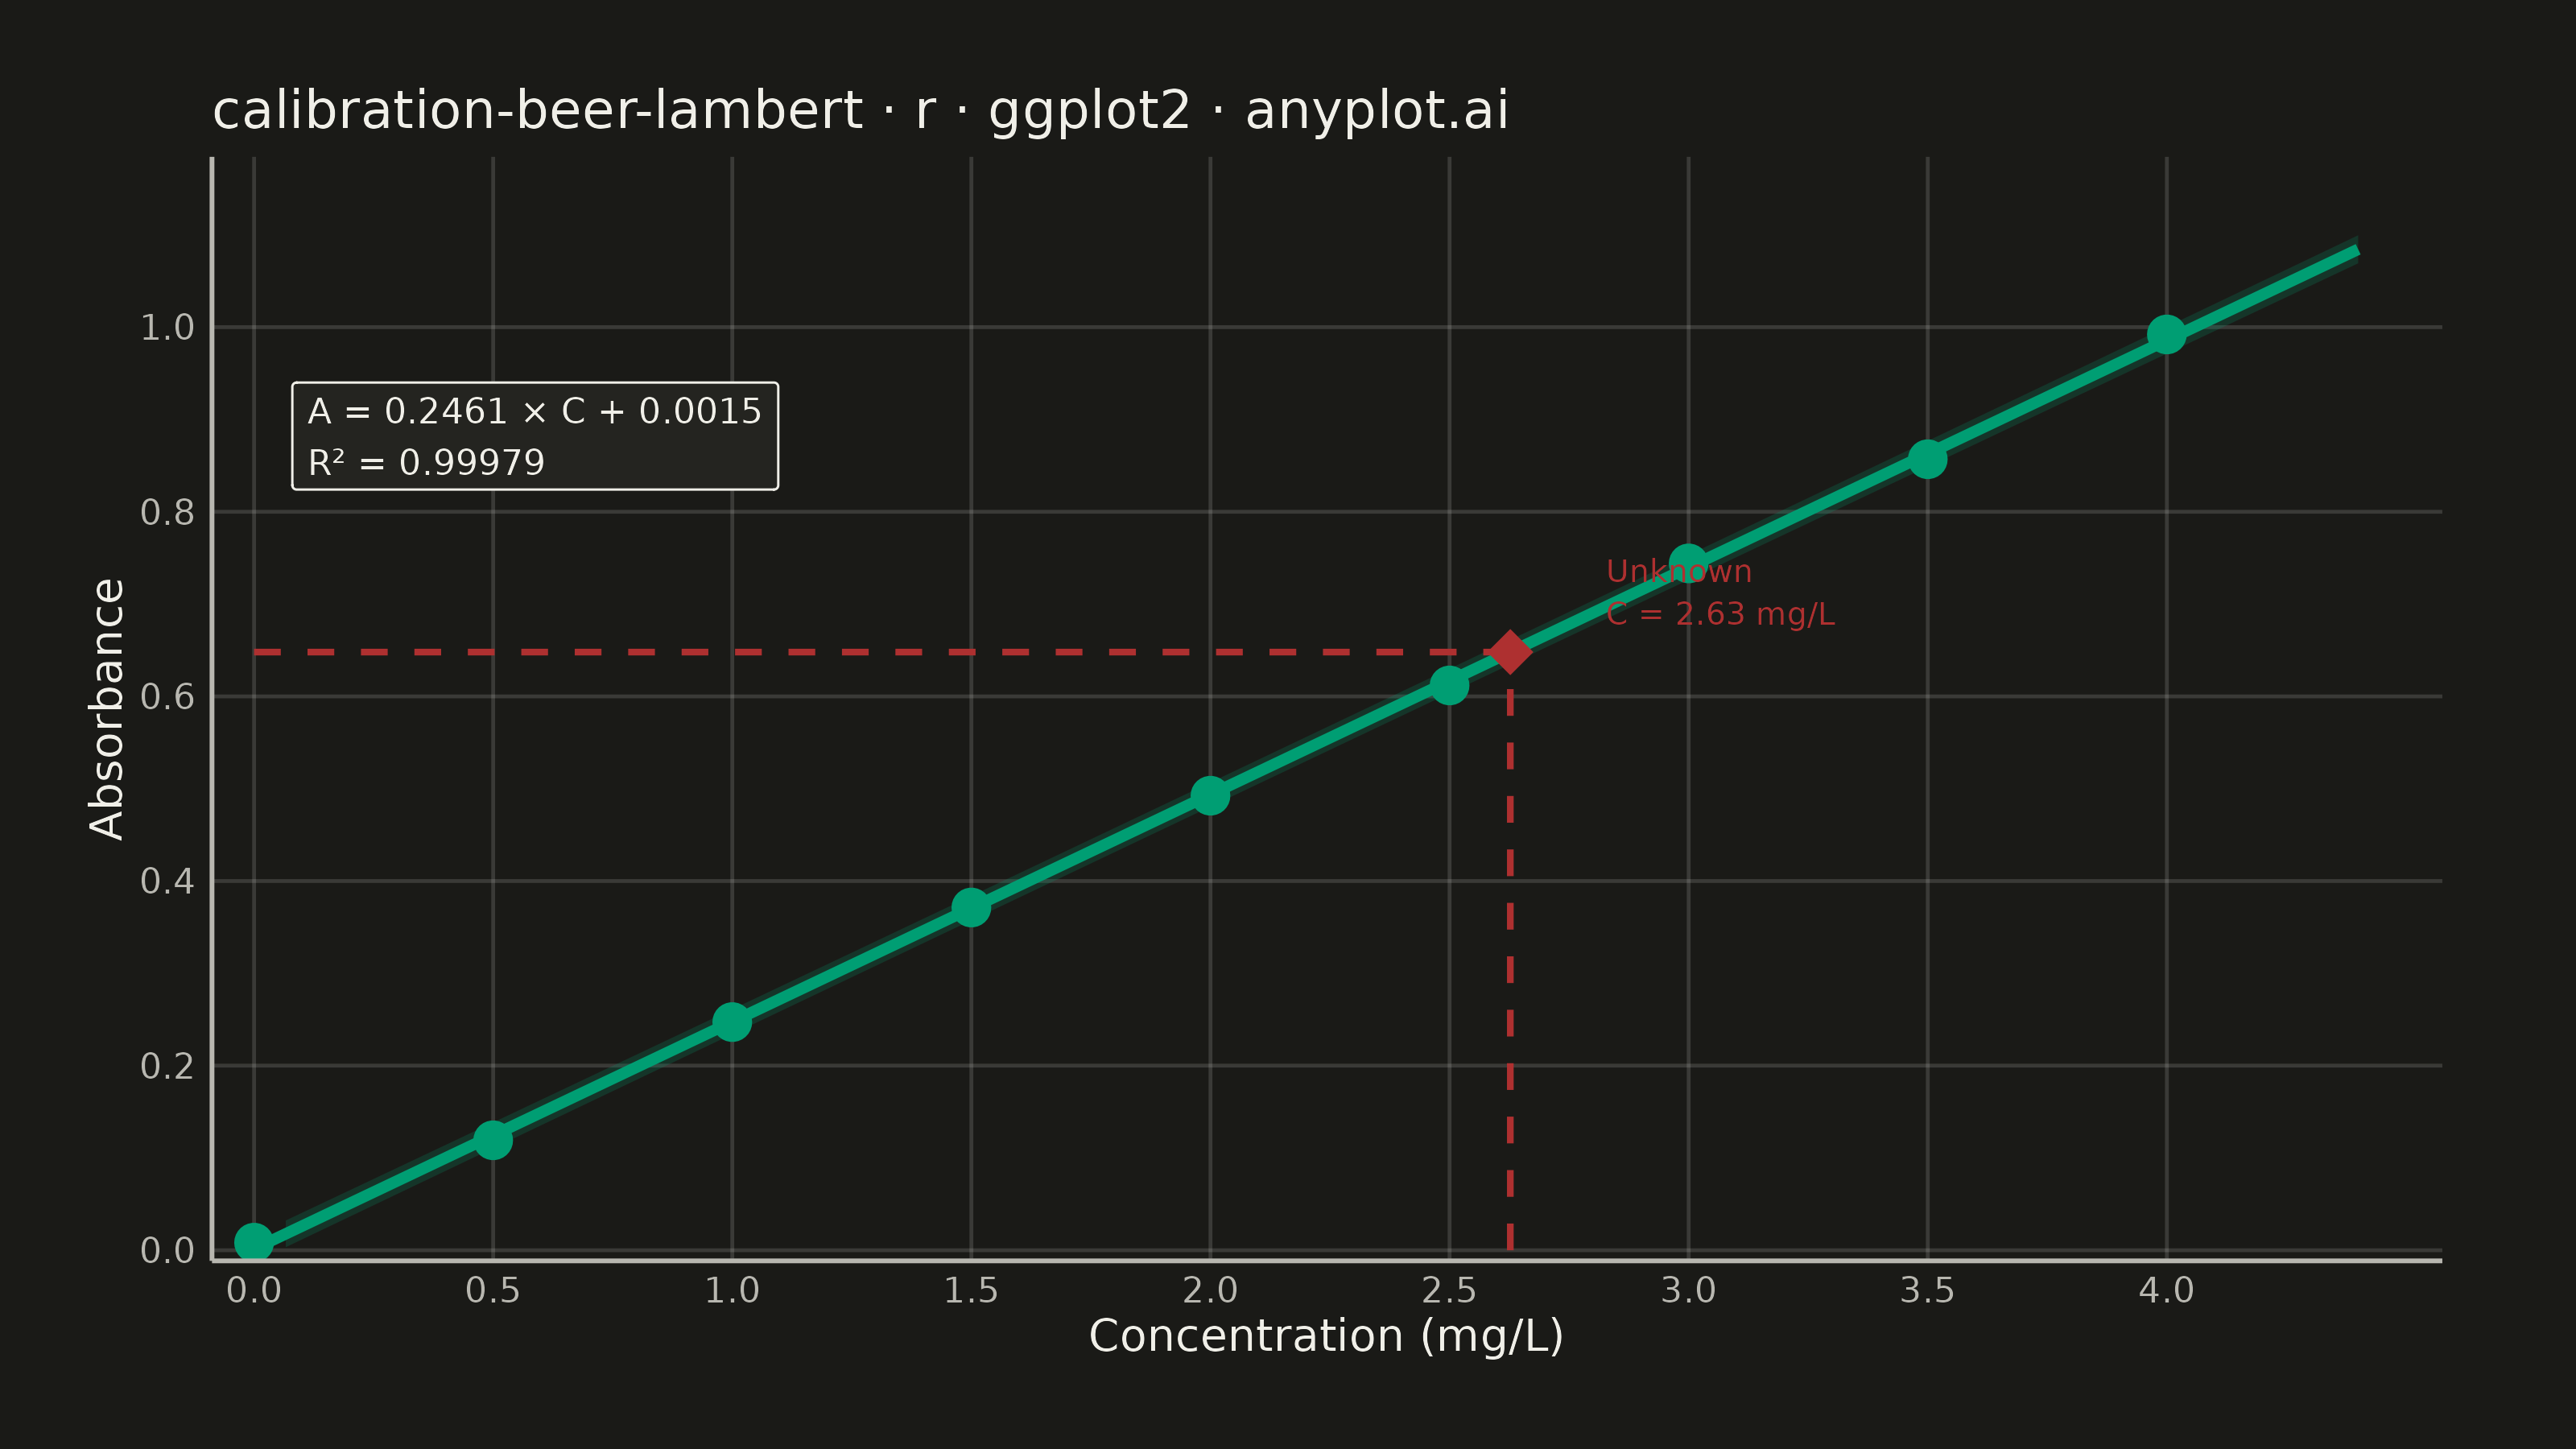
A calibration curve plotting absorbance versus concentration following Beer-Lambert law (A = εlc). Measured calibration standards are shown as scatter points with a linear regression fit line. The regression equation (y = mx + b) and R² value are displayed on the plot. An example unknown sample is marked with dashed lines extending to both axes, demonstrating how the curve is used to determine concentration from a measured absorbance. This plot is fundamental in analytical chemistry for quantitative spectrophotometric analysis.
#' anyplot.ai
#' calibration-beer-lambert: Beer-Lambert Calibration Curve
#' Library: ggplot2 3.5.1 | R 4.4.1
#' Quality: 87/100 | Created: 2026-06-03

library(ggplot2)
library(ragg)

set.seed(42)

# Theme tokens (Imprint palette — theme-adaptive chrome)
THEME       <- Sys.getenv("ANYPLOT_THEME", "light")
PAGE_BG     <- if (THEME == "light") "#FAF8F1" else "#1A1A17"
ELEVATED_BG <- if (THEME == "light") "#FFFDF6" else "#242420"
INK         <- if (THEME == "light") "#1A1A17" else "#F0EFE8"
INK_SOFT    <- if (THEME == "light") "#4A4A44" else "#B8B7B0"
GRID_COLOR  <- adjustcolor(INK, alpha.f = 0.15)

# Imprint categorical palette (hybrid-v3 sort)
IMPRINT_PALETTE <- c(
  "#009E73",  # 1 — brand green (first series, calibration standards)
  "#C475FD",  # 2 — lavender
  "#4467A3",  # 3 — blue
  "#BD8233",  # 4 — ochre
  "#AE3030",  # 5 — matte red (semantic: unknown sample highlight)
  "#2ABCCD",  # 6 — cyan
  "#954477",  # 7 — rose
  "#99B314"   # 8 — lime
)

# Data: iron (II) calibration by ferrozine colorimetric method (562 nm)
# Beer-Lambert law: A = epsilon * l * C,  epsilon*l = 0.245 L/(mg·cm)
conc_standards <- c(0.0, 0.5, 1.0, 1.5, 2.0, 2.5, 3.0, 3.5, 4.0)
eps_l          <- 0.245
abs_noise      <- rnorm(length(conc_standards), mean = 0, sd = 0.006)
abs_standards  <- pmax(eps_l * conc_standards + abs_noise, 0)

df <- data.frame(
  concentration = conc_standards,
  absorbance    = abs_standards
)

# Linear regression
lm_fit    <- lm(absorbance ~ concentration, data = df)
slope     <- coef(lm_fit)[["concentration"]]
intercept <- coef(lm_fit)[["(Intercept)"]]
r_sq      <- summary(lm_fit)$r.squared

# Prediction interval across the fit range
x_pred  <- data.frame(concentration = seq(0, 4.4, length.out = 200))
pred_ci <- predict(lm_fit, newdata = x_pred, interval = "prediction", level = 0.95)
pred_df <- data.frame(
  concentration = x_pred$concentration,
  fit           = pred_ci[, "fit"],
  lwr           = pred_ci[, "lwr"],
  upr           = pred_ci[, "upr"]
)

# Unknown sample: measured absorbance → derived concentration
unknown_abs  <- 0.648
unknown_conc <- (unknown_abs - intercept) / slope
unknown_df   <- data.frame(concentration = unknown_conc, absorbance = unknown_abs)

# Regression equation annotation text
eq_text <- sprintf(
  "A = %.4f × C + %.4f\nR² = %.5f",
  slope, intercept, r_sq
)

# Title — font size scaled linearly if longer than the 67-char baseline
plot_title <- "calibration-beer-lambert · r · ggplot2 · anyplot.ai"
title_n    <- nchar(plot_title)
title_size <- if (title_n > 67) round(12 * 67 / title_n) else 12

# Plot
p <- ggplot(df, aes(x = concentration, y = absorbance)) +
  # 95% prediction interval band
  geom_ribbon(
    data        = pred_df,
    aes(x = concentration, ymin = lwr, ymax = upr),
    inherit.aes = FALSE,
    fill        = IMPRINT_PALETTE[1],
    alpha       = 0.20
  ) +
  # Regression fit line
  geom_line(
    data        = pred_df,
    aes(x = concentration, y = fit),
    inherit.aes = FALSE,
    color       = IMPRINT_PALETTE[1],
    linewidth   = 1.2
  ) +
  # Unknown sample dashed guide: horizontal (absorbance → y-axis)
  annotate(
    "segment",
    x = 0, xend = unknown_conc,
    y = unknown_abs, yend = unknown_abs,
    linetype  = "dashed",
    color     = IMPRINT_PALETTE[5],
    linewidth = 0.7
  ) +
  # Unknown sample dashed guide: vertical (concentration → x-axis)
  annotate(
    "segment",
    x = unknown_conc, xend = unknown_conc,
    y = 0, yend = unknown_abs,
    linetype  = "dashed",
    color     = IMPRINT_PALETTE[5],
    linewidth = 0.7
  ) +
  # Calibration standard points
  geom_point(
    color = IMPRINT_PALETTE[1],
    size  = 3.5,
    shape = 19
  ) +
  # Unknown sample point (diamond)
  geom_point(
    data  = unknown_df,
    color = IMPRINT_PALETTE[5],
    size  = 4.5,
    shape = 18
  ) +
  # Regression equation + R² annotation box
  annotate(
    "label",
    x             = 0.08,
    y             = 0.94,
    label         = eq_text,
    hjust         = 0,
    vjust         = 1,
    color         = INK,
    fill          = ELEVATED_BG,
    size          = 2.8,
    label.size    = 0.25,
    label.padding = unit(0.35, "lines"),
    label.r       = unit(0.1, "lines")
  ) +
  # Unknown sample label
  annotate(
    "text",
    x          = unknown_conc + 0.20,
    y          = unknown_abs + 0.03,
    label      = sprintf("Unknown\nC = %.2f mg/L", unknown_conc),
    hjust      = 0,
    vjust      = 0,
    color      = IMPRINT_PALETTE[5],
    size       = 2.5,
    lineheight = 1.1
  ) +
  labs(
    title = plot_title,
    x     = "Concentration (mg/L)",
    y     = "Absorbance"
  ) +
  scale_x_continuous(
    breaks = seq(0, 4, by = 0.5),
    expand = expansion(mult = c(0.02, 0.04))
  ) +
  scale_y_continuous(
    limits = c(0, 1.15),
    breaks = seq(0, 1.0, by = 0.2),
    expand = expansion(mult = c(0.01, 0.03))
  ) +
  theme_minimal(base_size = 8) +
  theme(
    plot.background  = element_rect(fill = PAGE_BG, color = PAGE_BG),
    panel.background = element_rect(fill = PAGE_BG, color = NA),
    panel.grid.major = element_line(color = GRID_COLOR, linewidth = 0.4),
    panel.grid.minor = element_blank(),
    panel.border     = element_blank(),
    axis.line        = element_line(color = INK_SOFT, linewidth = 0.5),
    axis.title       = element_text(color = INK,      size = 10),
    axis.text        = element_text(color = INK_SOFT, size = 8),
    plot.title       = element_text(color = INK,      size = title_size,
                                    hjust = 0, face = "plain"),
    plot.margin      = margin(20, 30, 20, 20, "pt")
  )

# Save
ggsave(
  filename = sprintf("plot-%s.png", THEME),
  plot     = p,
  device   = ragg::agg_png,
  width    = 8,
  height   = 4.5,
  units    = "in",
  dpi      = 400
)
Runnable source as JSON, for any HTTP client: https://api.anyplot.ai/specs/calibration-beer-lambert/ggplot2/code. Any spec id and library id listed in llms-full.txt fit the same URL shape; every URL below is complete and callable.
{
  "spec_id": "calibration-beer-lambert",
  "language": "r",
  "library": "ggplot2",
  "page": "https://anyplot.ai/calibration-beer-lambert/r/ggplot2",
  "hub": "https://anyplot.ai/calibration-beer-lambert",
  "code_json": "https://api.anyplot.ai/specs/calibration-beer-lambert/ggplot2/code",
  "spec_json": "https://api.anyplot.ai/specs/calibration-beer-lambert",
  "render_light_png": "https://storage.googleapis.com/anyplot-images/plots/calibration-beer-lambert/r/ggplot2/plot-light.png",
  "render_dark_png": "https://storage.googleapis.com/anyplot-images/plots/calibration-beer-lambert/r/ggplot2/plot-dark.png",
  "quality_score": 87.0,
  "license": "MIT",
  "guide": "https://anyplot.ai/llms.txt"
}
Part of Beer-Lambert Calibration Curve on anyplot.ai.