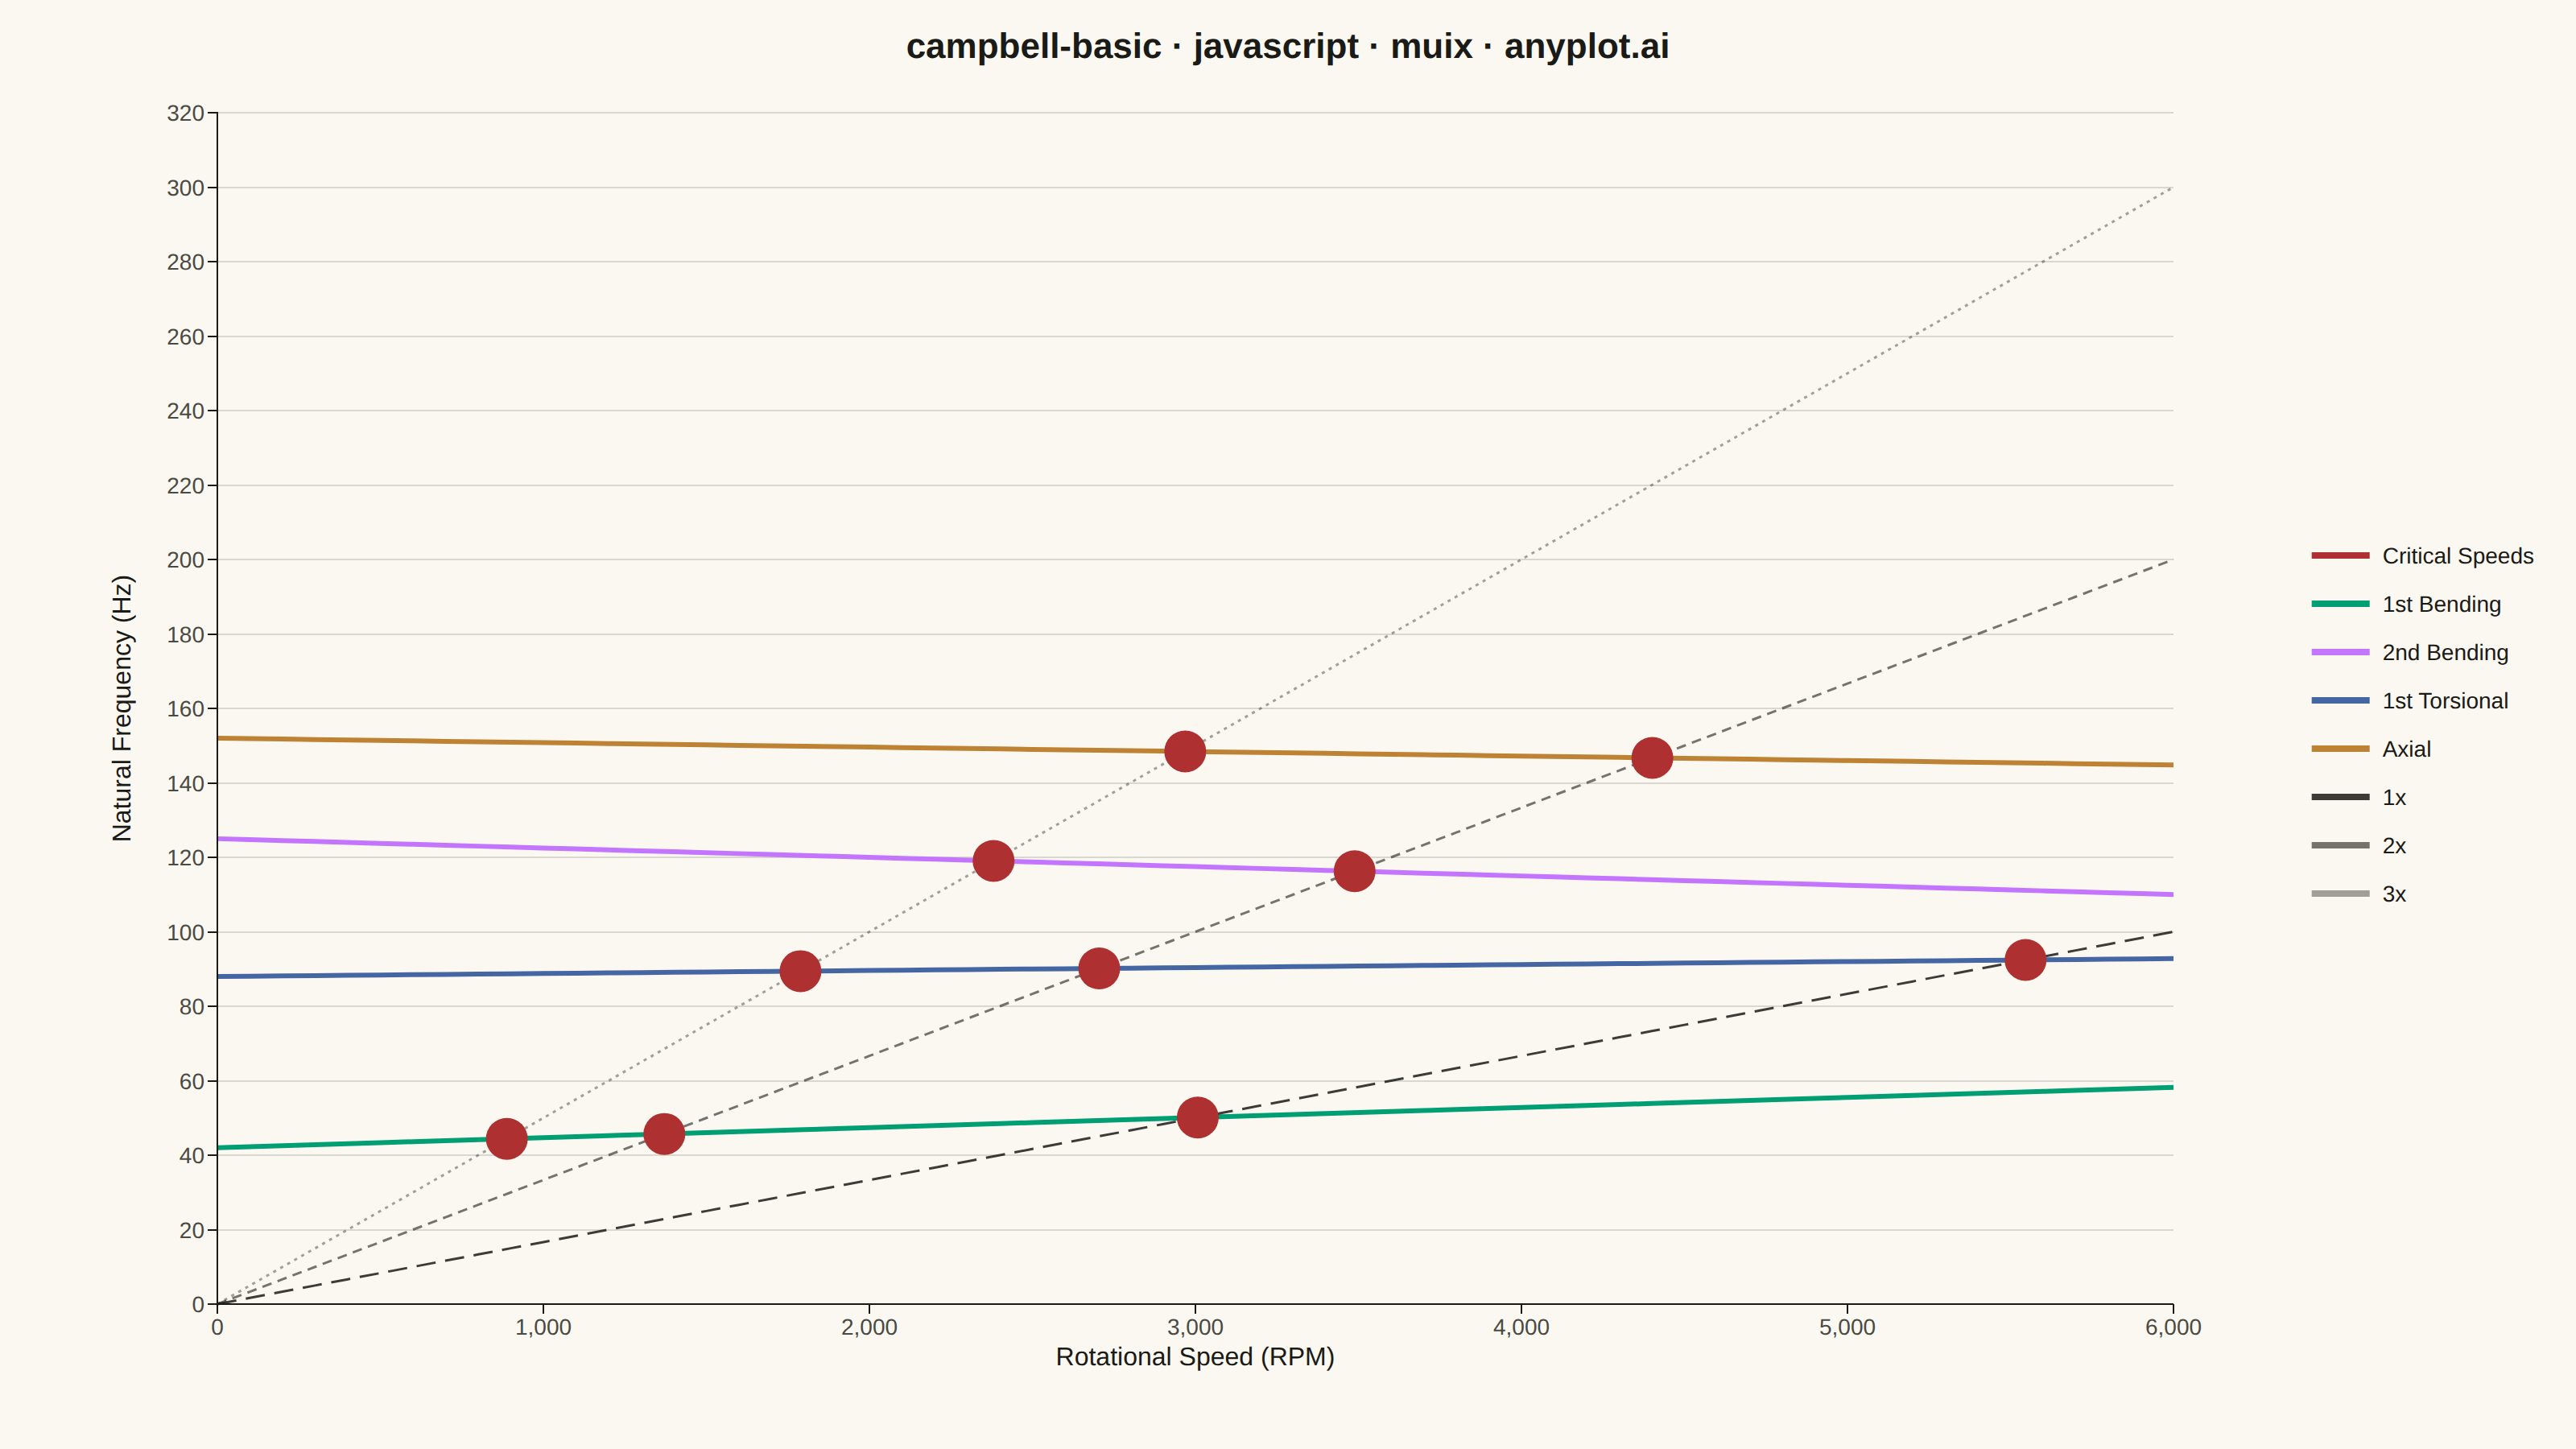
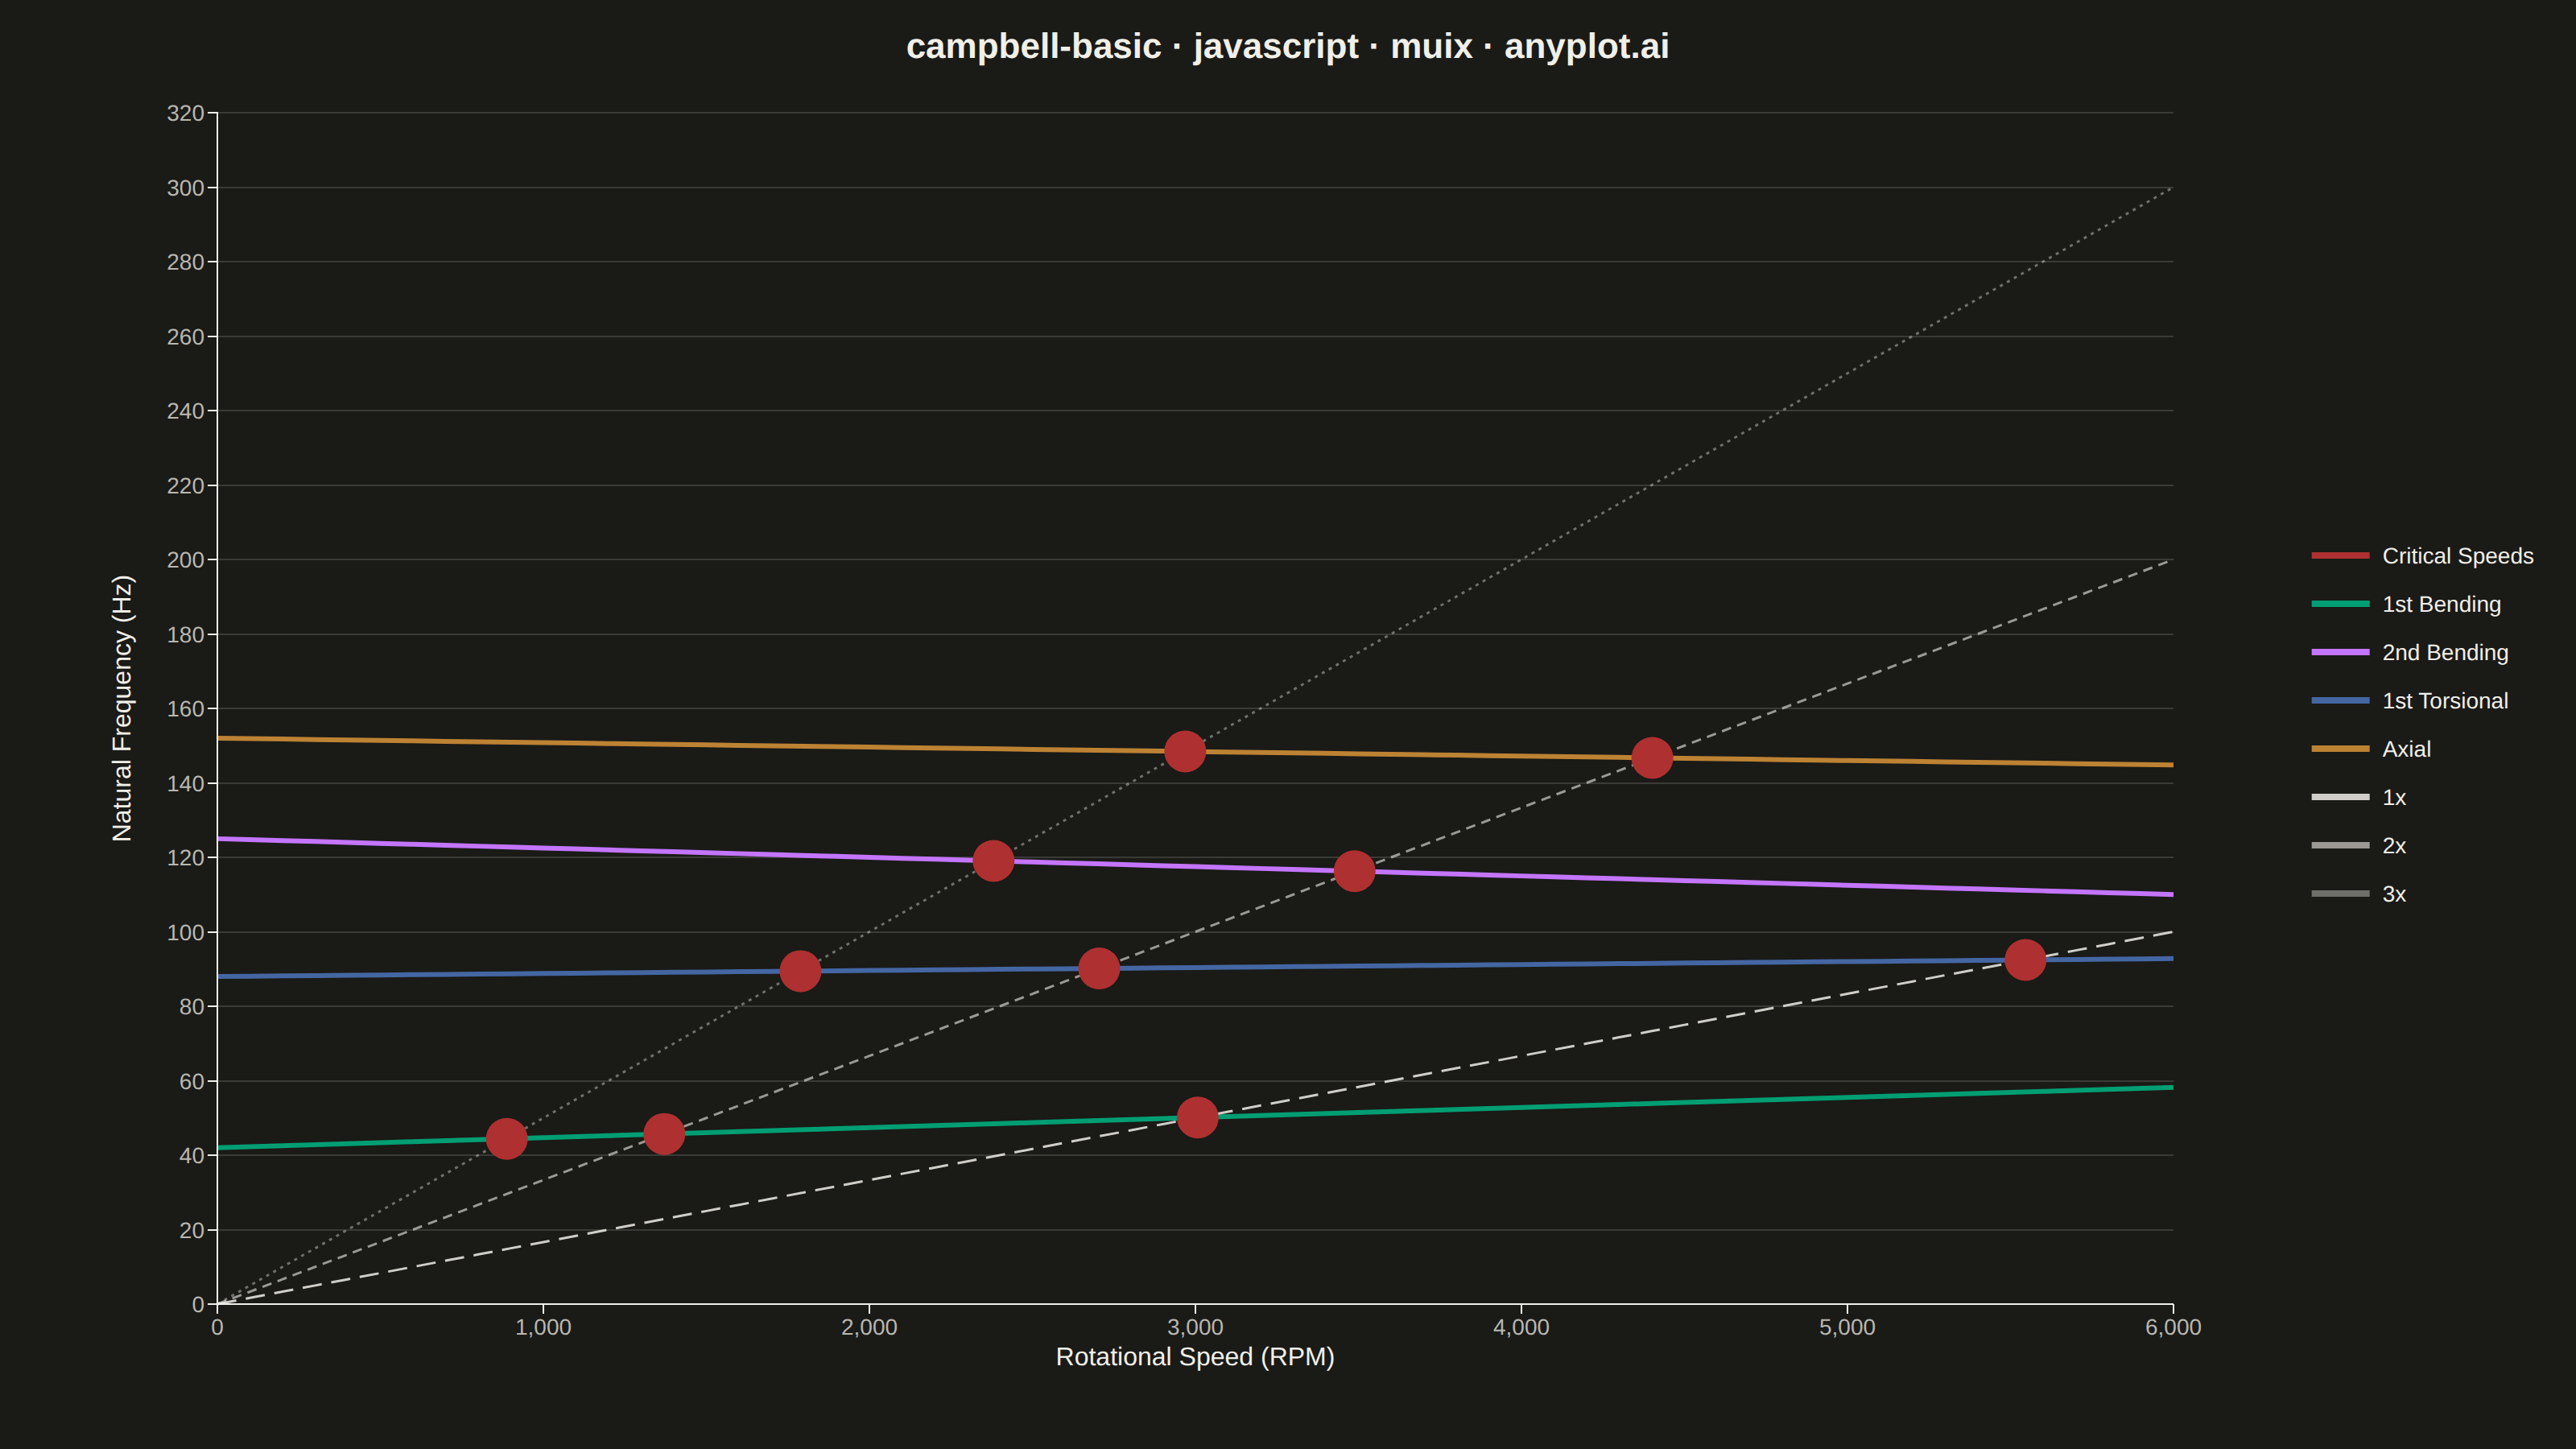
A Campbell Diagram (also called an interference diagram) plots natural frequencies against rotational speed to identify critical speeds and resonance conditions in rotating machinery. It overlays engine order excitation lines (diagonal lines from the origin) on top of natural frequency curves, with intersections marking critical speeds where resonance may occur. This visualization is essential for ensuring safe operating ranges in turbomachinery, automotive powertrains, and other rotating equipment.
Preview render from the MUI X Charts implementation.