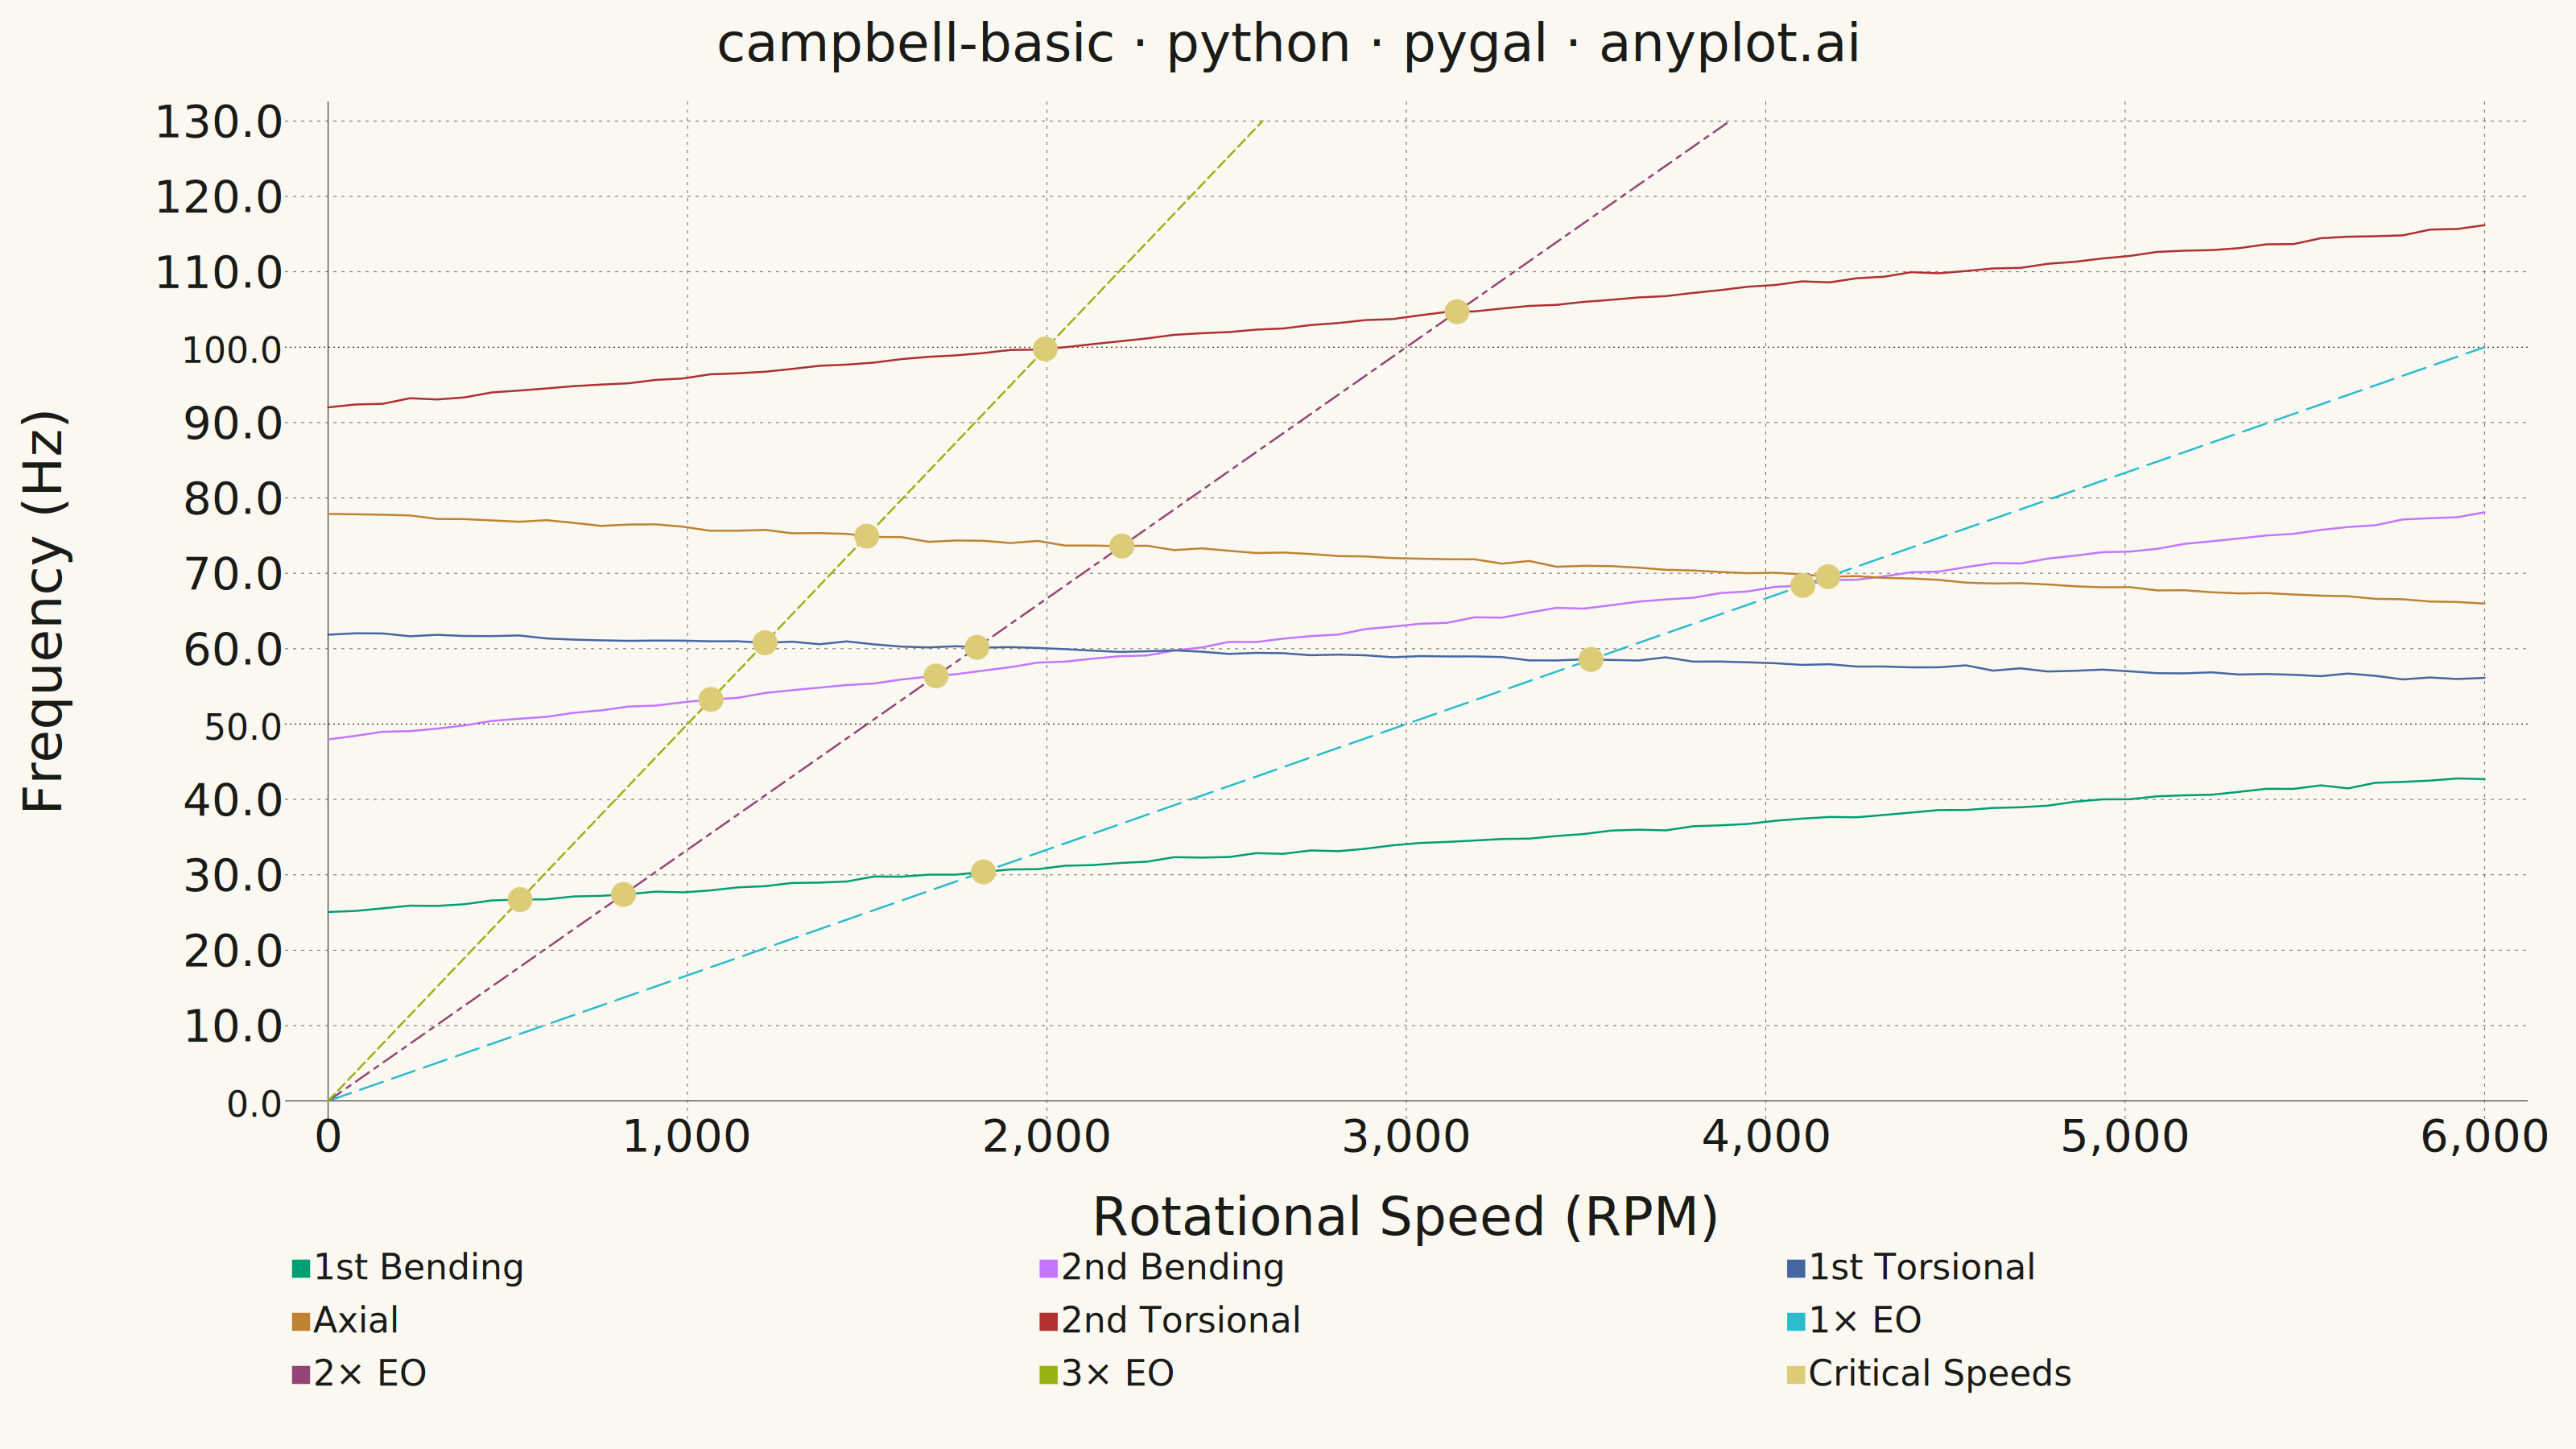
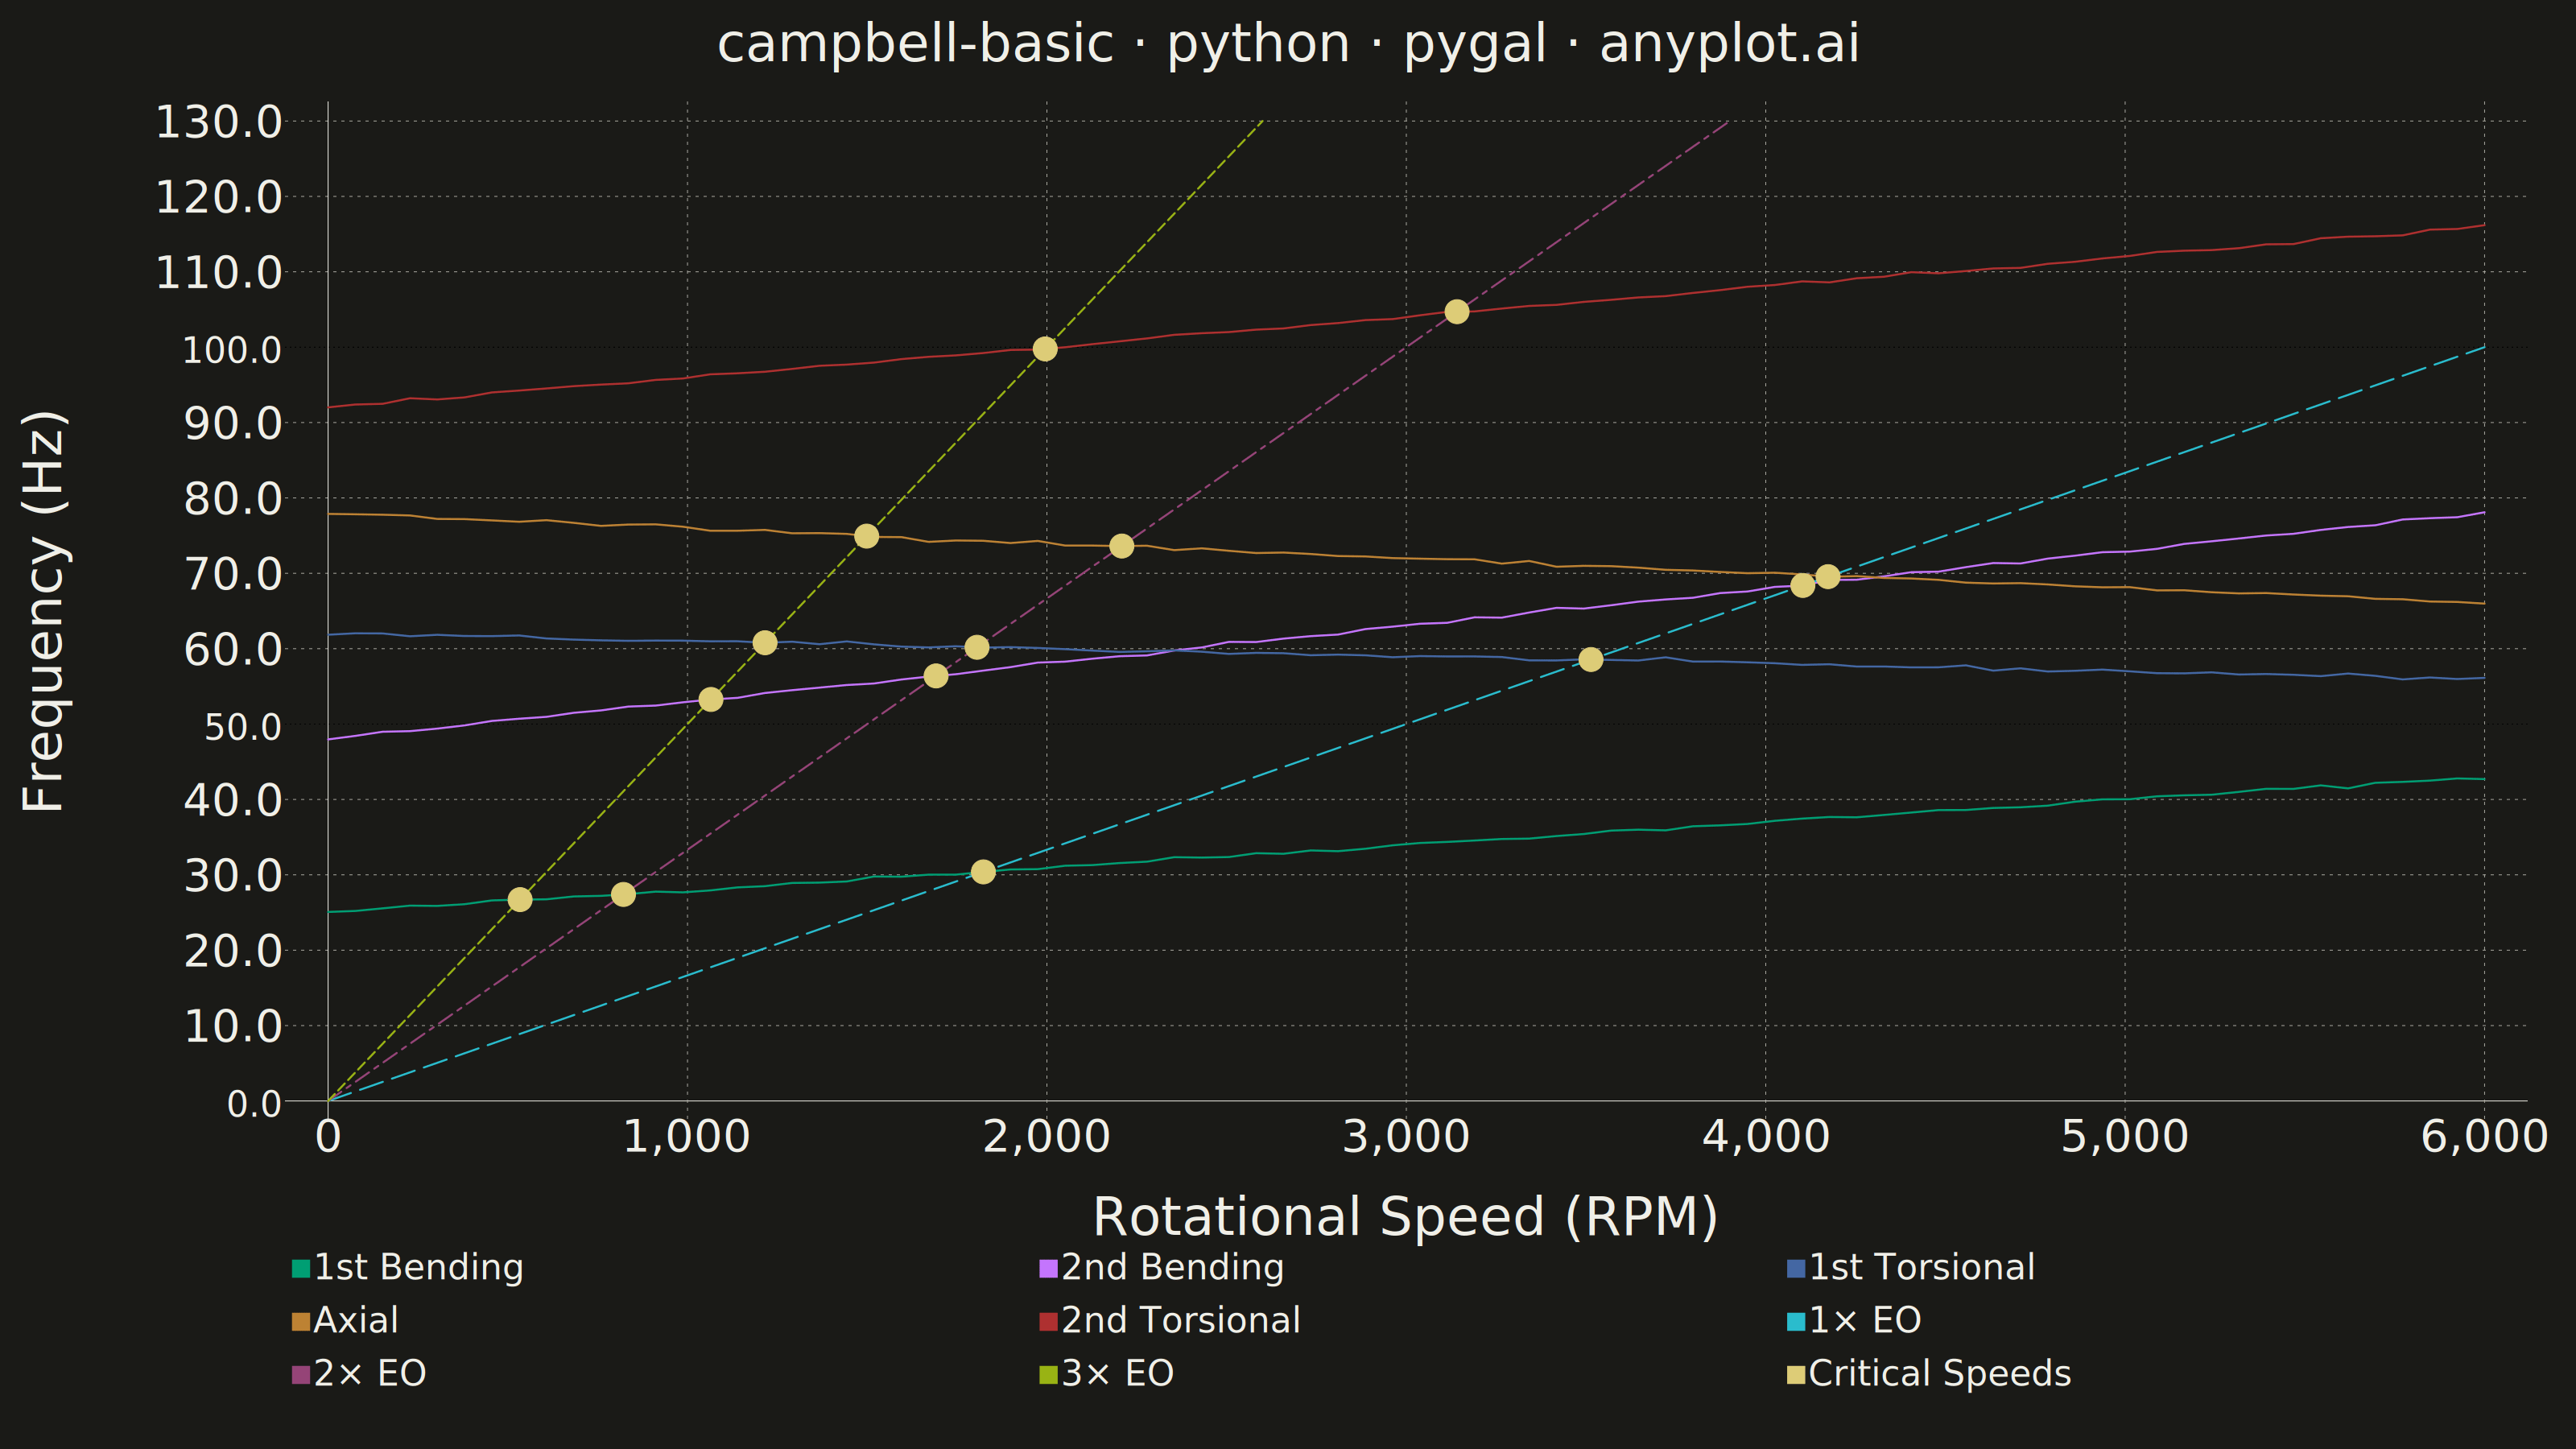
A Campbell Diagram (also called an interference diagram) plots natural frequencies against rotational speed to identify critical speeds and resonance conditions in rotating machinery. It overlays engine order excitation lines (diagonal lines from the origin) on top of natural frequency curves, with intersections marking critical speeds where resonance may occur. This visualization is essential for ensuring safe operating ranges in turbomachinery, automotive powertrains, and other rotating equipment.
""" anyplot.ai
campbell-basic: Campbell Diagram
Library: pygal 3.1.0 | Python 3.13.13
Quality: 92/100 | Updated: 2026-05-28
"""

import os
import sys


# Prevent self-import: this file is named pygal.py, which shadows the installed
# pygal package when the script directory is first in sys.path.
_here = os.path.dirname(os.path.abspath(__file__))
if _here in sys.path:
    sys.path.remove(_here)

import numpy as np
import pygal
from pygal.style import Style


# Theme tokens
THEME = os.getenv("ANYPLOT_THEME", "light")
PAGE_BG = "#FAF8F1" if THEME == "light" else "#1A1A17"
INK = "#1A1A17" if THEME == "light" else "#F0EFE8"
INK_MUTED = "#6B6A63" if THEME == "light" else "#A8A79F"

# Data — natural frequencies of a rotor system vs rotational speed
np.random.seed(42)
speed_rpm = np.linspace(0, 6000, 80)
speed_hz = speed_rpm / 60

# Natural frequency modes (Hz) with gyroscopic effects
mode1 = 25 + 0.003 * speed_rpm + np.random.normal(0, 0.15, len(speed_rpm))
mode2 = 48 + 0.005 * speed_rpm + np.random.normal(0, 0.15, len(speed_rpm))
mode3 = 62 - 0.001 * speed_rpm + np.random.normal(0, 0.15, len(speed_rpm))
mode4 = 78 - 0.002 * speed_rpm + np.random.normal(0, 0.15, len(speed_rpm))
mode5 = 92 + 0.004 * speed_rpm + np.random.normal(0, 0.15, len(speed_rpm))

orders = [1, 2, 3]
modes_data = [mode1, mode2, mode3, mode4, mode5]
mode_names = ["1st Bending", "2nd Bending", "1st Torsional", "Axial", "2nd Torsional"]

# Find critical speed intersections
critical_speeds = []
critical_info = []
for order in orders:
    eo_freq = order * speed_hz
    for mi, mode in enumerate(modes_data):
        diff = eo_freq - mode
        sign_changes = np.where(np.diff(np.sign(diff)))[0]
        for idx in sign_changes:
            frac = abs(diff[idx]) / (abs(diff[idx]) + abs(diff[idx + 1]))
            rpm_interp = speed_rpm[idx] + frac * (speed_rpm[idx + 1] - speed_rpm[idx])
            freq_interp = order * rpm_interp / 60
            if 0 < rpm_interp < 6000:
                critical_speeds.append((float(rpm_interp), float(freq_interp)))
                critical_info.append((order, mode_names[mi]))

font = "DejaVu Sans, Helvetica, Arial, sans-serif"
custom_style = Style(
    background=PAGE_BG,
    plot_background=PAGE_BG,
    foreground=INK,
    foreground_strong=INK,
    foreground_subtle=INK_MUTED,
    guide_stroke_color=INK_MUTED,
    guide_stroke_dasharray="4, 6",
    major_guide_stroke_dasharray="2, 4",
    colors=(
        "#009E73",  # 1st Bending — anyplot green
        "#C475FD",  # 2nd Bending — lavender
        "#4467A3",  # 1st Torsional — blue
        "#BD8233",  # Axial — ochre
        "#AE3030",  # 2nd Torsional — matte red
        "#2ABCCD",  # 1× EO — cyan (clearly distinct from all mode colors)
        "#954477",  # 2× EO — rose
        "#99B314",  # 3× EO — lime
        "#DDCC77",  # Critical Speeds — amber (semantic warning anchor)
    ),
    font_family=font,
    title_font_family=font,
    title_font_size=66,
    label_font_size=56,
    major_label_font_size=44,
    legend_font_size=44,
    legend_font_family=font,
    value_font_size=36,
    tooltip_font_size=28,
    tooltip_font_family=font,
    opacity=1.0,
    opacity_hover=1.0,
    stroke_opacity=1.0,
    stroke_opacity_hover=1.0,
    stroke_width=2.5,
)

chart = pygal.XY(
    width=3200,
    height=1800,
    style=custom_style,
    title="campbell-basic · python · pygal · anyplot.ai",
    x_title="Rotational Speed (RPM)",
    y_title="Frequency (Hz)",
    show_legend=True,
    legend_at_bottom=True,
    legend_at_bottom_columns=3,
    legend_box_size=20,
    stroke=True,
    dots_size=0,
    show_x_guides=True,
    show_y_guides=True,
    x_value_formatter=lambda x: f"{x:,.0f}",
    value_formatter=lambda y: f"{y:.1f}",
    margin_bottom=80,
    margin_left=100,
    margin_right=60,
    margin_top=50,
    x_label_rotation=0,
    truncate_legend=-1,
    range=(0, 130),
    xrange=(0, 6000),
    print_values=False,
    print_zeroes=False,
    tooltip_fancy_mode=True,
    js=[],
)

# Natural frequency mode curves — solid, thick lines with cubic interpolation
for mode, label in zip(modes_data, mode_names, strict=True):
    points = []
    label_idx = int(len(speed_rpm) * 0.82)
    for j, (r, f) in enumerate(zip(speed_rpm, mode, strict=True)):
        if j == label_idx:
            points.append({"value": (float(r), float(f)), "label": label})
        else:
            points.append((float(r), float(f)))
    chart.add(label, points, stroke_style={"width": 7, "linecap": "round"}, show_dots=False, interpolate="cubic")

# Engine order lines — dashed with prominent width and clear patterns
eo_labels = ["1× EO", "2× EO", "3× EO"]
eo_dash_patterns = ["30, 12", "20, 8, 6, 8", "12, 6"]
for order, eo_label, dash in zip(orders, eo_labels, eo_dash_patterns, strict=True):
    eo_end_rpm = min(6000.0, 130.0 * 60.0 / order)
    eo_rpms = np.linspace(0, eo_end_rpm, 40)
    eo_freqs = order * eo_rpms / 60.0
    label_idx = int(len(eo_rpms) * 0.70)
    eo_points = []
    for j, (r, f) in enumerate(zip(eo_rpms, eo_freqs, strict=True)):
        if j == label_idx:
            eo_points.append({"value": (float(r), float(f)), "label": eo_label})
        else:
            eo_points.append((float(r), float(f)))
    chart.add(eo_label, eo_points, stroke_style={"width": 6, "dasharray": dash, "linecap": "round"}, show_dots=False)

# Critical speed markers — amber warning dots with intersection details
critical_points = []
for pt, info in zip(critical_speeds, critical_info, strict=True):
    order, mname = info
    critical_points.append({"value": pt, "label": f"{mname} × {order}× EO\n{pt[0]:.0f} RPM / {pt[1]:.1f} Hz"})
chart.add("Critical Speeds", critical_points, stroke=False, dots_size=15)

# Save — write to the script's own directory regardless of working directory
_out = os.path.join(_here, f"plot-{THEME}")
with open(f"{_out}.html", "wb") as f:
    f.write(chart.render())
chart.render_to_png(f"{_out}.png")
Runnable source as JSON, for any HTTP client: https://api.anyplot.ai/specs/campbell-basic/pygal/code. Any spec id and library id listed in llms-full.txt fit the same URL shape; every URL below is complete and callable.
{
  "spec_id": "campbell-basic",
  "language": "python",
  "library": "pygal",
  "page": "https://anyplot.ai/campbell-basic/python/pygal",
  "hub": "https://anyplot.ai/campbell-basic",
  "code_json": "https://api.anyplot.ai/specs/campbell-basic/pygal/code",
  "spec_json": "https://api.anyplot.ai/specs/campbell-basic",
  "render_light_png": "https://storage.googleapis.com/anyplot-images/plots/campbell-basic/python/pygal/plot-light.png",
  "render_dark_png": "https://storage.googleapis.com/anyplot-images/plots/campbell-basic/python/pygal/plot-dark.png",
  "interactive_light_html": "https://storage.googleapis.com/anyplot-images/plots/campbell-basic/python/pygal/plot-light.html",
  "interactive_dark_html": "https://storage.googleapis.com/anyplot-images/plots/campbell-basic/python/pygal/plot-dark.html",
  "quality_score": 92.0,
  "license": "MIT",
  "guide": "https://anyplot.ai/llms.txt"
}
Part of Campbell Diagram on anyplot.ai.