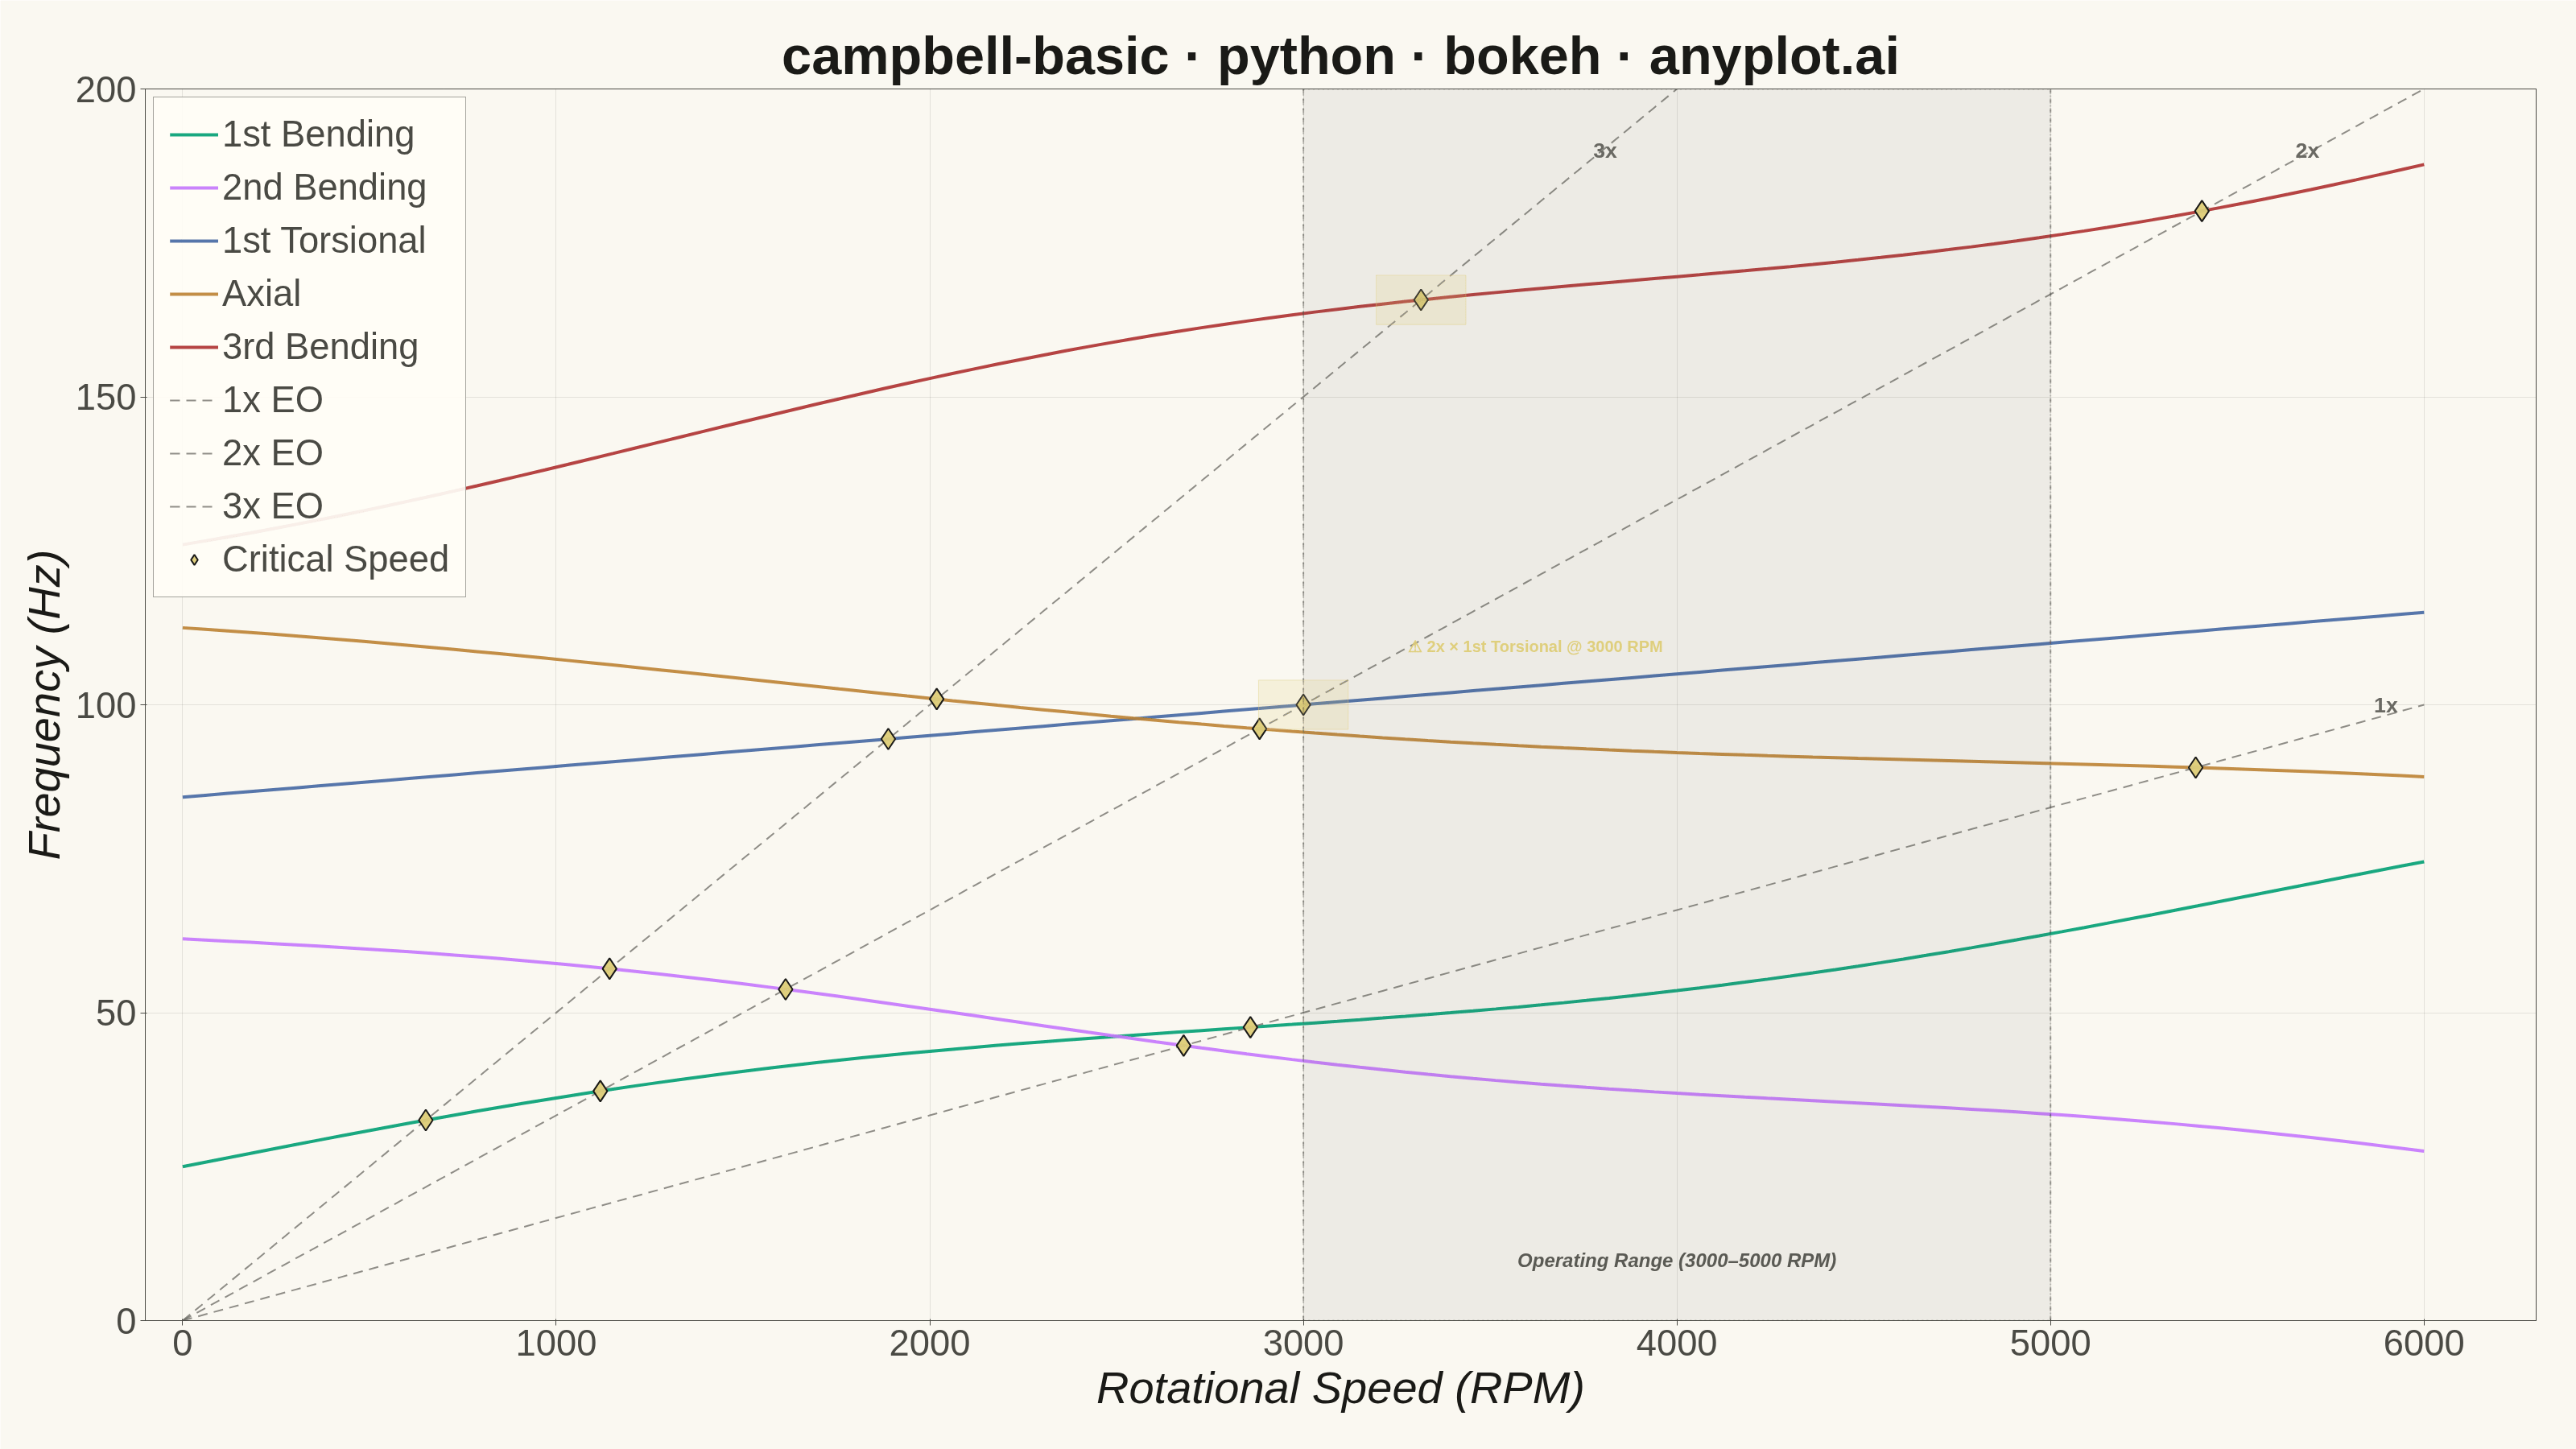
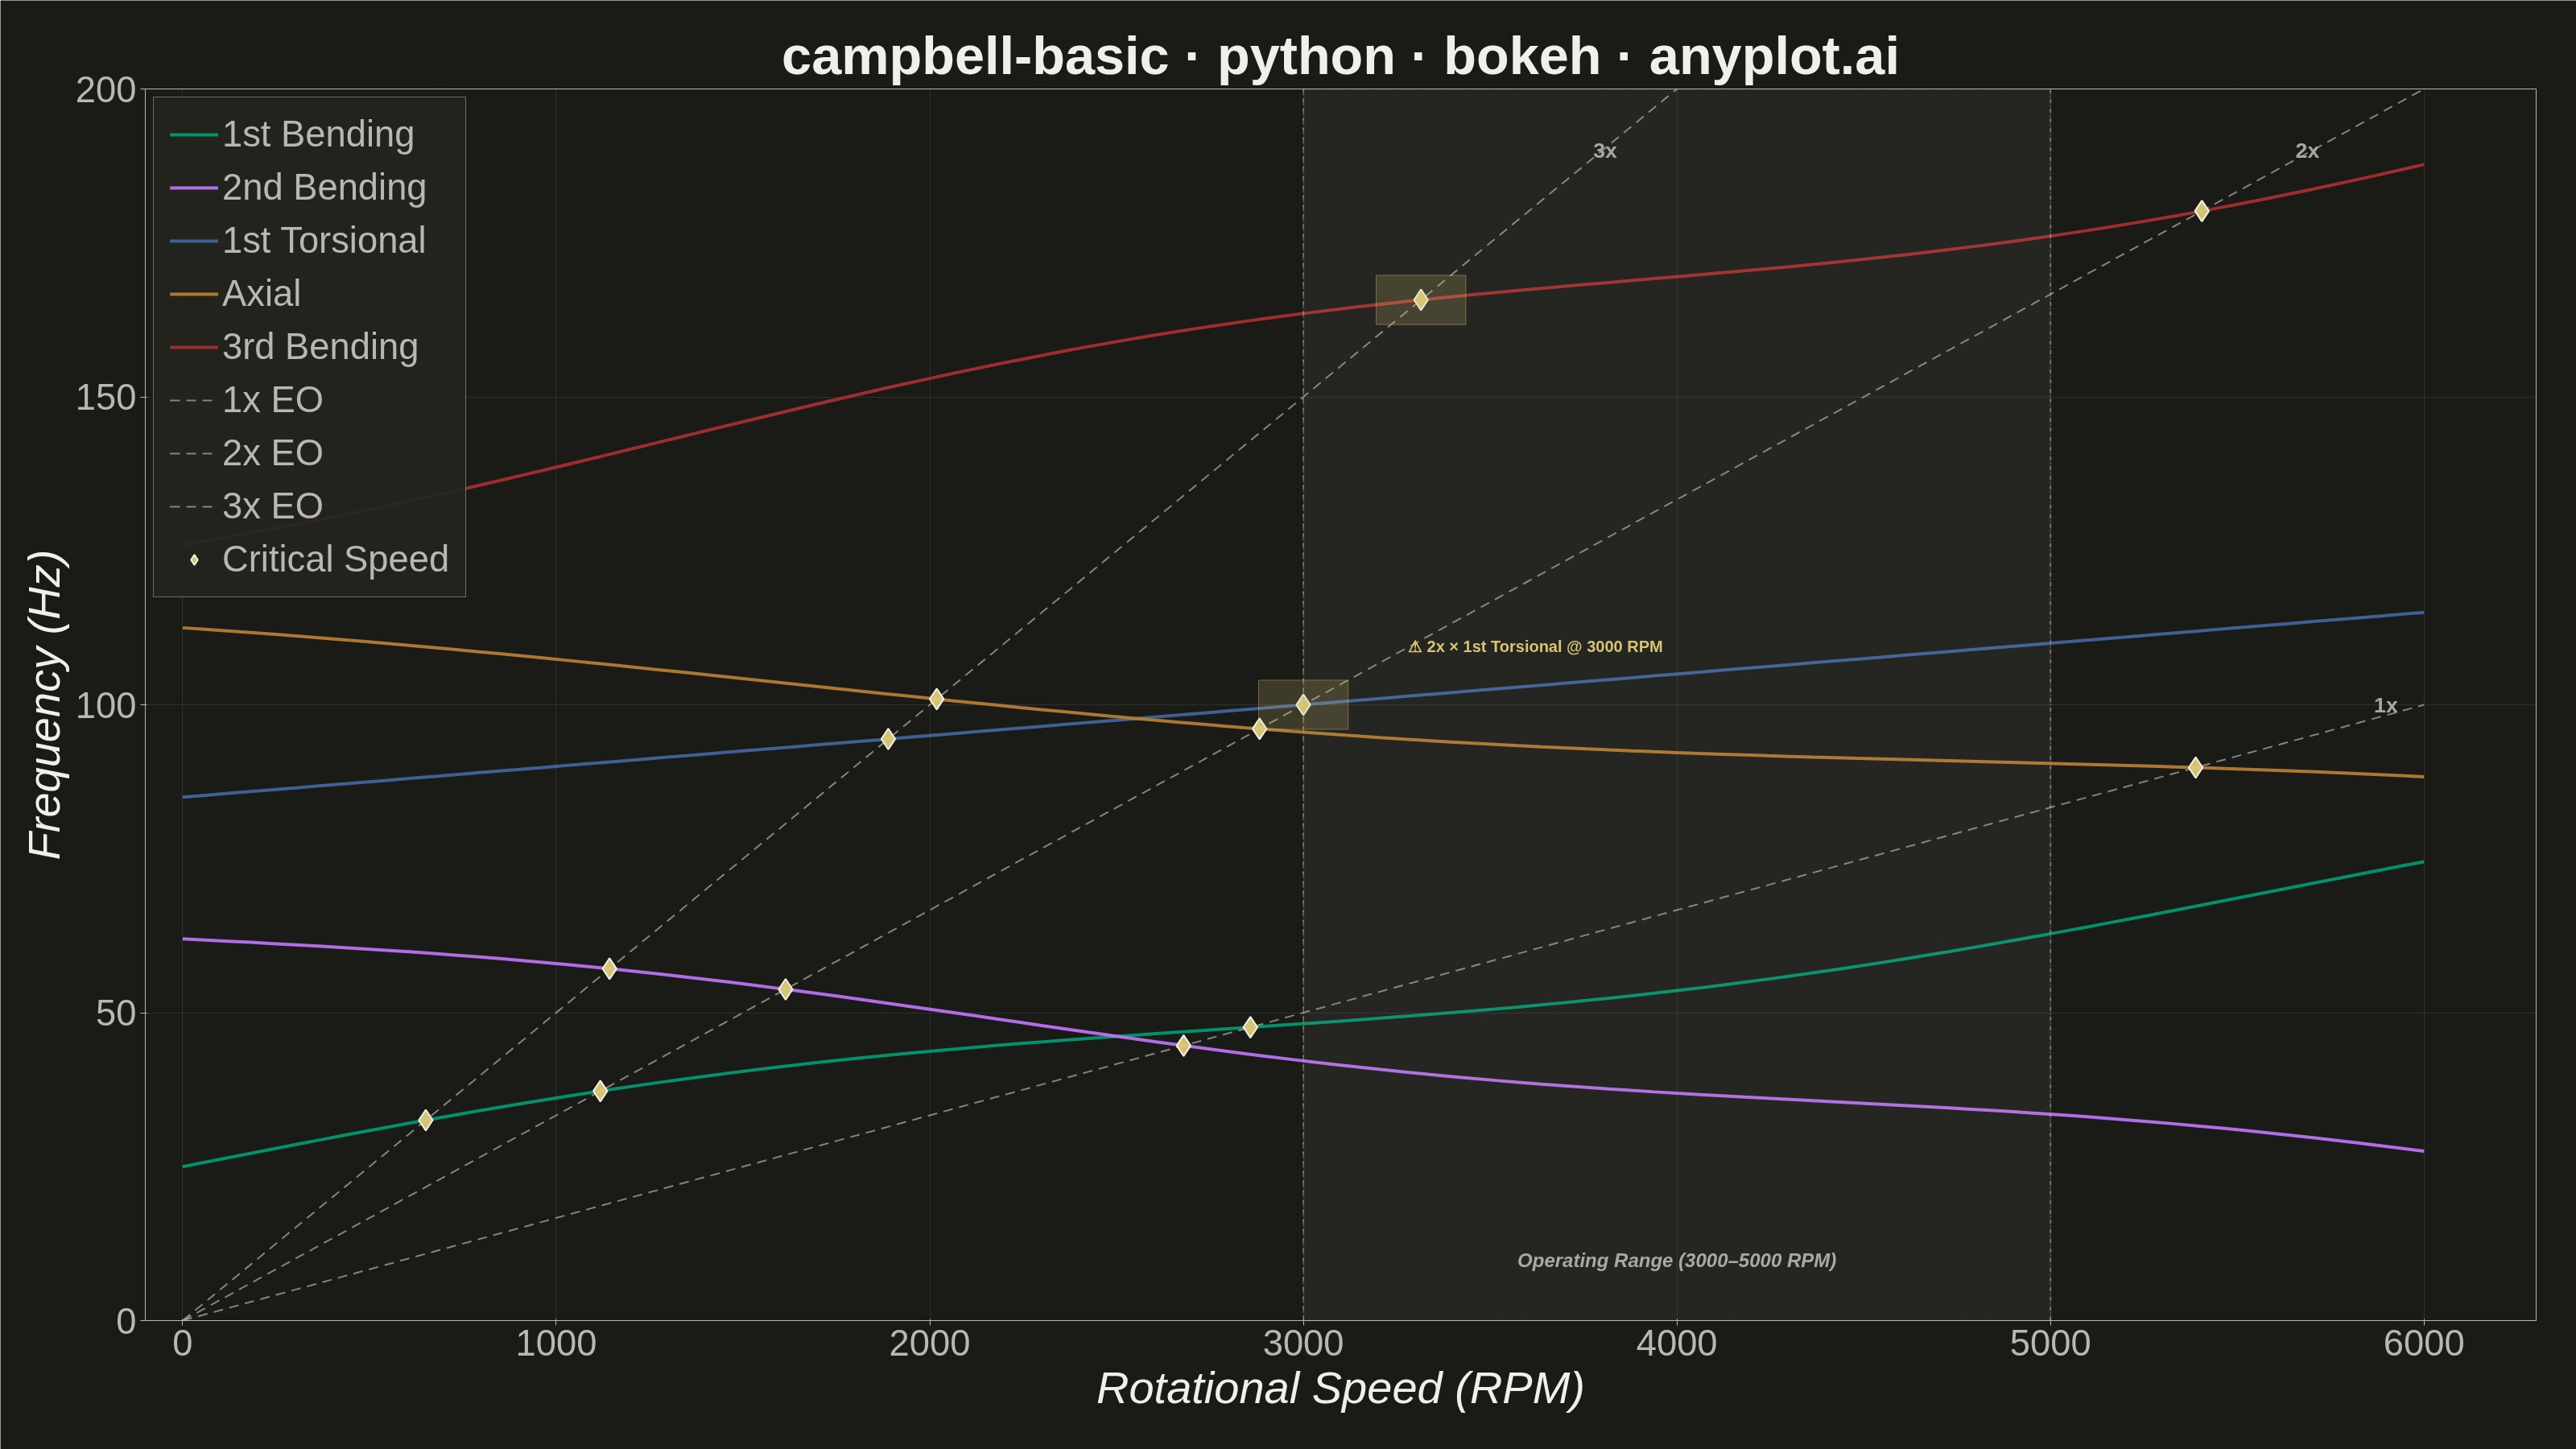
A Campbell Diagram (also called an interference diagram) plots natural frequencies against rotational speed to identify critical speeds and resonance conditions in rotating machinery. It overlays engine order excitation lines (diagonal lines from the origin) on top of natural frequency curves, with intersections marking critical speeds where resonance may occur. This visualization is essential for ensuring safe operating ranges in turbomachinery, automotive powertrains, and other rotating equipment.
""" anyplot.ai
campbell-basic: Campbell Diagram
Library: bokeh 3.9.0 | Python 3.13.13
Quality: 90/100 | Updated: 2026-05-28
"""

import os
import sys
import time
from pathlib import Path


# Prevent this file from shadowing the installed bokeh package
_this_dir = str(Path(__file__).parent.resolve())
sys.path = [p for p in sys.path if os.path.normpath(p) != os.path.normpath(_this_dir)]

import numpy as np
from bokeh.io import output_file, save
from bokeh.models import BoxAnnotation, ColumnDataSource, HoverTool, Label, Legend, LegendItem, Range1d, Span
from bokeh.plotting import figure
from selenium import webdriver
from selenium.webdriver.chrome.options import Options


# Theme
THEME = os.getenv("ANYPLOT_THEME", "light")
PAGE_BG = "#FAF8F1" if THEME == "light" else "#1A1A17"
ELEVATED_BG = "#FFFDF6" if THEME == "light" else "#242420"
INK = "#1A1A17" if THEME == "light" else "#F0EFE8"
INK_SOFT = "#4A4A44" if THEME == "light" else "#B8B7B0"
INK_MUTED = "#6B6A63" if THEME == "light" else "#A8A79F"

IMPRINT_PALETTE = ["#009E73", "#C475FD", "#4467A3", "#BD8233", "#AE3030", "#2ABCCD", "#954477", "#99B314"]
ANYPLOT_AMBER = "#DDCC77"

# Data
np.random.seed(42)
speeds = np.linspace(0, 6000, 100)

# Natural frequency modes (Hz) with realistic rotordynamic behavior
mode_1_bending = 25 + 0.008 * speeds + 3.5 * np.sin(speeds / 2800 * np.pi)
mode_2_bending = 62 - 0.006 * speeds + 2.0 * np.sin(speeds / 2200 * np.pi)
mode_1_torsional = 85 + 0.005 * speeds
mode_axial = 110 - 0.004 * speeds + 2.5 * np.cos(speeds / 3200 * np.pi)
mode_3_bending = 130 + 0.010 * speeds - 4.0 * np.cos(speeds / 2600 * np.pi)

modes = {
    "1st Bending": mode_1_bending,
    "2nd Bending": mode_2_bending,
    "1st Torsional": mode_1_torsional,
    "Axial": mode_axial,
    "3rd Bending": mode_3_bending,
}
mode_colors = IMPRINT_PALETTE[:5]

# Engine order lines: frequency = order * speed / 60
engine_orders = [1, 2, 3]
eo_frequencies = {order: order * speeds / 60 for order in engine_orders}

# Find critical speed intersections via sign-change interpolation
critical_speeds_rpm = []
critical_speeds_freq = []
critical_speed_labels = []
critical_in_operating = []

for order in engine_orders:
    eo_freq = eo_frequencies[order]
    for mode_name, mode_freq in modes.items():
        diff = eo_freq - mode_freq
        sign_changes = np.where(np.diff(np.sign(diff)))[0]
        for idx in sign_changes:
            denom = abs(diff[idx]) + abs(diff[idx + 1])
            if denom == 0:
                continue
            frac = abs(diff[idx]) / denom
            rpm_val = speeds[idx] + frac * (speeds[idx + 1] - speeds[idx])
            freq_val = mode_freq[idx] + frac * (mode_freq[idx + 1] - mode_freq[idx])
            if 100 < rpm_val < 5900 and 5 < freq_val < 195:
                critical_speeds_rpm.append(rpm_val)
                critical_speeds_freq.append(freq_val)
                critical_speed_labels.append(f"{order}x × {mode_name}")
                critical_in_operating.append(3000 <= rpm_val <= 5000)

# Y-range
all_freqs = np.concatenate(list(modes.values()))
y_max_data = max(np.max(all_freqs), max(critical_speeds_freq) if critical_speeds_freq else 0)
y_max = min(int(np.ceil(y_max_data / 10) * 10) + 15, 200)

# Title with font-size scaling
title = "campbell-basic · python · bokeh · anyplot.ai"
title_len = len(title)
title_fontsize = f"{round(50 * min(67 / title_len, 1.0))}pt"

# Plot
p = figure(
    width=3200,
    height=1800,
    title=title,
    x_axis_label="Rotational Speed (RPM)",
    y_axis_label="Frequency (Hz)",
    x_range=Range1d(-100, 6300),
    y_range=Range1d(0, y_max),
    toolbar_location=None,
    min_border_bottom=160,
    min_border_left=180,
    min_border_top=110,
    min_border_right=50,
)

# Operating range shading (3000–5000 RPM)
operating_zone = BoxAnnotation(
    left=3000,
    right=5000,
    fill_color=INK_SOFT,
    fill_alpha=0.07,
    line_color=INK_SOFT,
    line_alpha=0.3,
    line_dash="dotted",
    line_width=2,
)
p.add_layout(operating_zone)

# Operating range boundary lines
for rpm_boundary in [3000, 5000]:
    boundary_line = Span(
        location=rpm_boundary, dimension="height", line_color=INK_SOFT, line_alpha=0.4, line_width=2, line_dash="dashed"
    )
    p.add_layout(boundary_line)

# Operating range label
op_label = Label(
    x=4000,
    y=y_max * 0.04,
    text="Operating Range (3000–5000 RPM)",
    text_font_size="18pt",
    text_color=INK_SOFT,
    text_alpha=0.9,
    text_align="center",
    text_font_style="bold italic",
)
p.add_layout(op_label)

# Danger zones around critical speeds within operating range
for rpm_val, freq_val, in_op in zip(critical_speeds_rpm, critical_speeds_freq, critical_in_operating, strict=True):
    if in_op:
        danger = BoxAnnotation(
            left=rpm_val - 120,
            right=rpm_val + 120,
            bottom=freq_val - 4,
            top=freq_val + 4,
            fill_color=ANYPLOT_AMBER,
            fill_alpha=0.18,
            line_color=ANYPLOT_AMBER,
            line_alpha=0.4,
            line_width=1,
        )
        p.add_layout(danger)

# Natural frequency curves (Imprint palette positions 1–5)
legend_items = []
for i, (mode_name, mode_freq) in enumerate(modes.items()):
    source = ColumnDataSource(data={"speed": speeds, "freq": mode_freq})
    line = p.line(x="speed", y="freq", source=source, line_width=4, line_color=mode_colors[i], line_alpha=0.9)
    legend_items.append(LegendItem(label=mode_name, renderers=[line]))

# Engine order lines (theme-adaptive muted)
for order in engine_orders:
    eo_freq = eo_frequencies[order]
    mask = eo_freq <= y_max
    clipped_speeds = speeds[mask]
    clipped_freq = eo_freq[mask]
    source = ColumnDataSource(data={"speed": clipped_speeds, "freq": clipped_freq})
    line = p.line(
        x="speed", y="freq", source=source, line_width=2, line_color=INK_MUTED, line_dash=[12, 8], line_alpha=0.75
    )
    legend_items.append(LegendItem(label=f"{order}x EO", renderers=[line]))

# Engine order labels at right edge
for order in engine_orders:
    freq_at_max = order * 6000 / 60
    if freq_at_max > y_max - 5:
        label_rpm = (y_max - 12) * 60 / order
        label_freq = y_max - 10
    else:
        label_rpm = 5850
        label_freq = freq_at_max
    label = Label(
        x=label_rpm,
        y=label_freq,
        text=f" {order}x",
        text_font_size="20pt",
        text_color=INK_MUTED,
        text_font_style="bold",
        text_baseline="middle",
    )
    p.add_layout(label)

# Critical speed markers (amber = warning semantic anchor)
if critical_speeds_rpm:
    crit_source = ColumnDataSource(
        data={
            "rpm": critical_speeds_rpm,
            "freq": critical_speeds_freq,
            "label": critical_speed_labels,
            "rpm_display": [f"{r:.0f}" for r in critical_speeds_rpm],
            "freq_display": [f"{f:.1f}" for f in critical_speeds_freq],
            "in_operating": ["YES — CAUTION" if op else "No" for op in critical_in_operating],
        }
    )
    crit_scatter = p.scatter(
        x="rpm",
        y="freq",
        source=crit_source,
        marker="diamond",
        size=26,
        fill_color=ANYPLOT_AMBER,
        line_color=INK,
        line_width=2,
        fill_alpha=0.95,
    )
    legend_items.append(LegendItem(label="Critical Speed", renderers=[crit_scatter]))

    hover = HoverTool(
        renderers=[crit_scatter],
        tooltips=[
            ("Intersection", "@label"),
            ("RPM", "@rpm_display"),
            ("Frequency", "@freq_display Hz"),
            ("In Operating Range?", "@in_operating"),
        ],
        mode="mouse",
    )
    p.add_tools(hover)

    # Annotate the lowest critical intersection inside the operating range
    op_crits = [
        (r, f, lbl)
        for r, f, lbl, op in zip(
            critical_speeds_rpm, critical_speeds_freq, critical_speed_labels, critical_in_operating, strict=True
        )
        if op
    ]
    if op_crits:
        op_crits.sort(key=lambda x: x[1])
        worst_rpm, worst_freq, worst_label = op_crits[0]
        annotation = Label(
            x=worst_rpm + 280,
            y=worst_freq + 8,
            text=f"⚠ {worst_label} @ {worst_rpm:.0f} RPM",
            text_font_size="15pt",
            text_color=ANYPLOT_AMBER,
            text_font_style="bold",
            text_alpha=0.95,
        )
        p.add_layout(annotation)

# Legend — increased glyph size and spacing to address previous weakness
legend = Legend(
    items=legend_items,
    location="top_left",
    label_text_font_size="34pt",
    label_text_color=INK_SOFT,
    glyph_width=60,
    glyph_height=32,
    spacing=14,
    padding=20,
    background_fill_color=ELEVATED_BG,
    background_fill_alpha=0.92,
    border_line_color=INK_SOFT,
    border_line_alpha=0.5,
    border_line_width=1,
)
p.add_layout(legend)

# Title
p.title.text_font_size = title_fontsize
p.title.align = "center"
p.title.text_color = INK
p.title.text_font_style = "bold"

# Axis styling
p.xaxis.axis_label_text_font_size = "42pt"
p.yaxis.axis_label_text_font_size = "42pt"
p.xaxis.major_label_text_font_size = "34pt"
p.yaxis.major_label_text_font_size = "34pt"
p.xaxis.axis_label_text_color = INK
p.yaxis.axis_label_text_color = INK
p.xaxis.major_label_text_color = INK_SOFT
p.yaxis.major_label_text_color = INK_SOFT
p.xaxis.axis_line_color = INK_SOFT
p.yaxis.axis_line_color = INK_SOFT
p.xaxis.major_tick_line_color = INK_SOFT
p.yaxis.major_tick_line_color = INK_SOFT
p.xaxis.minor_tick_line_color = None
p.yaxis.minor_tick_line_color = None

# Grid
p.xgrid.grid_line_color = INK
p.xgrid.grid_line_alpha = 0.10
p.ygrid.grid_line_color = INK
p.ygrid.grid_line_alpha = 0.10

# Background and border
p.background_fill_color = PAGE_BG
p.border_fill_color = PAGE_BG
p.outline_line_color = INK_SOFT

# Save HTML
output_file(f"plot-{THEME}.html")
save(p)

# Save PNG via headless Chrome (Selenium)
W, H = 3200, 1800
opts = Options()
for arg in (
    "--headless=new",
    "--no-sandbox",
    "--disable-dev-shm-usage",
    "--disable-gpu",
    f"--window-size={W},{H}",
    "--hide-scrollbars",
):
    opts.add_argument(arg)
driver = webdriver.Chrome(options=opts)
driver.execute_cdp_cmd(
    "Emulation.setDeviceMetricsOverride", {"width": W, "height": H, "deviceScaleFactor": 1, "mobile": False}
)
driver.get(f"file://{Path(f'plot-{THEME}.html').resolve()}")
time.sleep(3)
driver.save_screenshot(f"plot-{THEME}.png")
driver.quit()
Runnable source as JSON, for any HTTP client: https://api.anyplot.ai/specs/campbell-basic/bokeh/code. Any spec id and library id listed in llms-full.txt fit the same URL shape; every URL below is complete and callable.
{
  "spec_id": "campbell-basic",
  "language": "python",
  "library": "bokeh",
  "page": "https://anyplot.ai/campbell-basic/python/bokeh",
  "hub": "https://anyplot.ai/campbell-basic",
  "code_json": "https://api.anyplot.ai/specs/campbell-basic/bokeh/code",
  "spec_json": "https://api.anyplot.ai/specs/campbell-basic",
  "render_light_png": "https://storage.googleapis.com/anyplot-images/plots/campbell-basic/python/bokeh/plot-light.png",
  "render_dark_png": "https://storage.googleapis.com/anyplot-images/plots/campbell-basic/python/bokeh/plot-dark.png",
  "interactive_light_html": "https://storage.googleapis.com/anyplot-images/plots/campbell-basic/python/bokeh/plot-light.html",
  "interactive_dark_html": "https://storage.googleapis.com/anyplot-images/plots/campbell-basic/python/bokeh/plot-dark.html",
  "quality_score": 90.0,
  "license": "MIT",
  "guide": "https://anyplot.ai/llms.txt"
}
Part of Campbell Diagram on anyplot.ai.