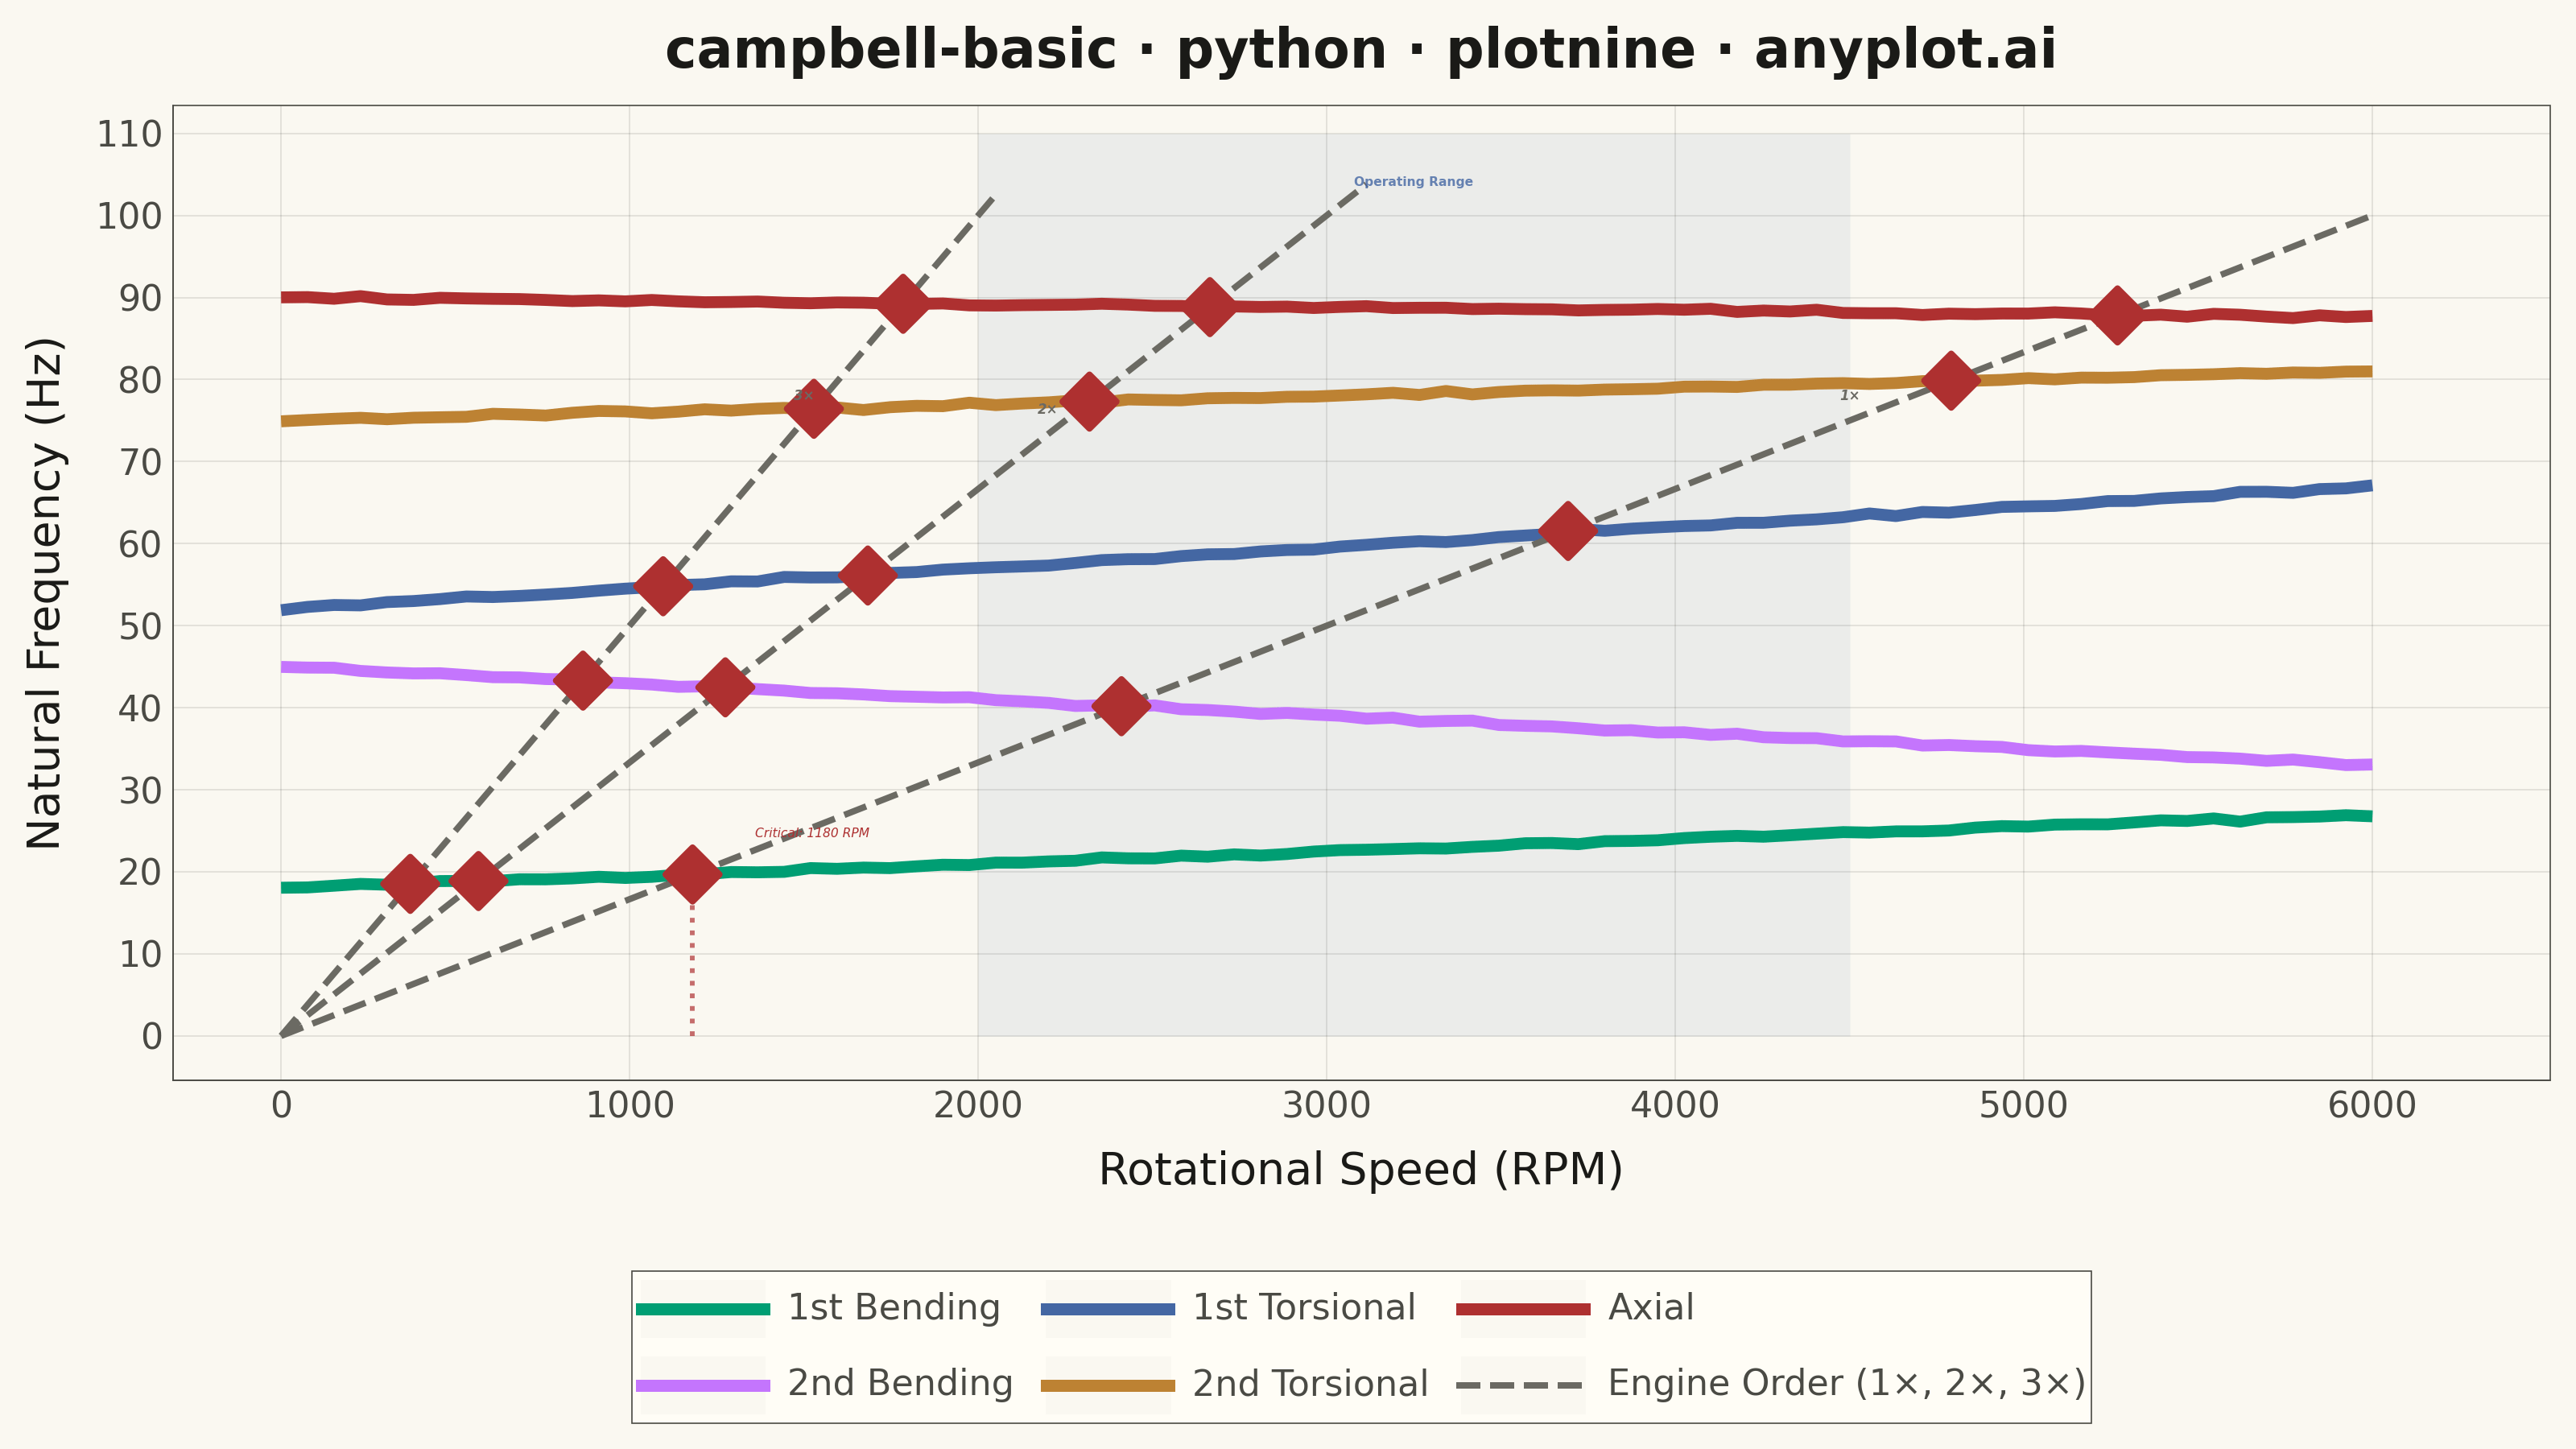
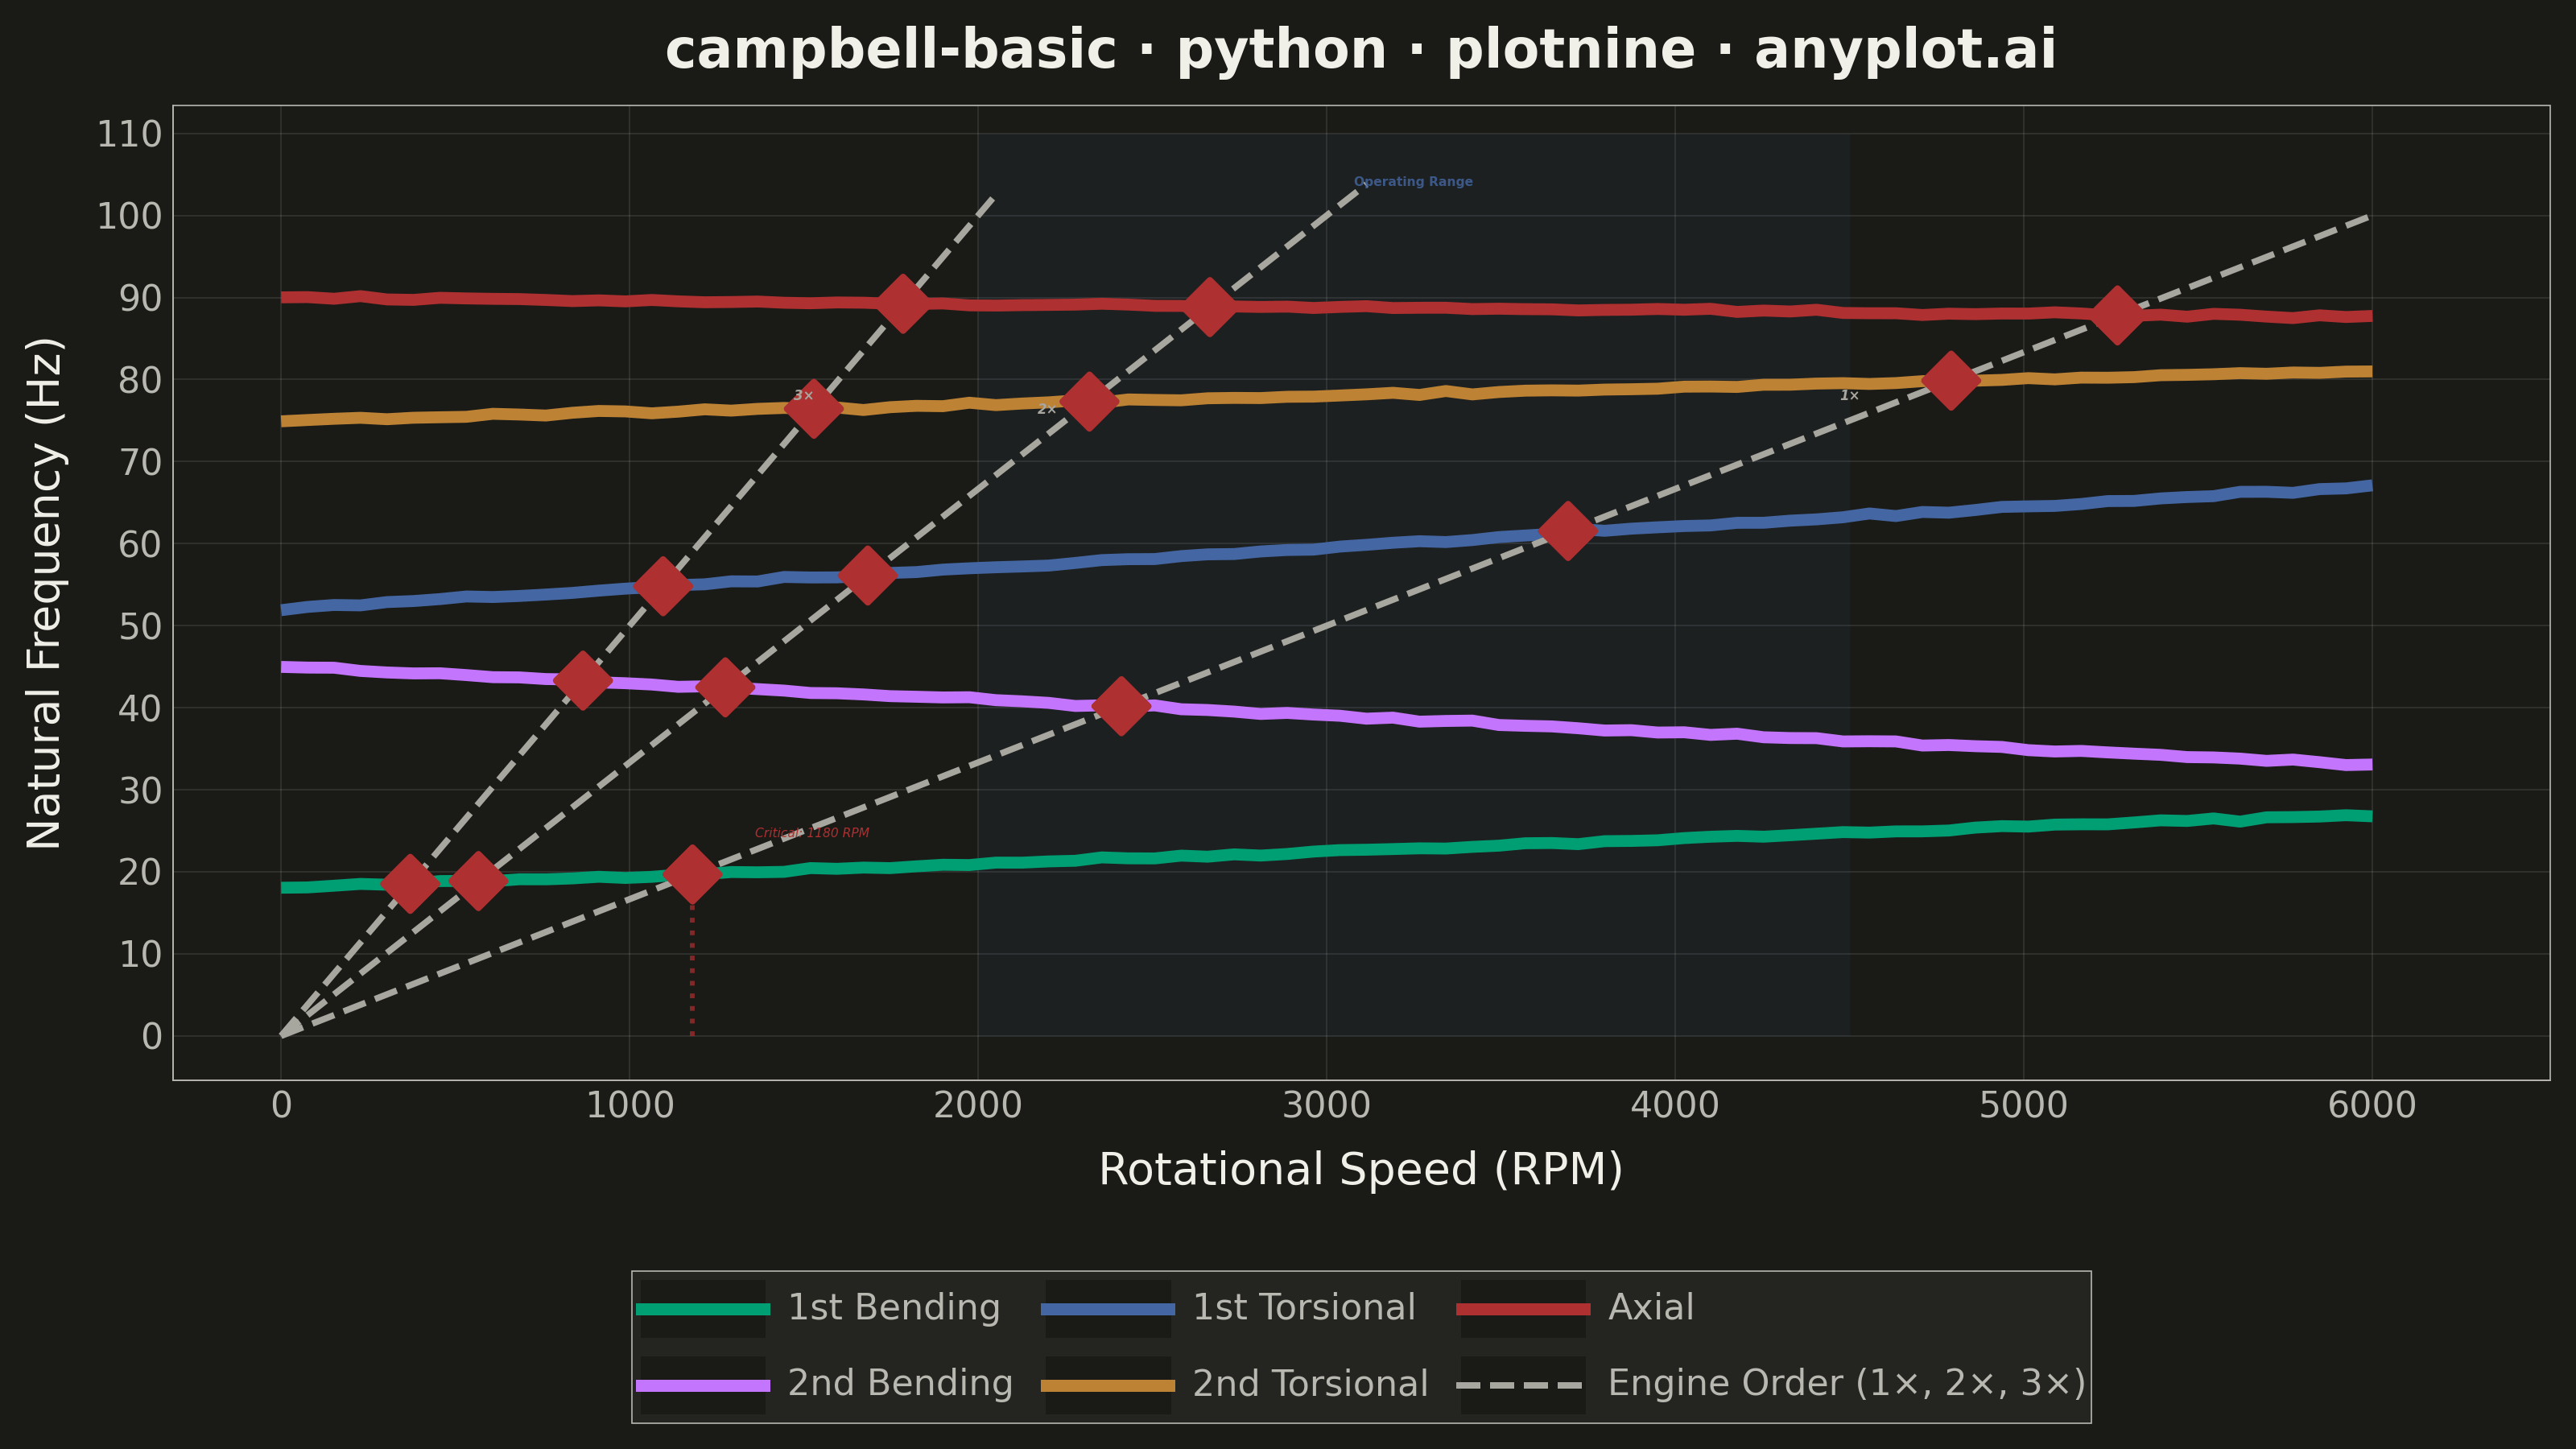
A Campbell Diagram (also called an interference diagram) plots natural frequencies against rotational speed to identify critical speeds and resonance conditions in rotating machinery. It overlays engine order excitation lines (diagonal lines from the origin) on top of natural frequency curves, with intersections marking critical speeds where resonance may occur. This visualization is essential for ensuring safe operating ranges in turbomachinery, automotive powertrains, and other rotating equipment.
""" anyplot.ai
campbell-basic: Campbell Diagram
Library: plotnine 0.15.4 | Python 3.13.13
Quality: 86/100 | Updated: 2026-05-28
"""

import os

import numpy as np
import pandas as pd
from plotnine import (
    aes,
    annotate,
    coord_cartesian,
    element_blank,
    element_line,
    element_rect,
    element_text,
    geom_line,
    geom_point,
    geom_rect,
    geom_text,
    ggplot,
    guide_legend,
    guides,
    labs,
    scale_color_manual,
    scale_linetype_manual,
    scale_size_identity,
    scale_x_continuous,
    scale_y_continuous,
    theme,
    theme_minimal,
)


# Theme tokens
THEME = os.getenv("ANYPLOT_THEME", "light")
PAGE_BG = "#FAF8F1" if THEME == "light" else "#1A1A17"
ELEVATED_BG = "#FFFDF6" if THEME == "light" else "#242420"
INK = "#1A1A17" if THEME == "light" else "#F0EFE8"
INK_SOFT = "#4A4A44" if THEME == "light" else "#B8B7B0"
INK_MUTED = "#6B6A63" if THEME == "light" else "#A8A79F"

# anyplot categorical palette — 5 hues, canonical order, first always #009E73
IMPRINT_PALETTE = ["#009E73", "#C475FD", "#4467A3", "#BD8233", "#AE3030"]
CRITICAL_COLOR = "#AE3030"  # semantic red — critical speed / danger
BAND_COLOR = "#4467A3"  # blue — operating range reference zone

# Data — natural frequencies vs rotational speed for turbomachinery
np.random.seed(42)
speed = np.linspace(0, 6000, 80)

modes = {
    "1st Bending": 18 + speed * 0.0015 + np.random.normal(0, 0.12, len(speed)),
    "2nd Bending": 45 - speed * 0.002 + np.random.normal(0, 0.12, len(speed)),
    "1st Torsional": 52 + speed * 0.0025 + np.random.normal(0, 0.12, len(speed)),
    "2nd Torsional": 75 + speed * 0.001 + np.random.normal(0, 0.12, len(speed)),
    "Axial": 90 - speed * 0.0004 + np.random.normal(0, 0.12, len(speed)),
}

mode_names = list(modes.keys())
mode_colors = dict(zip(mode_names, IMPRINT_PALETTE, strict=True))

df_modes = pd.DataFrame(
    [
        {"Speed": s, "Frequency": f, "Mode": name}
        for name, freqs in modes.items()
        for s, f in zip(speed, freqs, strict=True)
    ]
)

# Engine order lines clipped to useful frequency range (≤105 Hz)
engine_orders = [1, 2, 3]
eo_names = [f"{o}x EO" for o in engine_orders]
df_eo = pd.DataFrame(
    [
        {"Speed": s, "Frequency": order * s / 60, "Mode": f"{order}x EO"}
        for order in engine_orders
        for s in speed
        if order * s / 60 <= 105
    ]
)

# Critical speed intersections (EO line crosses natural frequency curve)
critical_points = []
for order in engine_orders:
    eo_freq = order * speed / 60
    for freq_values in modes.values():
        diff = eo_freq - freq_values
        sign_changes = np.where(np.diff(np.sign(diff)))[0]
        for idx in sign_changes:
            s0, s1 = speed[idx], speed[idx + 1]
            f0_eo, f1_eo = eo_freq[idx], eo_freq[idx + 1]
            f0_m, f1_m = freq_values[idx], freq_values[idx + 1]
            denom = (f1_eo - f0_eo) - (f1_m - f0_m)
            if abs(denom) > 1e-10:
                t = (f0_m - f0_eo) / denom
                cs = s0 + t * (s1 - s0)
                cf = f0_eo + t * (f1_eo - f0_eo)
                if 0 < cs < 6000 and 0 < cf < 110:
                    critical_points.append({"Speed": cs, "Frequency": cf})
df_critical = pd.DataFrame(critical_points)

# 1x / 1st Bending critical speed — most operationally significant
eo1_freq = speed / 60
diff_1b = eo1_freq - modes["1st Bending"]
sc_idx = np.where(np.diff(np.sign(diff_1b)))[0]
annot_speed = annot_freq = None
if len(sc_idx) > 0:
    idx = sc_idx[0]
    denom = (eo1_freq[idx + 1] - eo1_freq[idx]) - (modes["1st Bending"][idx + 1] - modes["1st Bending"][idx])
    if abs(denom) > 1e-10:
        t = (modes["1st Bending"][idx] - eo1_freq[idx]) / denom
        annot_speed = speed[idx] + t * (speed[idx + 1] - speed[idx])
        annot_freq = eo1_freq[idx] + t * (eo1_freq[idx + 1] - eo1_freq[idx])

# Combine lines — mode lines thicker than EO lines
df_lines = pd.concat([df_modes, df_eo], ignore_index=True)
df_lines["_lw"] = df_lines["Mode"].apply(lambda m: 1.5 if "EO" not in m else 0.8)

# Color / linetype mappings — all EO entries in color_map for scale coverage
color_map = {**mode_colors, **dict.fromkeys(eo_names, INK_MUTED)}
ltype_map = {**dict.fromkeys(mode_names, "solid"), **dict.fromkeys(eo_names, "dashed")}

# Legend shows 5 modes + one consolidated EO entry
breaks = mode_names + eo_names[:1]
labels = mode_names + ["Engine Order (1×, 2×, 3×)"]

# Operating range band (nominal: 2000–4500 RPM)
df_band = pd.DataFrame([{"xmin": 2000, "xmax": 4500, "ymin": 0, "ymax": 110}])

# EO italic labels along each line (geom_text size is in mm, not pt)
eo_labels = pd.DataFrame(
    [
        {"Speed": 4500, "Frequency": 4500 / 60 + 3, "label": "1×"},
        {"Speed": 2200, "Frequency": 2 * 2200 / 60 + 3, "label": "2×"},
        {"Speed": 1500, "Frequency": 3 * 1500 / 60 + 3, "label": "3×"},
    ]
)

# Plot
title = "campbell-basic · python · plotnine · anyplot.ai"

plot = (
    ggplot(df_lines, aes("Speed", "Frequency", color="Mode", linetype="Mode", group="Mode"))
    # Operating range shading
    + geom_rect(
        df_band,
        aes(xmin="xmin", xmax="xmax", ymin="ymin", ymax="ymax"),
        fill=BAND_COLOR,
        alpha=0.13,
        color="none",
        inherit_aes=False,
    )
    # Natural frequency curves + EO lines
    + geom_line(aes(size="_lw"))
    + scale_size_identity()
    # Critical speed intersection markers
    + geom_point(
        df_critical,
        aes("Speed", "Frequency"),
        color=CRITICAL_COLOR,
        fill=CRITICAL_COLOR,
        size=4.0,
        shape="D",
        stroke=0.8,
        inherit_aes=False,
        show_legend=False,
    )
    # EO order labels along diagonal lines (size in mm)
    + geom_text(
        eo_labels,
        aes("Speed", "Frequency", label="label"),
        color=INK_MUTED,
        size=3.5,
        fontstyle="italic",
        fontweight="bold",
        inherit_aes=False,
        show_legend=False,
    )
    # Unified color/linetype scales with consolidated EO legend entry
    + scale_color_manual(values=color_map, breaks=breaks, labels=labels)
    + scale_linetype_manual(values=ltype_map, breaks=breaks, labels=labels)
    + guides(color=guide_legend(override_aes={"size": [1.5] * 5 + [0.8]}), linetype=guide_legend())
    + scale_x_continuous(breaks=range(0, 7000, 1000))
    + scale_y_continuous(breaks=range(0, 111, 10))
    + coord_cartesian(xlim=(0, 6200), ylim=(0, 108))
    + labs(x="Rotational Speed (RPM)", y="Natural Frequency (Hz)", title=title)
    + theme_minimal()
    + theme(
        figure_size=(8, 4.5),
        plot_background=element_rect(fill=PAGE_BG, color=PAGE_BG),
        panel_background=element_rect(fill=PAGE_BG),
        panel_grid_major=element_line(color=INK, size=0.3, alpha=0.12),
        panel_grid_minor=element_blank(),
        panel_border=element_blank(),
        axis_line=element_line(color=INK_SOFT, size=0.3),
        plot_title=element_text(size=12, ha="center", face="bold", color=INK),
        axis_title=element_text(size=10, color=INK),
        axis_text=element_text(size=8, color=INK_SOFT),
        legend_text=element_text(size=8, color=INK_SOFT),
        legend_title=element_blank(),
        legend_background=element_rect(fill=ELEVATED_BG, color=INK_SOFT, size=0.3),
        legend_key_width=30,
        legend_key_height=15,
        legend_position="bottom",
        legend_direction="horizontal",
    )
)

# Annotate most operationally significant critical speed (1x / 1st Bending)
if annot_speed is not None:
    plot = (
        plot
        + annotate(
            "segment",
            x=annot_speed,
            xend=annot_speed,
            y=0,
            yend=annot_freq,
            color=CRITICAL_COLOR,
            linetype="dotted",
            size=0.6,
            alpha=0.7,
        )
        + annotate(
            "text",
            x=annot_speed + 180,
            y=annot_freq + 5,
            label=f"Critical: {int(round(annot_speed))} RPM",
            color=CRITICAL_COLOR,
            size=3.5,
            ha="left",
            fontstyle="italic",
        )
    )

# Operating range label
plot = plot + annotate(
    "text", x=3250, y=104, label="Operating Range", color=BAND_COLOR, size=3.5, alpha=0.8, fontweight="bold"
)

plot.save(f"plot-{THEME}.png", dpi=400, width=8, height=4.5, units="in", verbose=False)
Runnable source as JSON, for any HTTP client: https://api.anyplot.ai/specs/campbell-basic/plotnine/code. Any spec id and library id listed in llms-full.txt fit the same URL shape; every URL below is complete and callable.
{
  "spec_id": "campbell-basic",
  "language": "python",
  "library": "plotnine",
  "page": "https://anyplot.ai/campbell-basic/python/plotnine",
  "hub": "https://anyplot.ai/campbell-basic",
  "code_json": "https://api.anyplot.ai/specs/campbell-basic/plotnine/code",
  "spec_json": "https://api.anyplot.ai/specs/campbell-basic",
  "render_light_png": "https://storage.googleapis.com/anyplot-images/plots/campbell-basic/python/plotnine/plot-light.png",
  "render_dark_png": "https://storage.googleapis.com/anyplot-images/plots/campbell-basic/python/plotnine/plot-dark.png",
  "quality_score": 86.0,
  "license": "MIT",
  "guide": "https://anyplot.ai/llms.txt"
}
Part of Campbell Diagram on anyplot.ai.