The same plot in 14 other libraries — JavaScript: Chart.js, D3.js, Apache ECharts, MUI X Charts; Python: Altair, Bokeh, lets-plot, Matplotlib, Plotly, plotnine, Pygal, Seaborn; R: ggplot2; Julia: Makie.jl. Compare all 15 side by side: Campbell Diagram in Python, R, Julia and JavaScript.
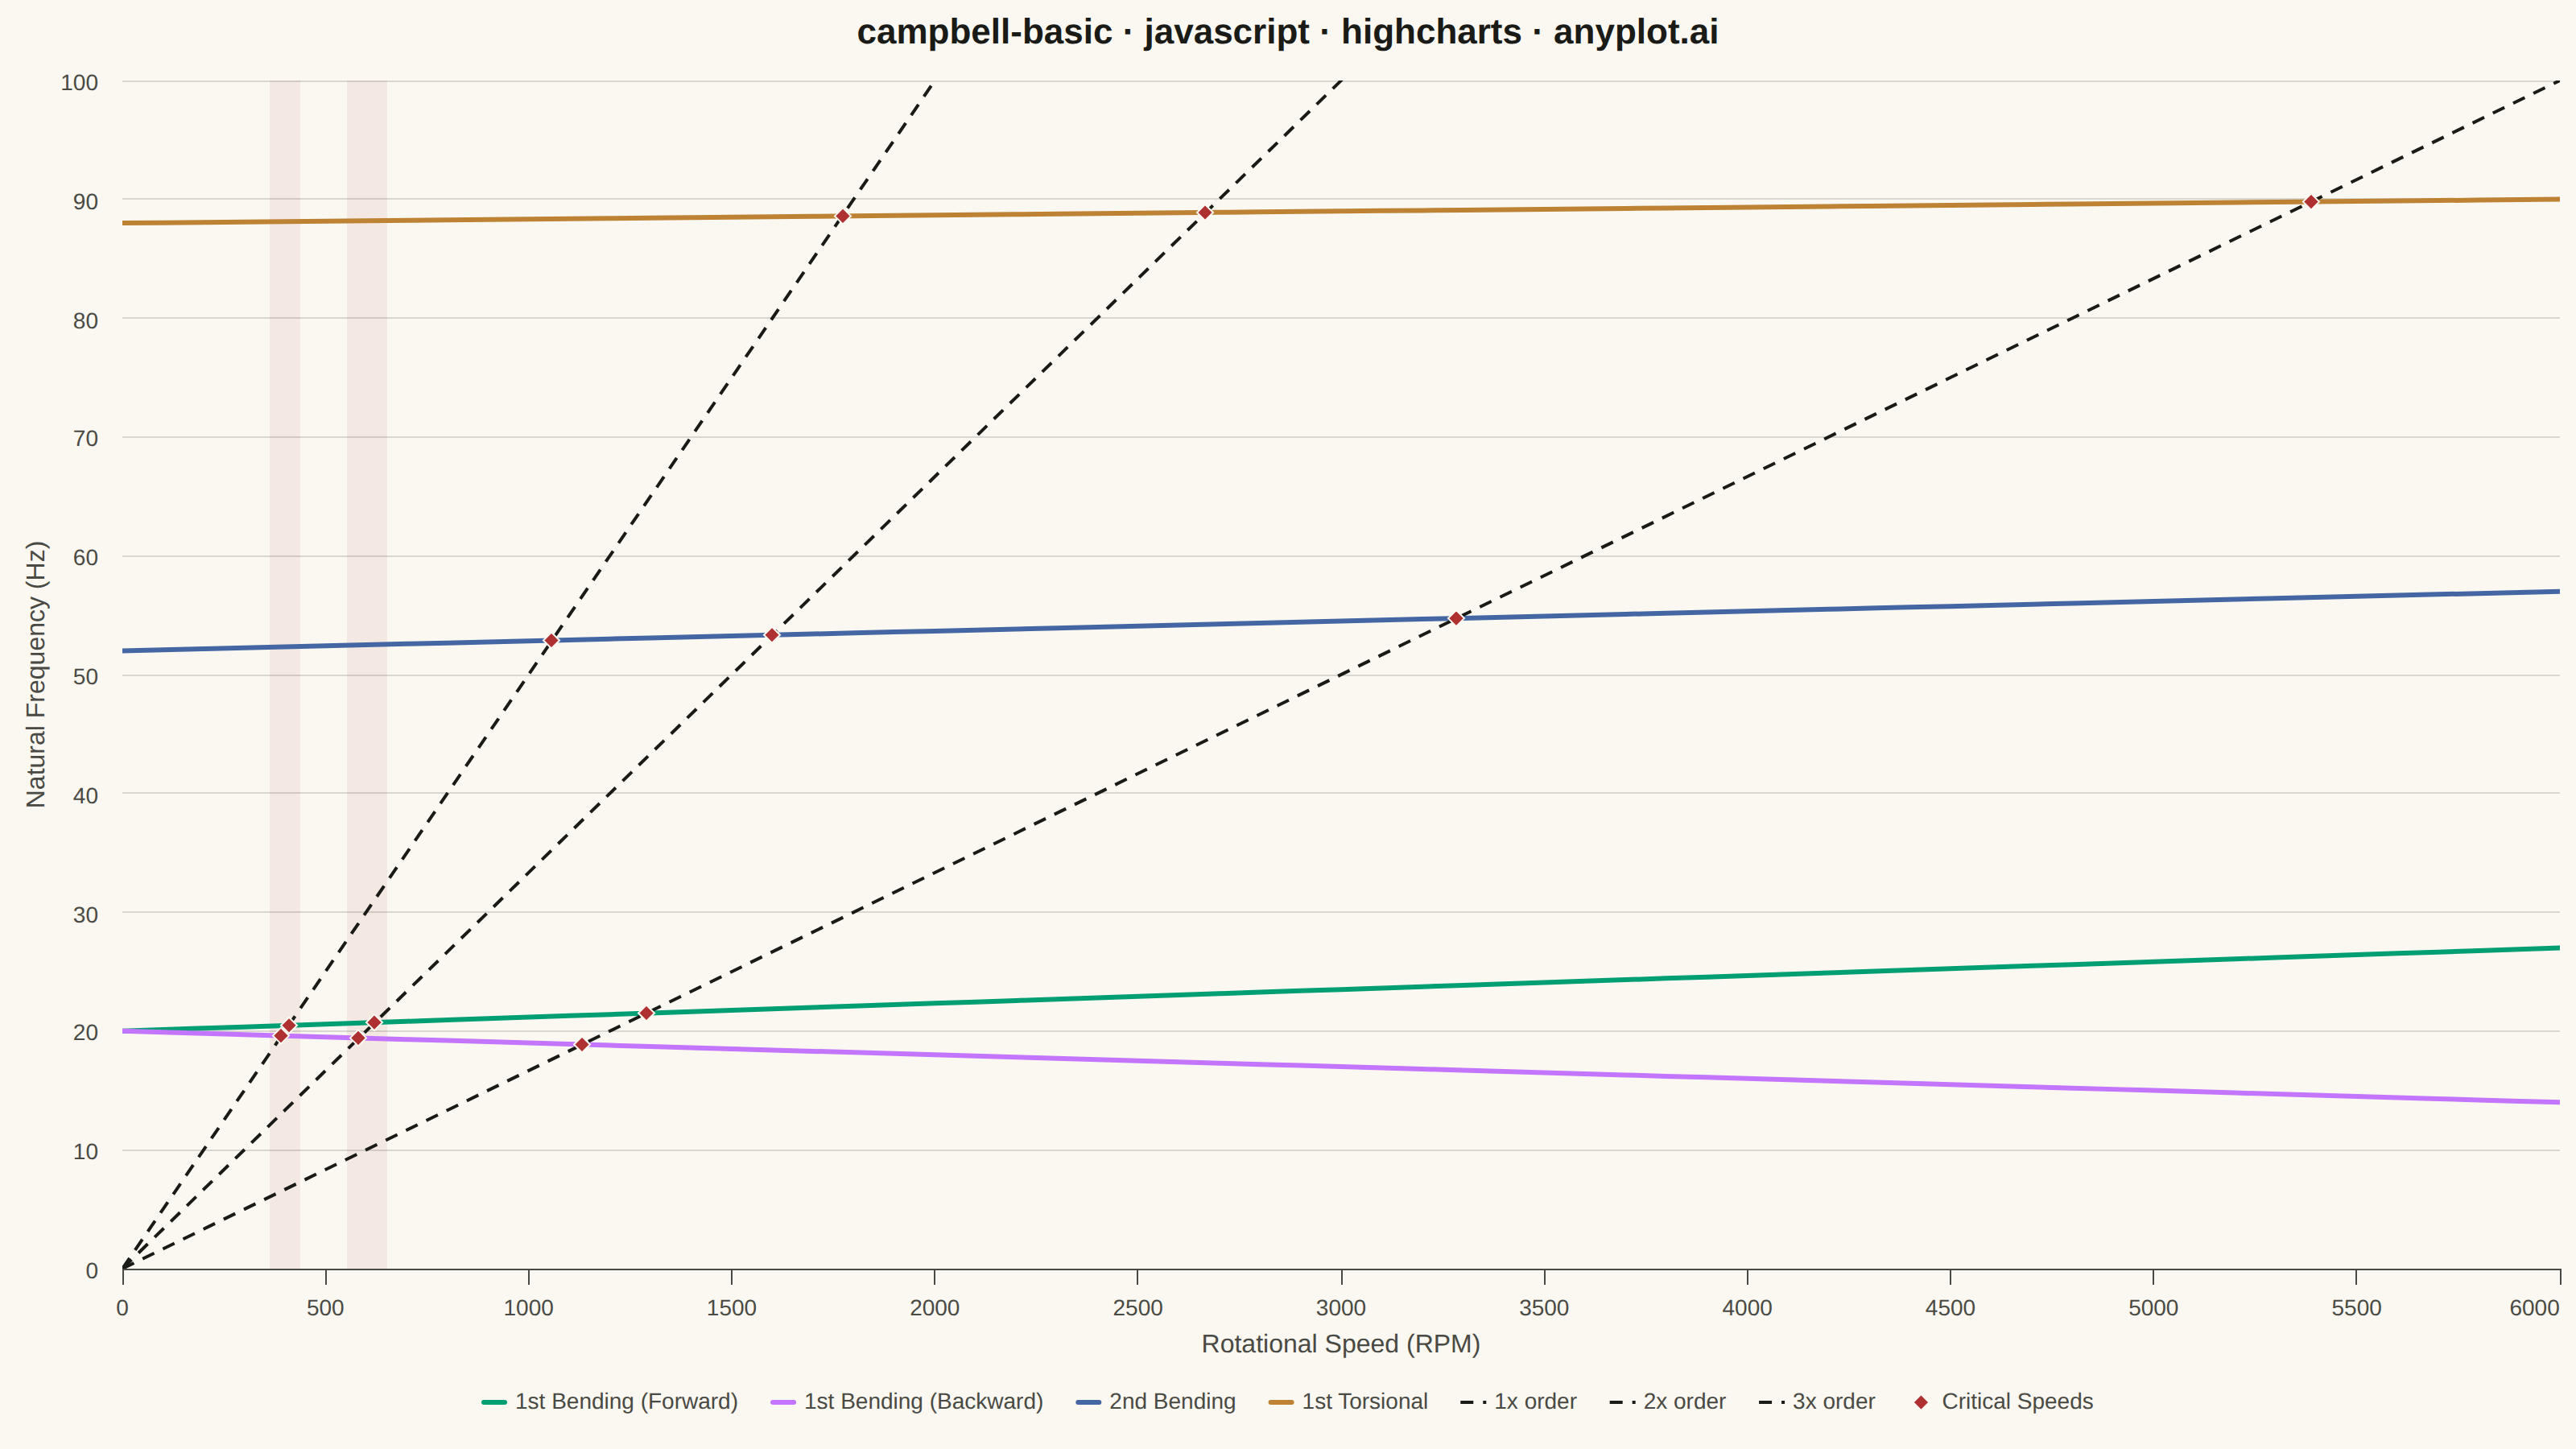
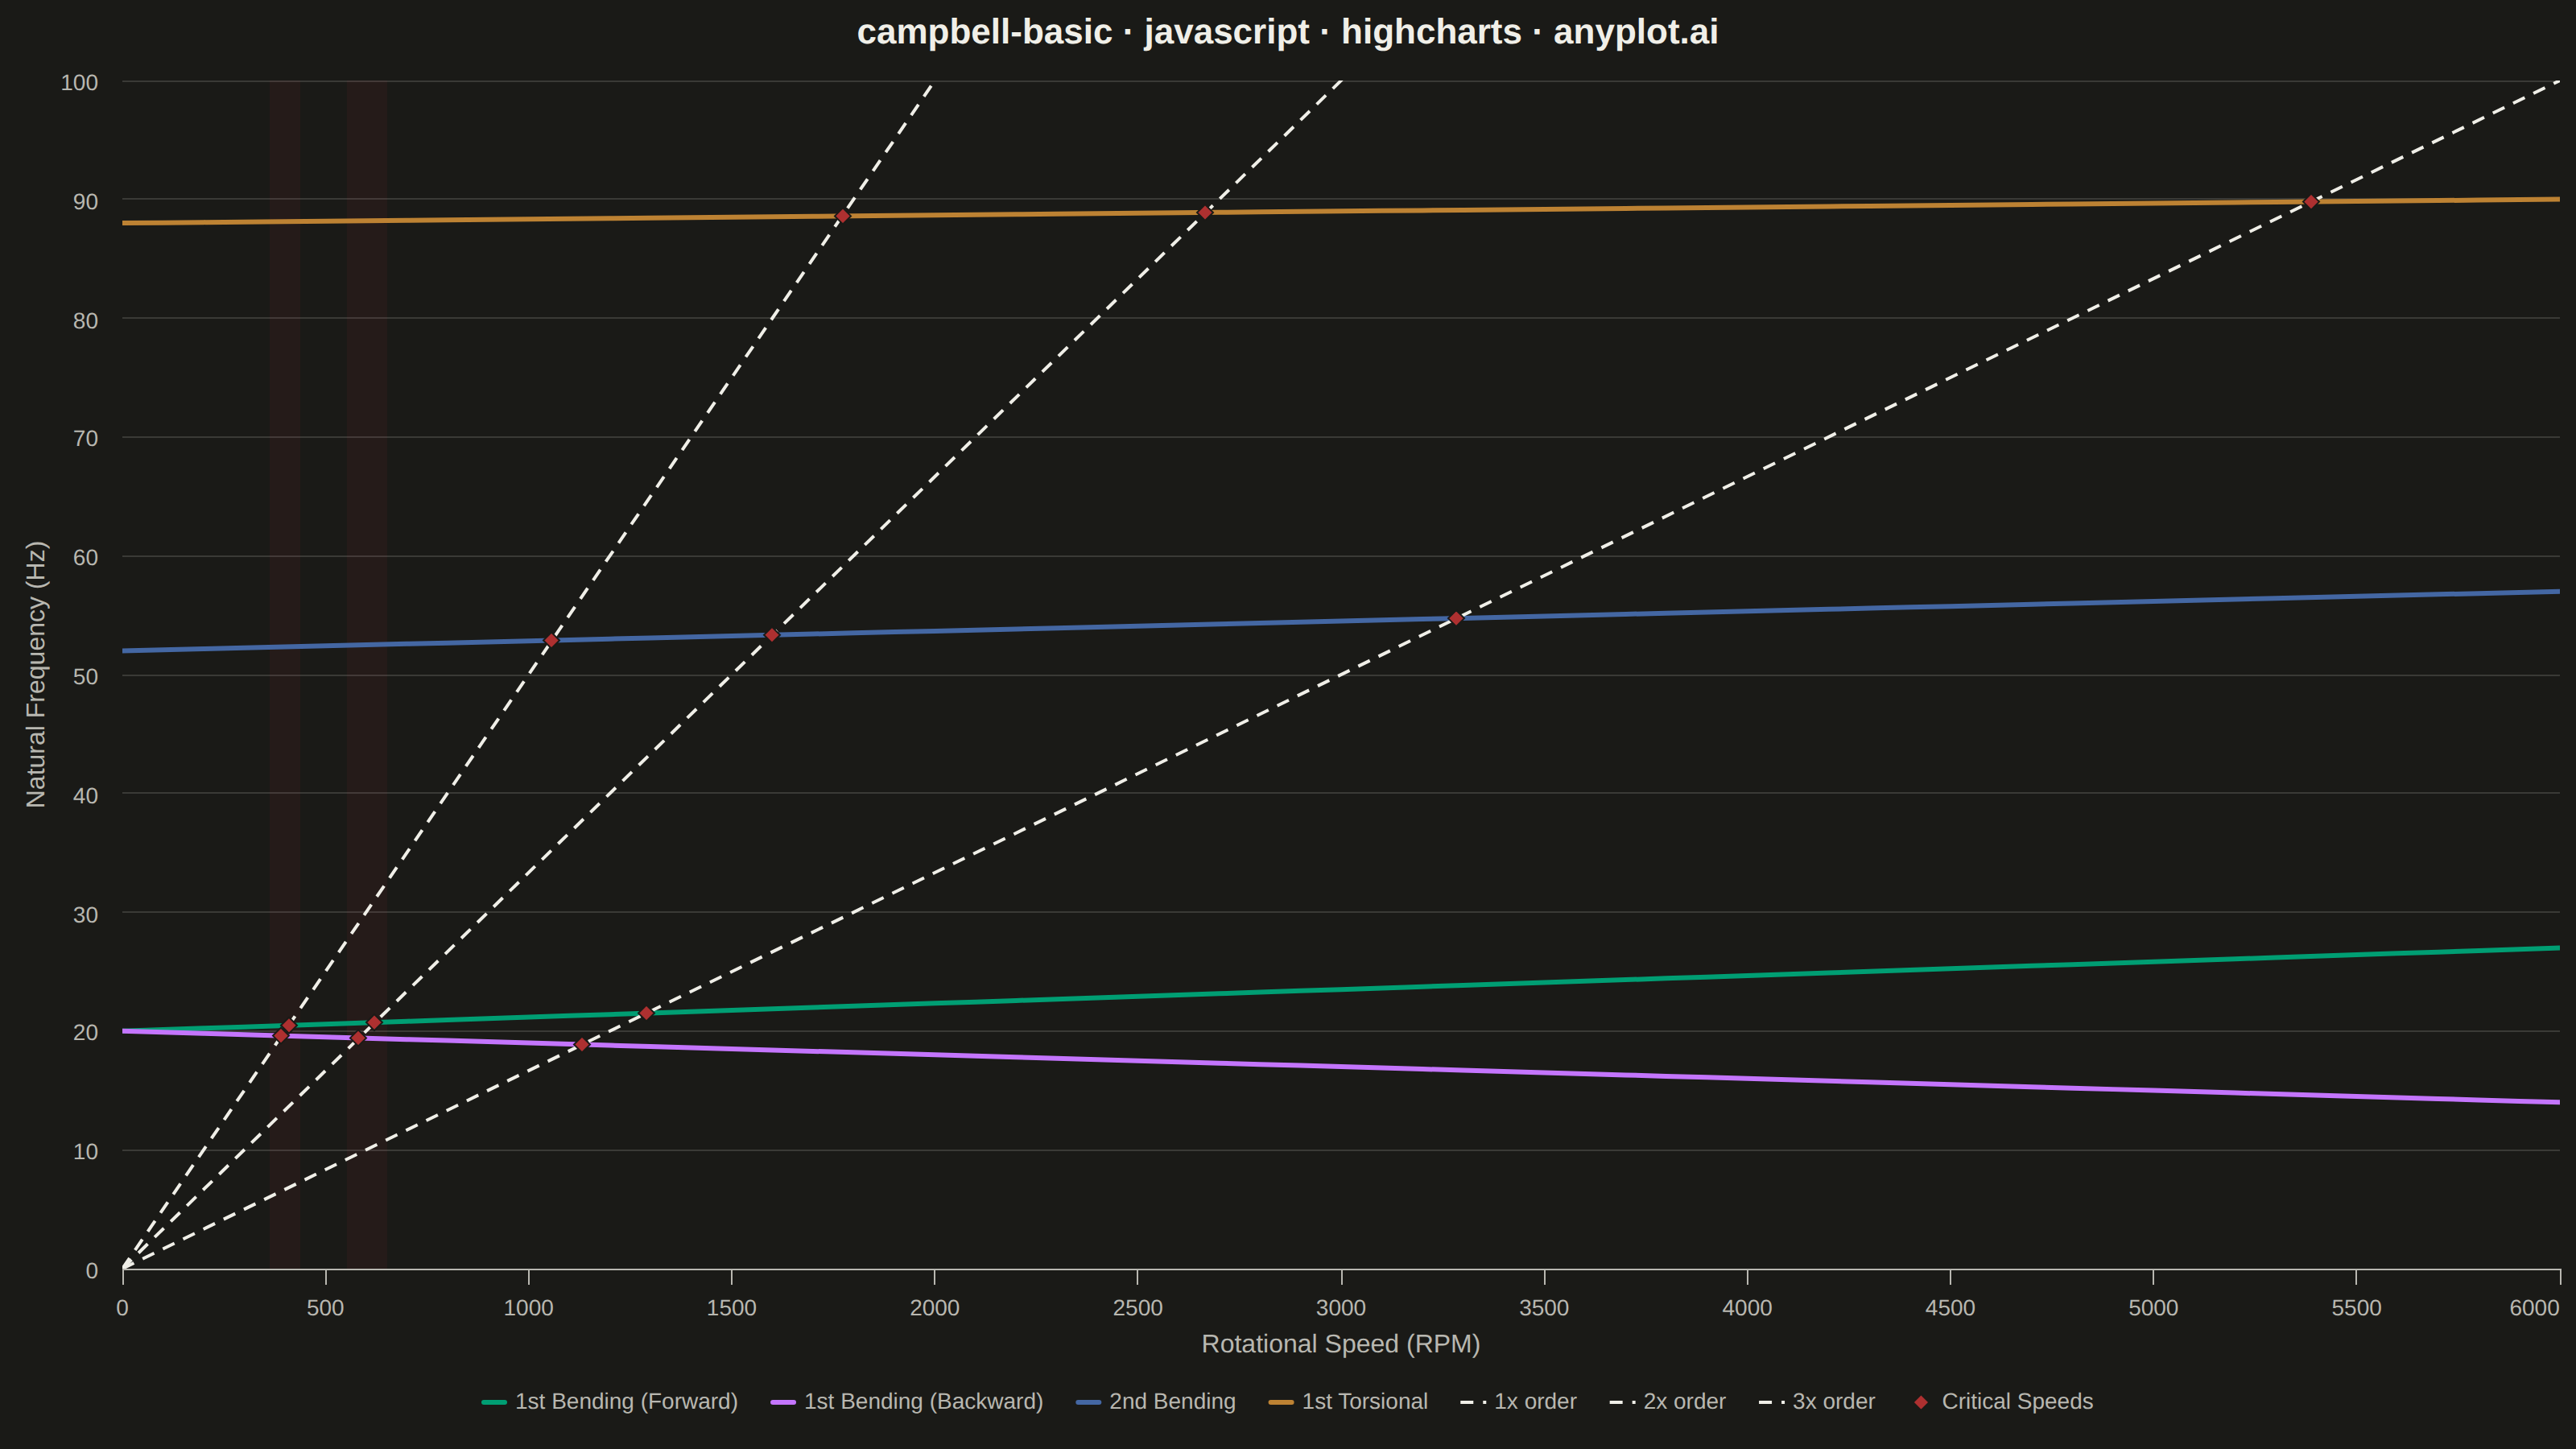
A Campbell Diagram (also called an interference diagram) plots natural frequencies against rotational speed to identify critical speeds and resonance conditions in rotating machinery. It overlays engine order excitation lines (diagonal lines from the origin) on top of natural frequency curves, with intersections marking critical speeds where resonance may occur. This visualization is essential for ensuring safe operating ranges in turbomachinery, automotive powertrains, and other rotating equipment.
// anyplot.ai
// campbell-basic: Campbell Diagram
// Library: highcharts 12.6.0 | JavaScript 22.23.2
// Quality: 89/100 | Created: 2026-08-24

const t = window.ANYPLOT_TOKENS;

// --- Data (in-memory, deterministic) ----------------------------------------
// Natural frequency modes: base Hz at zero speed, Hz at max speed (linear
// gyroscopic trend — forward whirl stiffens, backward whirl softens, higher
// modes drift only slightly).
const MAX_SPEED = 6000; // RPM
const POINTS = 61; // 100 RPM steps

const modes = [
  { name: "1st Bending (Forward)", baseHz: 20, endHz: 27 },
  { name: "1st Bending (Backward)", baseHz: 20, endHz: 14 },
  { name: "2nd Bending", baseHz: 52, endHz: 57 },
  { name: "1st Torsional", baseHz: 88, endHz: 90 },
];

const modeFreq = (mode, speed) =>
  mode.baseHz + (mode.endHz - mode.baseHz) * (speed / MAX_SPEED);

const modeSeries = modes.map((mode) => ({
  name: mode.name,
  type: "line",
  data: Array.from({ length: POINTS }, (_, i) => {
    const speed = (i * MAX_SPEED) / (POINTS - 1);
    return [speed, modeFreq(mode, speed)];
  }),
  lineWidth: 3,
  marker: { enabled: false },
}));

// Engine order excitation lines: frequency = order * speed / 60 (RPM -> Hz)
const orders = [1, 2, 3];
const orderFreq = (order, speed) => (order * speed) / 60;

const orderSeries = orders.map((order) => ({
  name: `${order}x order`,
  type: "line",
  data: [
    [0, 0],
    [MAX_SPEED, orderFreq(order, MAX_SPEED)],
  ],
  color: t.ink,
  dashStyle: "Dash",
  lineWidth: 2,
  marker: { enabled: false },
  enableMouseTracking: false,
}));

// Critical speeds: where an engine order line crosses a natural frequency
// curve. Found numerically via sign change of (orderFreq - modeFreq) across
// a fine RPM sweep, then refined with linear interpolation.
const criticalSpeeds = [];
const SCAN_STEP = 5; // RPM

orders.forEach((order) => {
  modes.forEach((mode) => {
    let prevSpeed = 0;
    let prevDiff = orderFreq(order, 0) - modeFreq(mode, 0);
    for (let speed = SCAN_STEP; speed <= MAX_SPEED; speed += SCAN_STEP) {
      const diff = orderFreq(order, speed) - modeFreq(mode, speed);
      if (prevDiff === 0 || prevDiff * diff < 0) {
        const crossSpeed =
          prevSpeed + ((speed - prevSpeed) * -prevDiff) / (diff - prevDiff);
        criticalSpeeds.push([crossSpeed, orderFreq(order, crossSpeed)]);
      }
      prevSpeed = speed;
      prevDiff = diff;
    }
  });
});

const criticalSeries = {
  name: "Critical Speeds",
  type: "scatter",
  data: criticalSpeeds,
  color: t.palette[4], // matte red — semantic anchor for critical/error
  marker: {
    enabled: true,
    symbol: "diamond",
    radius: 5,
    lineColor: t.pageBg,
    lineWidth: 1,
  },
};

// Group crossings that sit close together in both RPM and Hz (visually
// overlapping diamonds) into a shaded "critical zone" — a distinctive
// Highcharts plotBands touch that also satisfies the spec's optional
// zone-highlighting suggestion.
const sortedCritical = [...criticalSpeeds].sort((a, b) => a[0] - b[0]);
const ZONE_RPM_TOL = 60;
const ZONE_HZ_TOL = 3;
const clusters = [];
sortedCritical.forEach(([speed, freq]) => {
  const last = clusters[clusters.length - 1];
  const [lastSpeed, lastFreq] = last ? last[last.length - 1] : [];
  if (last && speed - lastSpeed < ZONE_RPM_TOL && Math.abs(freq - lastFreq) < ZONE_HZ_TOL) {
    last.push([speed, freq]);
  } else {
    clusters.push([[speed, freq]]);
  }
});

const ZONE_MARGIN = 30; // RPM padding around a cluster's plot band
const criticalZones = clusters
  .filter((cluster) => cluster.length > 1)
  .map((cluster) => {
    const speeds = cluster.map(([speed]) => speed);
    return {
      from: Math.min(...speeds) - ZONE_MARGIN,
      to: Math.max(...speeds) + ZONE_MARGIN,
      color: "rgba(174, 48, 48, 0.08)", // matte red at low alpha
      zIndex: 0,
    };
  });

// --- Chart -------------------------------------------------------------------
const FONT_FAMILY = '"Helvetica Neue", Arial, sans-serif';

Highcharts.chart("container", {
  chart: {
    type: "line",
    backgroundColor: "transparent",
    animation: false,
    style: { fontFamily: FONT_FAMILY },
  },
  credits: { enabled: false },
  colors: t.palette,
  title: {
    text: "campbell-basic · javascript · highcharts · anyplot.ai",
    style: { color: t.ink, fontSize: "22px", fontWeight: "600" },
  },
  xAxis: {
    title: {
      text: "Rotational Speed (RPM)",
      style: { color: t.inkSoft, fontSize: "16px" },
    },
    min: 0,
    max: MAX_SPEED,
    lineColor: t.inkSoft,
    tickColor: t.inkSoft,
    gridLineColor: t.grid,
    labels: { style: { color: t.inkSoft, fontSize: "14px" } },
    plotBands: criticalZones,
  },
  yAxis: {
    title: {
      text: "Natural Frequency (Hz)",
      style: { color: t.inkSoft, fontSize: "16px" },
    },
    min: 0,
    max: 100,
    gridLineColor: t.grid,
    labels: { style: { color: t.inkSoft, fontSize: "14px" } },
  },
  legend: {
    itemStyle: { color: t.inkSoft, fontSize: "14px" },
    itemHoverStyle: { color: t.ink },
  },
  tooltip: { enabled: false },
  plotOptions: {
    series: { animation: false },
  },
  series: [...modeSeries, ...orderSeries, criticalSeries],
});
Runnable source as JSON, for any HTTP client: https://api.anyplot.ai/specs/campbell-basic/highcharts/code. Any spec id and library id listed in llms-full.txt fit the same URL shape; every URL below is complete and callable.
{
  "spec_id": "campbell-basic",
  "language": "javascript",
  "library": "highcharts",
  "page": "https://anyplot.ai/campbell-basic/javascript/highcharts",
  "hub": "https://anyplot.ai/campbell-basic",
  "code_json": "https://api.anyplot.ai/specs/campbell-basic/highcharts/code",
  "spec_json": "https://api.anyplot.ai/specs/campbell-basic",
  "render_light_png": "https://storage.googleapis.com/anyplot-images/plots/campbell-basic/javascript/highcharts/plot-light.png",
  "render_dark_png": "https://storage.googleapis.com/anyplot-images/plots/campbell-basic/javascript/highcharts/plot-dark.png",
  "interactive_light_html": "https://storage.googleapis.com/anyplot-images/plots/campbell-basic/javascript/highcharts/plot-light.html",
  "interactive_dark_html": "https://storage.googleapis.com/anyplot-images/plots/campbell-basic/javascript/highcharts/plot-dark.html",
  "quality_score": 89.0,
  "license": "MIT",
  "guide": "https://anyplot.ai/llms.txt"
}
Part of Campbell Diagram on anyplot.ai.