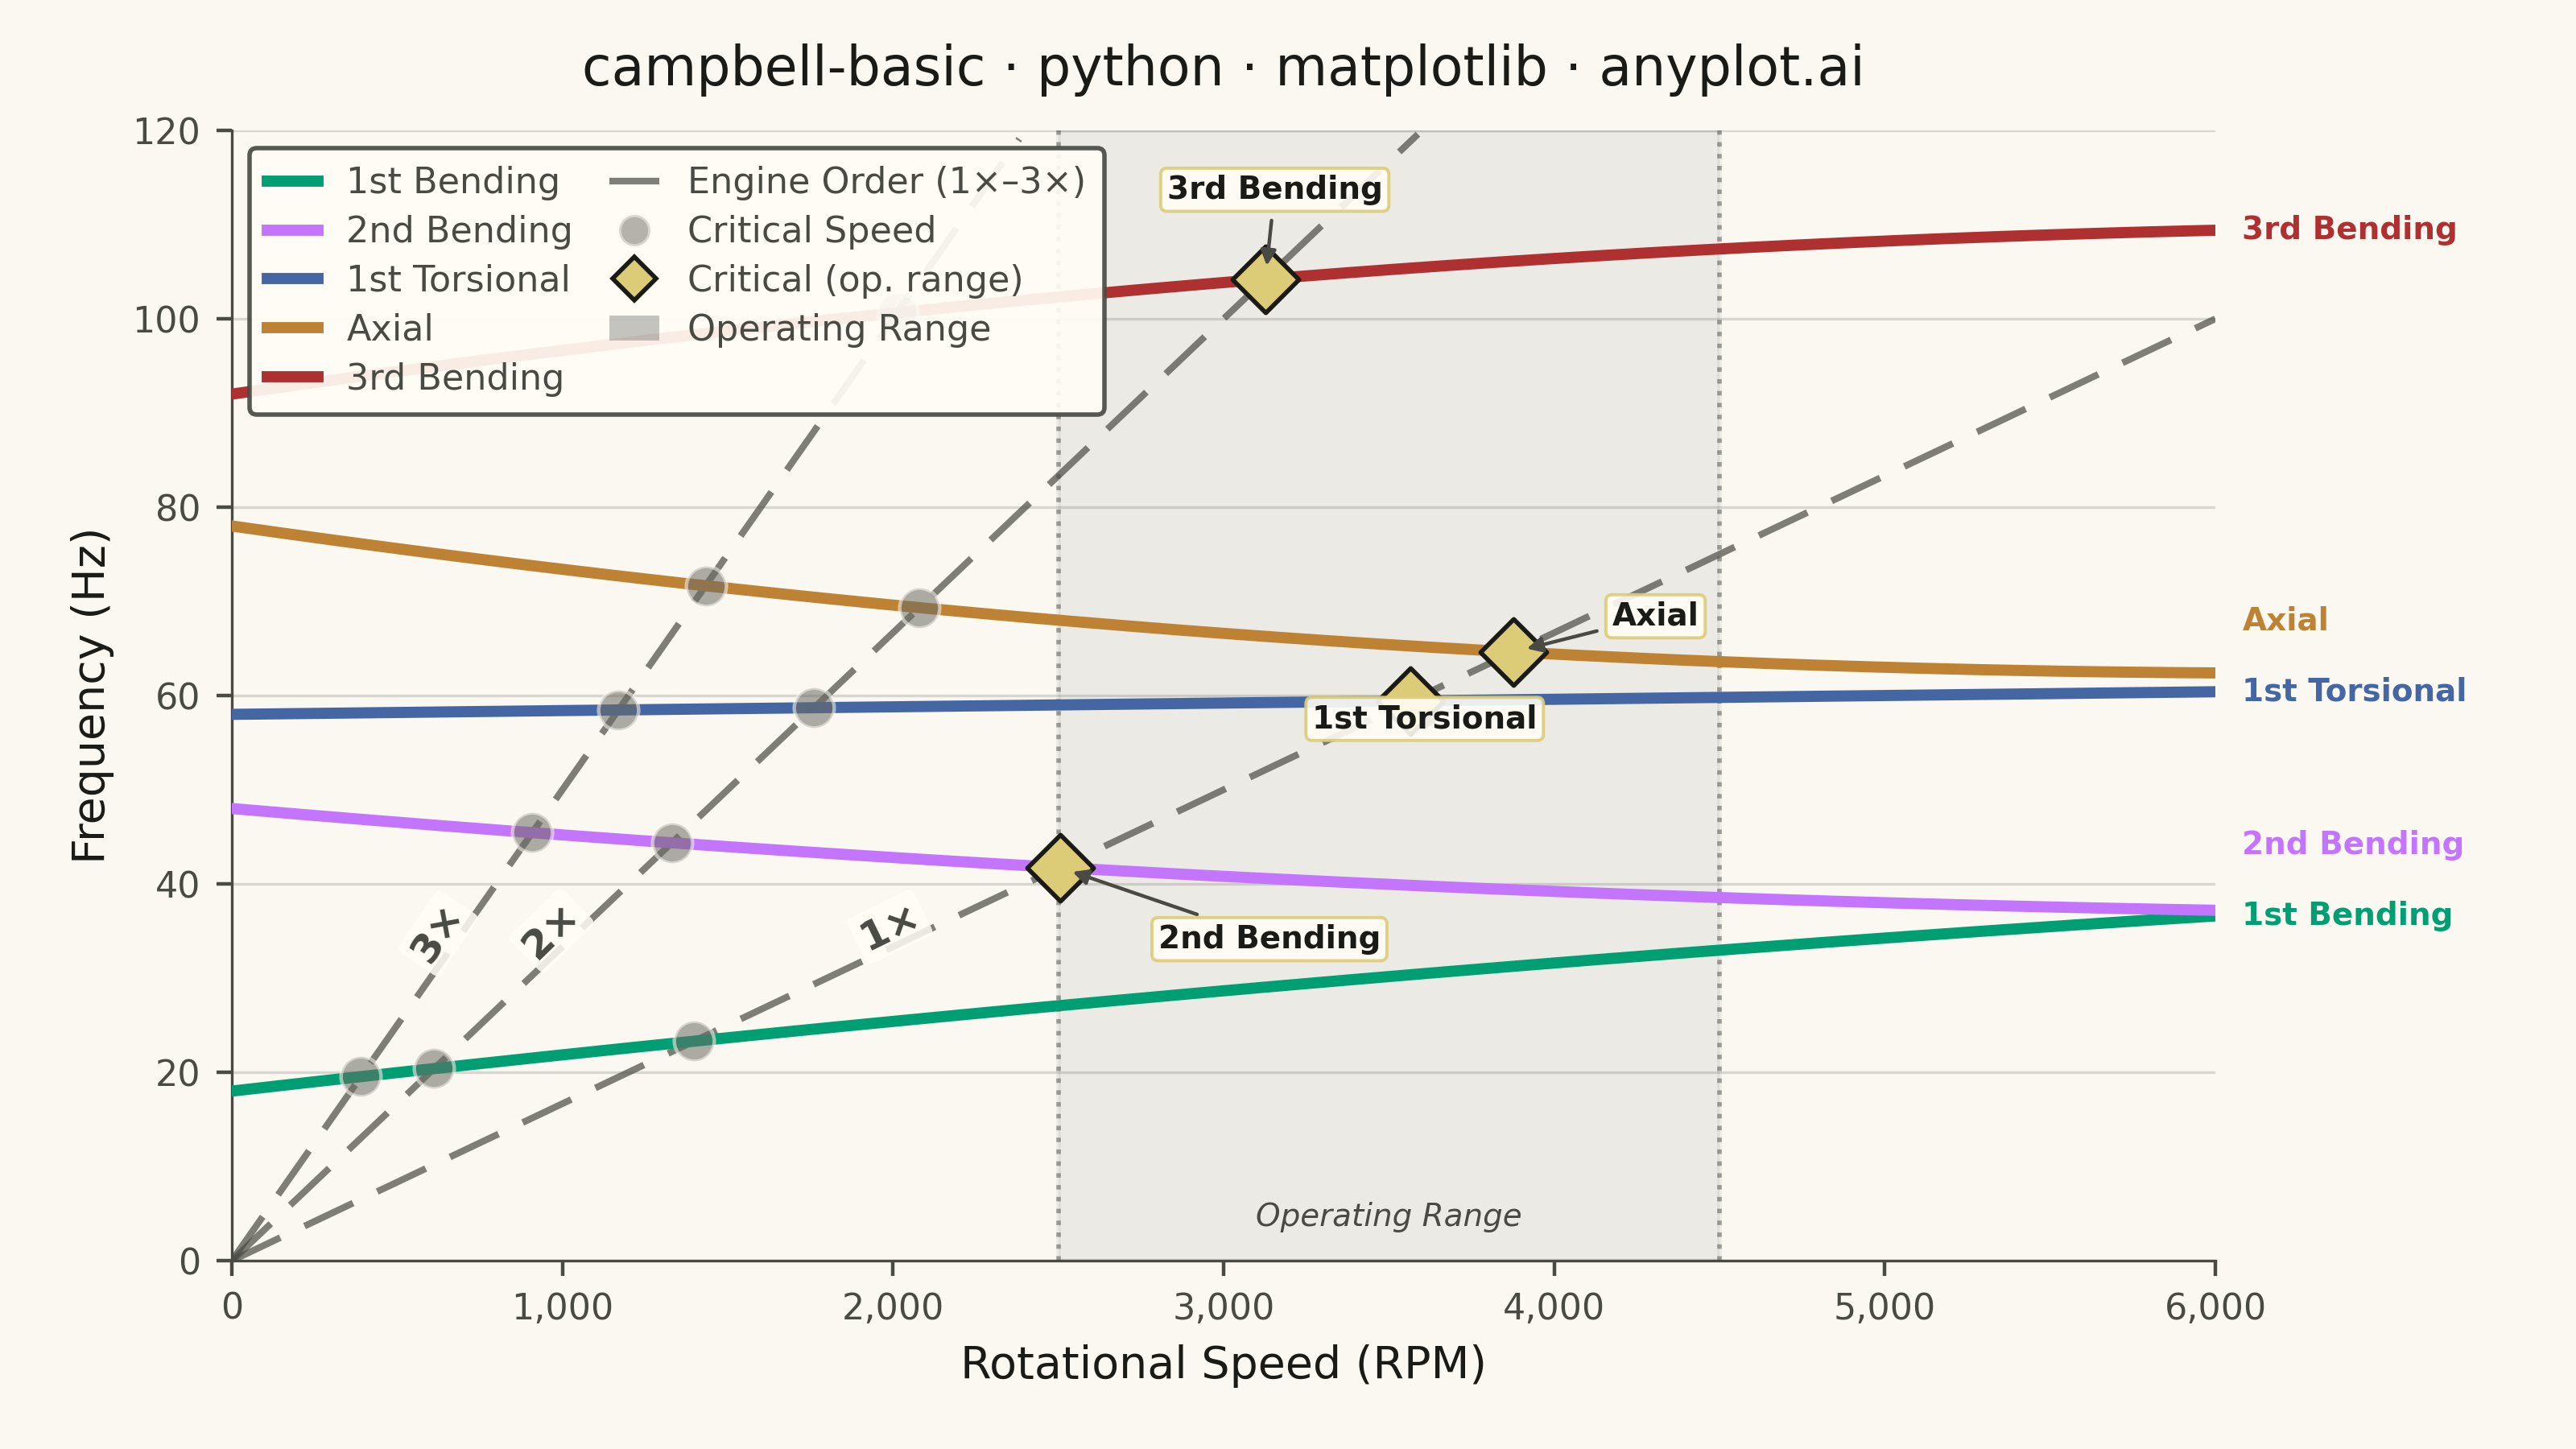
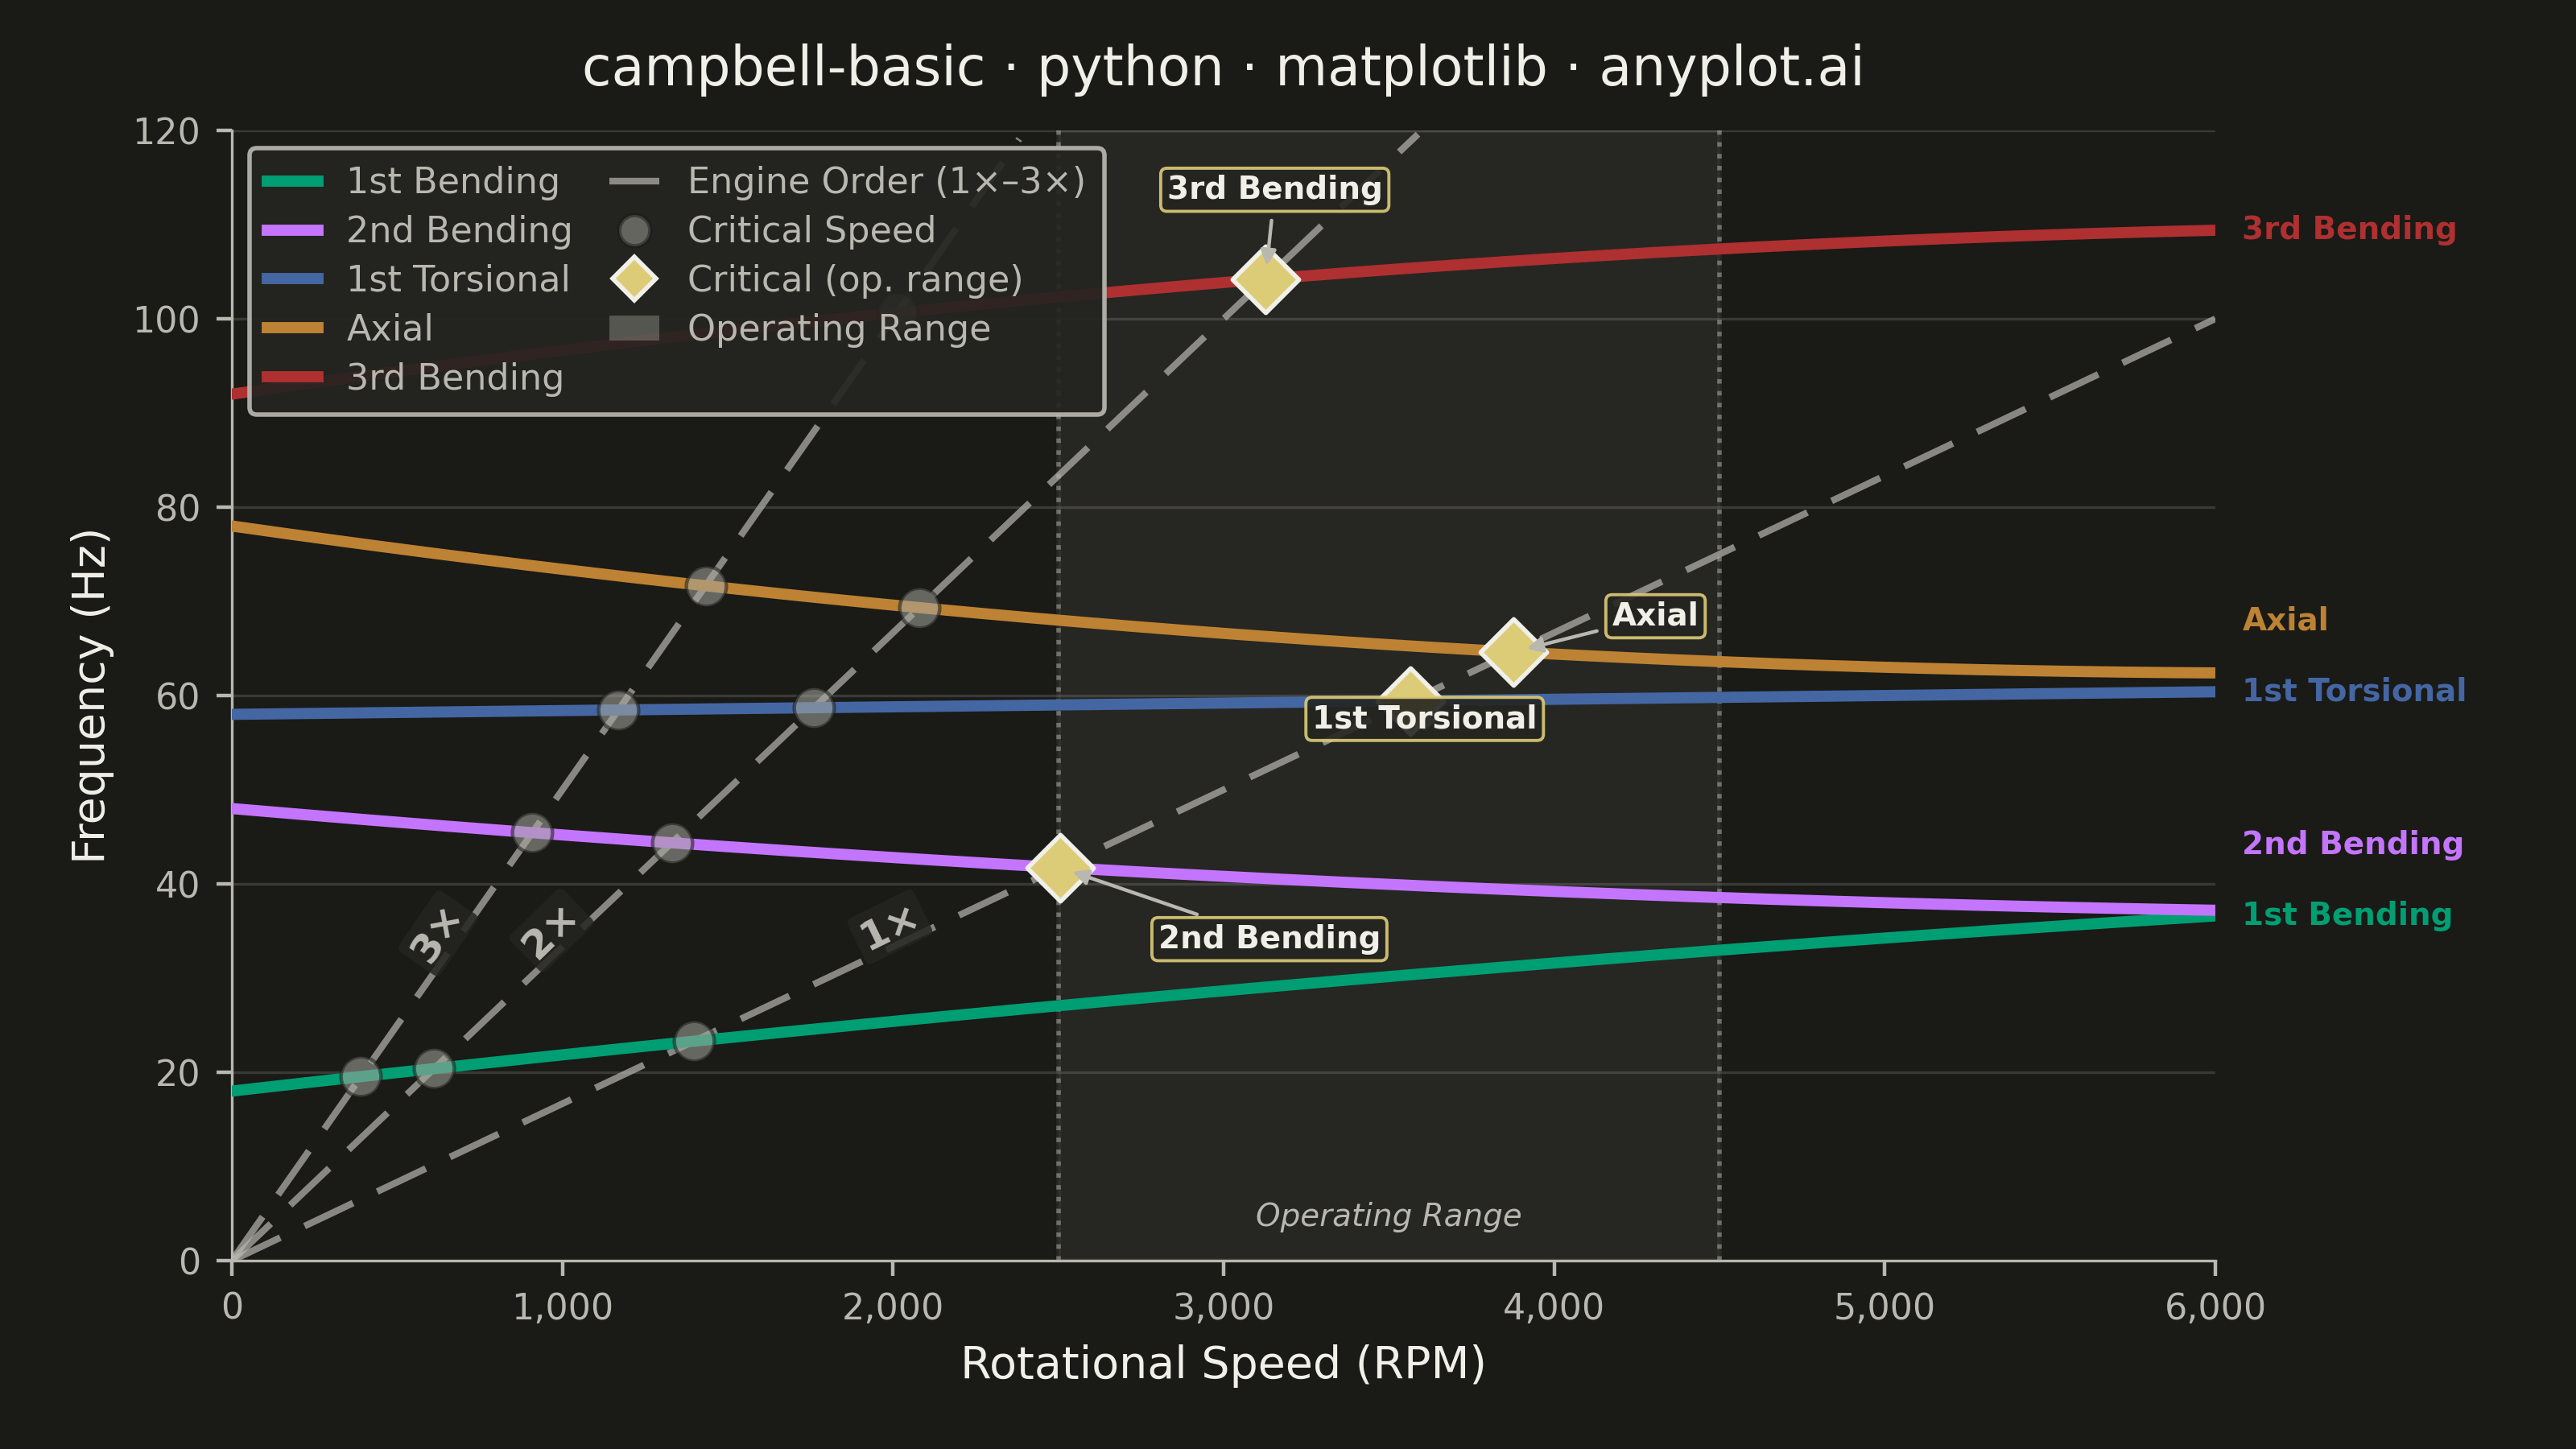
A Campbell Diagram (also called an interference diagram) plots natural frequencies against rotational speed to identify critical speeds and resonance conditions in rotating machinery. It overlays engine order excitation lines (diagonal lines from the origin) on top of natural frequency curves, with intersections marking critical speeds where resonance may occur. This visualization is essential for ensuring safe operating ranges in turbomachinery, automotive powertrains, and other rotating equipment.
""" anyplot.ai
campbell-basic: Campbell Diagram
Library: matplotlib 3.10.9 | Python 3.13.13
Quality: 90/100 | Updated: 2026-05-28
"""

import os

import matplotlib.pyplot as plt
import numpy as np
from matplotlib.lines import Line2D
from matplotlib.patches import Patch
from matplotlib.ticker import FuncFormatter


# Theme
THEME = os.getenv("ANYPLOT_THEME", "light")
PAGE_BG = "#FAF8F1" if THEME == "light" else "#1A1A17"
ELEVATED_BG = "#FFFDF6" if THEME == "light" else "#242420"
INK = "#1A1A17" if THEME == "light" else "#F0EFE8"
INK_SOFT = "#4A4A44" if THEME == "light" else "#B8B7B0"
INK_MUTED = "#6B6A63" if THEME == "light" else "#A8A79F"
ANYPLOT_AMBER = "#DDCC77"  # warning / caution — semantic anchor for critical condition

# Imprint palette positions 1–5 for mode curves
mode_colors = ["#009E73", "#C475FD", "#4467A3", "#BD8233", "#AE3030"]

# Data
speed_rpm = np.linspace(0, 6000, 200)
speed_hz = speed_rpm / 60

# Natural frequency modes (Hz) — realistic gyroscopic effects
mode_1_bending = 18 + 0.004 * speed_rpm - 1.5e-7 * speed_rpm**2
mode_2_bending = 48 - 0.003 * speed_rpm + 2.0e-7 * speed_rpm**2
mode_1_torsional = 58 + 0.0004 * speed_rpm
mode_axial = 78 - 0.005 * speed_rpm + 4.0e-7 * speed_rpm**2
mode_3_bending = 92 + 0.005 * speed_rpm - 3.5e-7 * speed_rpm**2

modes = [mode_1_bending, mode_2_bending, mode_1_torsional, mode_axial, mode_3_bending]
mode_labels = ["1st Bending", "2nd Bending", "1st Torsional", "Axial", "3rd Bending"]

engine_orders = [1, 2, 3]
eo_freq = {eo: eo * speed_hz for eo in engine_orders}

# Find critical speed intersections via linear interpolation
op_min, op_max = 2500, 4500
critical_speeds, critical_freqs, critical_mlabels = [], [], []
for mode, mlabel in zip(modes, mode_labels, strict=True):
    for eo in engine_orders:
        diff = mode - eo * speed_hz
        for idx in np.where(np.diff(np.sign(diff)))[0]:
            t = abs(diff[idx]) / (abs(diff[idx]) + abs(diff[idx + 1]))
            rpm = speed_rpm[idx] + t * (speed_rpm[idx + 1] - speed_rpm[idx])
            freq = mode[idx] + t * (mode[idx + 1] - mode[idx])
            if 100 < rpm < 5900:
                critical_speeds.append(rpm)
                critical_freqs.append(freq)
                critical_mlabels.append(mlabel)

# Plot
fig, ax = plt.subplots(figsize=(8, 4.5), dpi=400, facecolor=PAGE_BG)
ax.set_facecolor(PAGE_BG)
y_max = 120

# Operating range shading
ax.axvspan(op_min, op_max, alpha=0.06, color=INK, zorder=0)
ax.axvline(op_min, color=INK_SOFT, linewidth=1.0, linestyle=":", alpha=0.5, zorder=1)
ax.axvline(op_max, color=INK_SOFT, linewidth=1.0, linestyle=":", alpha=0.5, zorder=1)
ax.text(
    (op_min + op_max) / 2,
    3,
    "Operating Range",
    fontsize=7,
    color=INK_SOFT,
    ha="center",
    va="bottom",
    fontstyle="italic",
)

# Mode curves
for mode, color in zip(modes, mode_colors, strict=True):
    ax.plot(speed_rpm, mode, linewidth=2.5, color=color, zorder=3, solid_capstyle="round")

# End-of-line labels — de-collide vertically (increased min_gap for cleaner separation)
end_vals = [(mode[-1], label, color) for mode, label, color in zip(modes, mode_labels, mode_colors, strict=True)]
end_vals.sort(key=lambda x: x[0])
min_gap = 7.5
positions = [v[0] for v in end_vals]
for i in range(1, len(positions)):
    if positions[i] - positions[i - 1] < min_gap:
        positions[i] = positions[i - 1] + min_gap
for y_pos, (_, label, color) in zip(positions, end_vals, strict=True):
    ax.annotate(
        label,
        xy=(speed_rpm[-1], y_pos),
        xytext=(6, 0),
        textcoords="offset points",
        fontsize=7,
        color=color,
        fontweight="bold",
        va="center",
        zorder=4,
        annotation_clip=False,
    )

# Engine order lines with rotated labels
# slope in display inches: (eo/60 Hz/RPM) × (axes_h_in / y_range) / (axes_w_in / x_range)
ax_h_frac = 0.78  # top(0.91) - bottom(0.13)
ax_w_frac = 0.75  # right(0.84) - left(0.09)
ax_h_in = 4.5 * ax_h_frac
ax_w_in = 8.0 * ax_w_frac

for eo in engine_orders:
    eo_line = eo_freq[eo]
    visible = eo_line <= y_max
    ax.plot(
        speed_rpm[visible], eo_line[visible], linewidth=1.5, color=INK_SOFT, linestyle=(0, (8, 4)), alpha=0.7, zorder=2
    )
    target_freq = y_max * 0.28
    target_rpm = target_freq * 60 / eo
    if target_rpm < 5800:
        slope_display = (eo / 60) * (ax_h_in / y_max) / (ax_w_in / 6000)
        angle_deg = np.degrees(np.arctan(slope_display))
        ax.annotate(
            f"{eo}×",
            xy=(target_rpm, target_freq),
            fontsize=9,
            color=INK_SOFT,
            fontweight="bold",
            ha="center",
            va="bottom",
            rotation=angle_deg,
            rotation_mode="anchor",
            zorder=4,
            bbox={"boxstyle": "round,pad=0.15", "facecolor": ELEVATED_BG, "edgecolor": "none", "alpha": 0.85},
        )

# Critical speed markers
cs_arr, cf_arr = np.array(critical_speeds), np.array(critical_freqs)
in_op = (cs_arr >= op_min) & (cs_arr <= op_max)

if np.any(~in_op):
    ax.scatter(
        cs_arr[~in_op], cf_arr[~in_op], s=80, color=INK_MUTED, edgecolors=PAGE_BG, linewidth=0.8, zorder=5, alpha=0.55
    )

if np.any(in_op):
    ax.scatter(
        cs_arr[in_op], cf_arr[in_op], s=110, color=ANYPLOT_AMBER, edgecolors=INK, linewidth=1.0, zorder=6, marker="D"
    )
    op_s = cs_arr[in_op]
    op_f = cf_arr[in_op]
    op_m = np.array(critical_mlabels)[in_op]
    order_idx = np.argsort(op_f)
    n = len(order_idx)
    for rank, si in enumerate(order_idx):
        sign = 1 if rank % 2 == 0 else -1
        dx = sign * 22
        dy = -18 + rank * (36 / max(n - 1, 1))
        ax.annotate(
            op_m[si],
            xy=(op_s[si], op_f[si]),
            xytext=(dx, dy),
            textcoords="offset points",
            fontsize=7,
            color=INK,
            fontweight="bold",
            arrowprops={"arrowstyle": "-|>", "color": INK_SOFT, "lw": 0.8, "shrinkB": 3},
            zorder=7,
            bbox={
                "boxstyle": "round,pad=0.2",
                "facecolor": ELEVATED_BG,
                "edgecolor": ANYPLOT_AMBER,
                "alpha": 0.9,
                "linewidth": 0.7,
            },
        )

# Style
title = "campbell-basic · python · matplotlib · anyplot.ai"
title_fontsize = max(8, round(12 * 67 / len(title))) if len(title) > 67 else 12

ax.set_xlabel("Rotational Speed (RPM)", fontsize=10, color=INK)
ax.set_ylabel("Frequency (Hz)", fontsize=10, color=INK)
ax.set_title(title, fontsize=title_fontsize, fontweight="medium", color=INK, pad=10)
ax.tick_params(axis="both", labelsize=8, colors=INK_SOFT, labelcolor=INK_SOFT)
ax.xaxis.set_major_formatter(FuncFormatter(lambda x, _: f"{x:,.0f}"))

for spine in ("top", "right"):
    ax.spines[spine].set_visible(False)
for spine in ("left", "bottom"):
    ax.spines[spine].set_linewidth(0.6)
    ax.spines[spine].set_color(INK_SOFT)

ax.set_xlim(0, 6000)
ax.set_ylim(0, y_max)
ax.yaxis.grid(True, alpha=0.15, linewidth=0.6, color=INK)
ax.set_axisbelow(True)

# Legend
eo_handle = Line2D([0], [0], color=INK_SOFT, linewidth=1.5, linestyle=(0, (8, 4)), alpha=0.7)
crit_outside = Line2D(
    [0], [0], marker="o", color="none", markerfacecolor=INK_MUTED, markeredgecolor=PAGE_BG, markersize=7, alpha=0.5
)
crit_inside = Line2D(
    [0], [0], marker="D", color="none", markerfacecolor=ANYPLOT_AMBER, markeredgecolor=INK, markersize=7
)
op_handle = Patch(facecolor=INK, alpha=0.25, edgecolor="none")

handles = [Line2D([0], [0], color=c, linewidth=2.5) for c in mode_colors] + [
    eo_handle,
    crit_outside,
    crit_inside,
    op_handle,
]
legend_labels = mode_labels + ["Engine Order (1×–3×)", "Critical Speed", "Critical (op. range)", "Operating Range"]

leg = ax.legend(
    handles,
    legend_labels,
    fontsize=8,
    loc="upper left",
    ncol=2,
    framealpha=0.92,
    edgecolor=INK_SOFT,
    borderpad=0.5,
    labelspacing=0.4,
    handlelength=1.4,
    columnspacing=1.0,
)
leg.get_frame().set_facecolor(ELEVATED_BG)
plt.setp(leg.get_texts(), color=INK_SOFT)

fig.subplots_adjust(left=0.09, right=0.86, top=0.91, bottom=0.13)

# Save
plt.savefig(f"plot-{THEME}.png", dpi=400, facecolor=PAGE_BG)
Runnable source as JSON, for any HTTP client: https://api.anyplot.ai/specs/campbell-basic/matplotlib/code. Any spec id and library id listed in llms-full.txt fit the same URL shape; every URL below is complete and callable.
{
  "spec_id": "campbell-basic",
  "language": "python",
  "library": "matplotlib",
  "page": "https://anyplot.ai/campbell-basic/python/matplotlib",
  "hub": "https://anyplot.ai/campbell-basic",
  "code_json": "https://api.anyplot.ai/specs/campbell-basic/matplotlib/code",
  "spec_json": "https://api.anyplot.ai/specs/campbell-basic",
  "render_light_png": "https://storage.googleapis.com/anyplot-images/plots/campbell-basic/python/matplotlib/plot-light.png",
  "render_dark_png": "https://storage.googleapis.com/anyplot-images/plots/campbell-basic/python/matplotlib/plot-dark.png",
  "quality_score": 90.0,
  "license": "MIT",
  "guide": "https://anyplot.ai/llms.txt"
}
Part of Campbell Diagram on anyplot.ai.