The same plot in 14 other libraries — JavaScript: Chart.js, D3.js, Apache ECharts, Highcharts; Python: Altair, Bokeh, lets-plot, Matplotlib, Plotly, plotnine, Pygal, Seaborn; R: ggplot2; Julia: Makie.jl. Compare all 15 side by side: Campbell Diagram in Python, R, Julia and JavaScript.
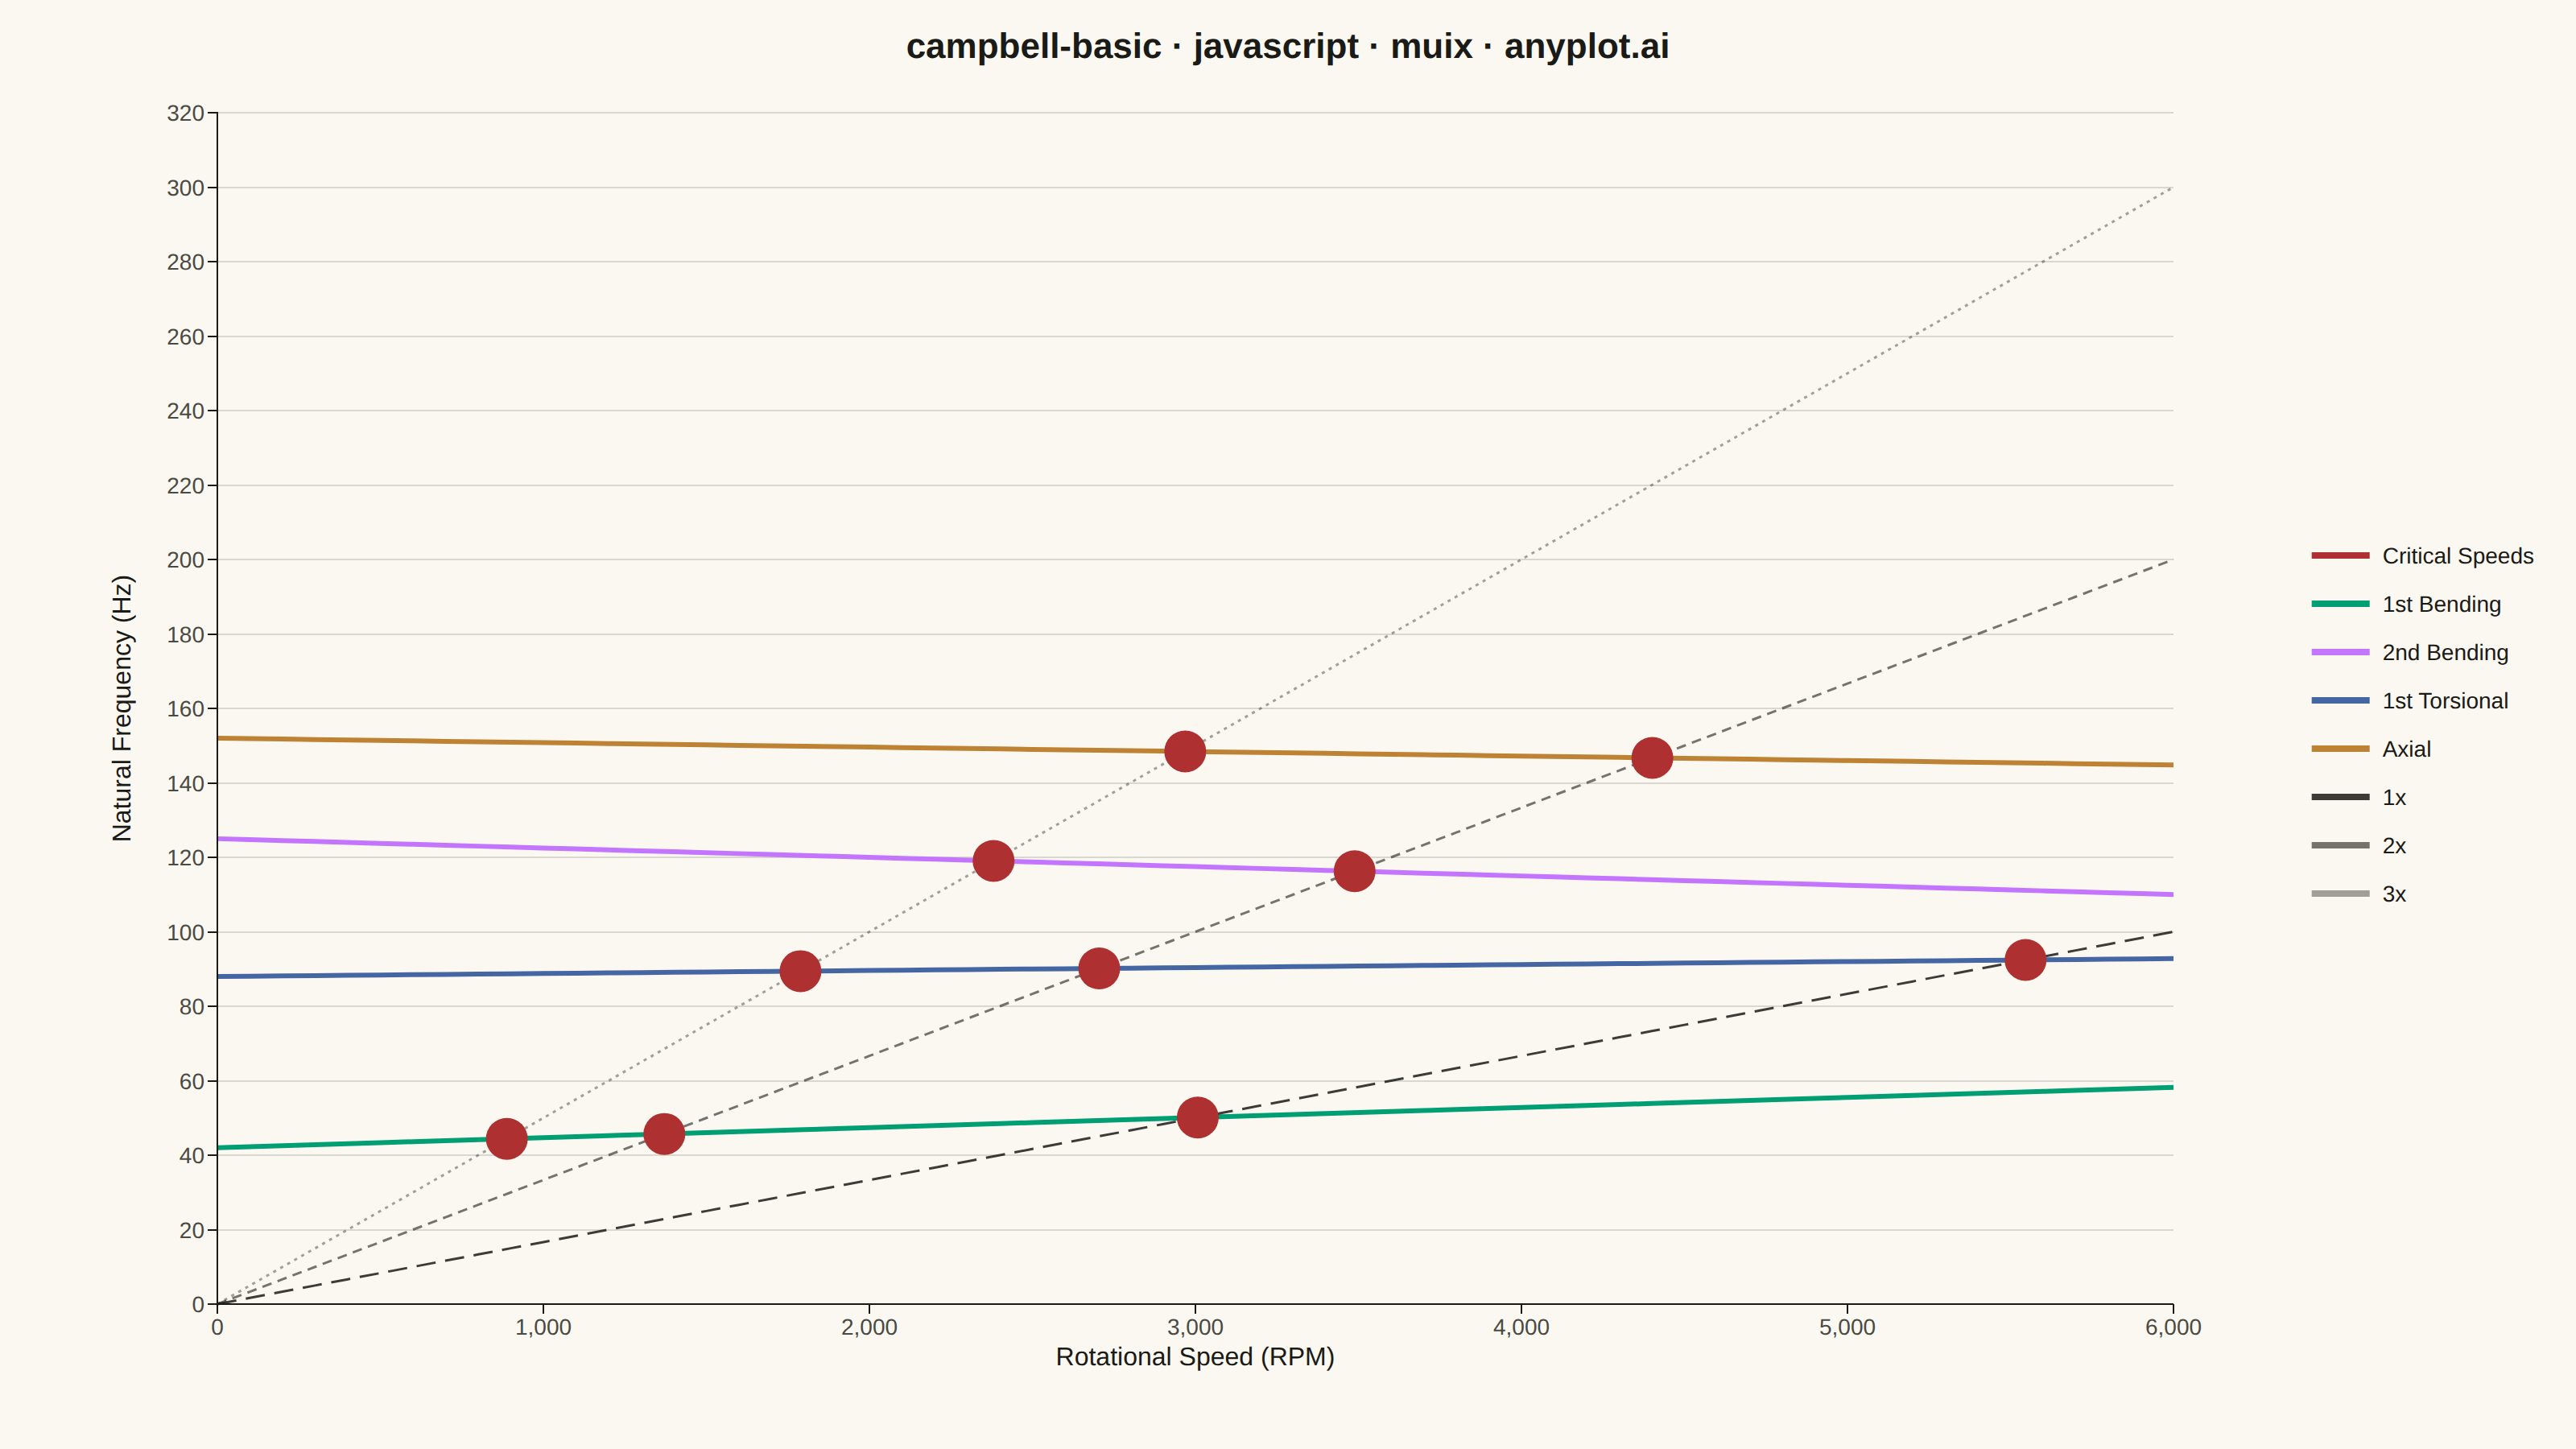
A Campbell Diagram (also called an interference diagram) plots natural frequencies against rotational speed to identify critical speeds and resonance conditions in rotating machinery. It overlays engine order excitation lines (diagonal lines from the origin) on top of natural frequency curves, with intersections marking critical speeds where resonance may occur. This visualization is essential for ensuring safe operating ranges in turbomachinery, automotive powertrains, and other rotating equipment.
// anyplot.ai
// campbell-basic: Campbell Diagram
// Library: muix 7.29.1 | JavaScript 22.23.2
// Quality: 94/100 | Created: 2026-08-24
import { ChartContainer } from "@mui/x-charts/ChartContainer";
import { LinePlot } from "@mui/x-charts/LineChart";
import { ScatterPlot } from "@mui/x-charts/ScatterChart";
import { ChartsXAxis } from "@mui/x-charts/ChartsXAxis";
import { ChartsYAxis } from "@mui/x-charts/ChartsYAxis";
import { ChartsGrid } from "@mui/x-charts/ChartsGrid";
import { ChartsLegend } from "@mui/x-charts/ChartsLegend";

const t = window.ANYPLOT_TOKENS;
const { width, height } = window.ANYPLOT_SIZE;
const TITLE = "campbell-basic · javascript · muix · anyplot.ai";

// --- Data (in-memory, deterministic): turbocompressor rotor train -----------
const SPEED_STEP = 100;
const SPEED_MAX = 6000;
const speeds = Array.from(
  { length: SPEED_MAX / SPEED_STEP + 1 },
  (_, i) => i * SPEED_STEP,
);

// Natural frequency curves (Hz): gyroscopic effects stiffen forward-whirl
// modes and soften backward-whirl modes as rotational speed rises.
const modes = [
  { id: "bend1", label: "1st Bending", freq: (s) => 42 + 0.0027 * s },
  { id: "bend2", label: "2nd Bending", freq: (s) => 125 - 0.0025 * s },
  { id: "tors1", label: "1st Torsional", freq: (s) => 88 + 0.0008 * s },
  { id: "axial", label: "Axial", freq: (s) => 152 - 0.0012 * s },
];
const modeCurves = modes.map((m) => ({ ...m, data: speeds.map(m.freq) }));

// Engine order excitation lines: frequency (Hz) = order x speed (RPM) / 60.
const orders = [
  { id: "order1", order: 1, label: "1x", dash: "12 6", opacity: 0.85 },
  { id: "order2", order: 2, label: "2x", dash: "6 4", opacity: 0.6 },
  { id: "order3", order: 3, label: "3x", dash: "2 3", opacity: 0.4 },
];
const orderLines = orders.map((o) => ({
  ...o,
  data: speeds.map((s) => (o.order * s) / 60),
}));

// Critical speeds: RPM where an engine-order line crosses a natural-frequency
// curve, located by linear interpolation across sign changes on the shared
// speed grid (both families are sampled on the same `speeds` array).
const criticalSpeeds = [];
modeCurves.forEach((mode) => {
  orderLines.forEach((order) => {
    for (let i = 0; i < speeds.length - 1; i += 1) {
      const diffA = mode.data[i] - order.data[i];
      const diffB = mode.data[i + 1] - order.data[i + 1];
      if (diffA === 0 || diffA * diffB < 0) {
        const frac = diffA / (diffA - diffB);
        criticalSpeeds.push({
          x: speeds[i] + frac * SPEED_STEP,
          y: mode.data[i] + frac * (mode.data[i + 1] - mode.data[i]),
          id: `${mode.id}-${order.id}`,
        });
      }
    }
  });
});

const allFrequencies = [
  ...modeCurves.flatMap((m) => m.data),
  ...orderLines.flatMap((o) => o.data),
];
const FREQ_MAX = Math.ceil(Math.max(...allFrequencies) / 20) * 20 + 20;

export default function Chart() {
  return (
    <ChartContainer
      width={width}
      height={height}
      skipAnimation
      margin={{ top: 70, right: 250, bottom: 90, left: 135 }}
      sx={{
        // Mode curves (the primary data) get a heavier stroke so they read as
        // the "real" data; engine-order reference lines stay thin, dashed,
        // and get a per-order opacity step so 1x/2x/3x read as a fading
        // sequence in the plot body.
        ...Object.fromEntries(
          modeCurves.map((m) => [
            `& .MuiLineElement-series-${m.id}`,
            { strokeWidth: 3 },
          ]),
        ),
        ...Object.fromEntries(
          orders.map((o) => [
            `& .MuiLineElement-series-${o.id}`,
            { strokeDasharray: o.dash, opacity: o.opacity, strokeWidth: 1.5 },
          ]),
        ),
        // The legend mark is a solid filled <rect> (no stroke, so
        // strokeDasharray never reaches it) — mirror the same per-order
        // opacity step there so 1x/2x/3x stay visually distinct in the
        // legend, not just in the plot body.
        ...Object.fromEntries(
          orders.map((o) => [
            `& .MuiChartsLegend-series-${o.id} .MuiChartsLegend-mark`,
            { opacity: o.opacity },
          ]),
        ),
      }}
      series={[
        ...modeCurves.map((m, i) => ({
          type: "line",
          id: m.id,
          data: m.data,
          label: m.label,
          color: t.palette[i],
          showMark: false,
          curve: "linear",
        })),
        ...orderLines.map((o) => ({
          type: "line",
          id: o.id,
          data: o.data,
          label: o.label,
          color: t.ink,
          showMark: false,
          curve: "linear",
        })),
        {
          type: "scatter",
          id: "critical",
          data: criticalSpeeds,
          label: "Critical Speeds",
          color: t.palette[4],
          markerSize: 13,
        },
      ]}
      xAxis={[
        {
          data: speeds,
          scaleType: "linear",
          min: 0,
          max: SPEED_MAX,
          tickNumber: 7,
          label: "Rotational Speed (RPM)",
          labelStyle: { fontSize: 16, fill: t.ink },
          tickLabelStyle: { fontSize: 14, fill: t.inkSoft },
        },
      ]}
      yAxis={[
        {
          min: 0,
          max: FREQ_MAX,
          label: "Natural Frequency (Hz)",
          labelStyle: { fontSize: 16, fill: t.ink },
          // tickFontSize only widens the label's clearance from the tick
          // text (see ChartsYAxis labelRefPoint offset) — the *rendered*
          // tick size still comes from tickLabelStyle.fontSize below.
          tickFontSize: 38,
          tickLabelStyle: { fontSize: 14, fill: t.inkSoft },
        },
      ]}
    >
      <ChartsGrid horizontal />
      <LinePlot />
      <ScatterPlot />
      <ChartsXAxis />
      <ChartsYAxis />
      <ChartsLegend
        position={{ vertical: "middle", horizontal: "right" }}
        direction="column"
        slotProps={{
          legend: {
            // Widened from 20px so the per-order opacity step (see sx above)
            // reads as a clear light/medium/dark gradient across the three
            // swatches instead of a barely-visible sliver.
            itemMarkWidth: 36,
            itemMarkHeight: 4,
            markGap: 8,
            itemGap: 16,
            labelStyle: { fontSize: 14, fill: t.ink },
          },
        }}
      />
      <text
        x={width / 2}
        y={36}
        textAnchor="middle"
        fontSize={22}
        fontWeight={600}
        fill={t.ink}
      >
        {TITLE}
      </text>
    </ChartContainer>
  );
}
Runnable source as JSON, for any HTTP client: https://api.anyplot.ai/specs/campbell-basic/muix/code. Any spec id and library id listed in llms-full.txt fit the same URL shape; every URL below is complete and callable.
{
  "spec_id": "campbell-basic",
  "language": "javascript",
  "library": "muix",
  "page": "https://anyplot.ai/campbell-basic/javascript/muix",
  "hub": "https://anyplot.ai/campbell-basic",
  "code_json": "https://api.anyplot.ai/specs/campbell-basic/muix/code",
  "spec_json": "https://api.anyplot.ai/specs/campbell-basic",
  "render_light_png": "https://storage.googleapis.com/anyplot-images/plots/campbell-basic/javascript/muix/plot-light.png",
  "render_dark_png": "https://storage.googleapis.com/anyplot-images/plots/campbell-basic/javascript/muix/plot-dark.png",
  "interactive_light_html": "https://storage.googleapis.com/anyplot-images/plots/campbell-basic/javascript/muix/plot-light.html",
  "interactive_dark_html": "https://storage.googleapis.com/anyplot-images/plots/campbell-basic/javascript/muix/plot-dark.html",
  "quality_score": 94.0,
  "license": "MIT",
  "guide": "https://anyplot.ai/llms.txt"
}
Part of Campbell Diagram on anyplot.ai.