The same plot in 14 other libraries — JavaScript: D3.js, Apache ECharts, Highcharts, MUI X Charts; Python: Altair, Bokeh, lets-plot, Matplotlib, Plotly, plotnine, Pygal, Seaborn; R: ggplot2; Julia: Makie.jl. Compare all 15 side by side: Stock Candlestick Chart with Volume in Python, R, Julia and JavaScript.
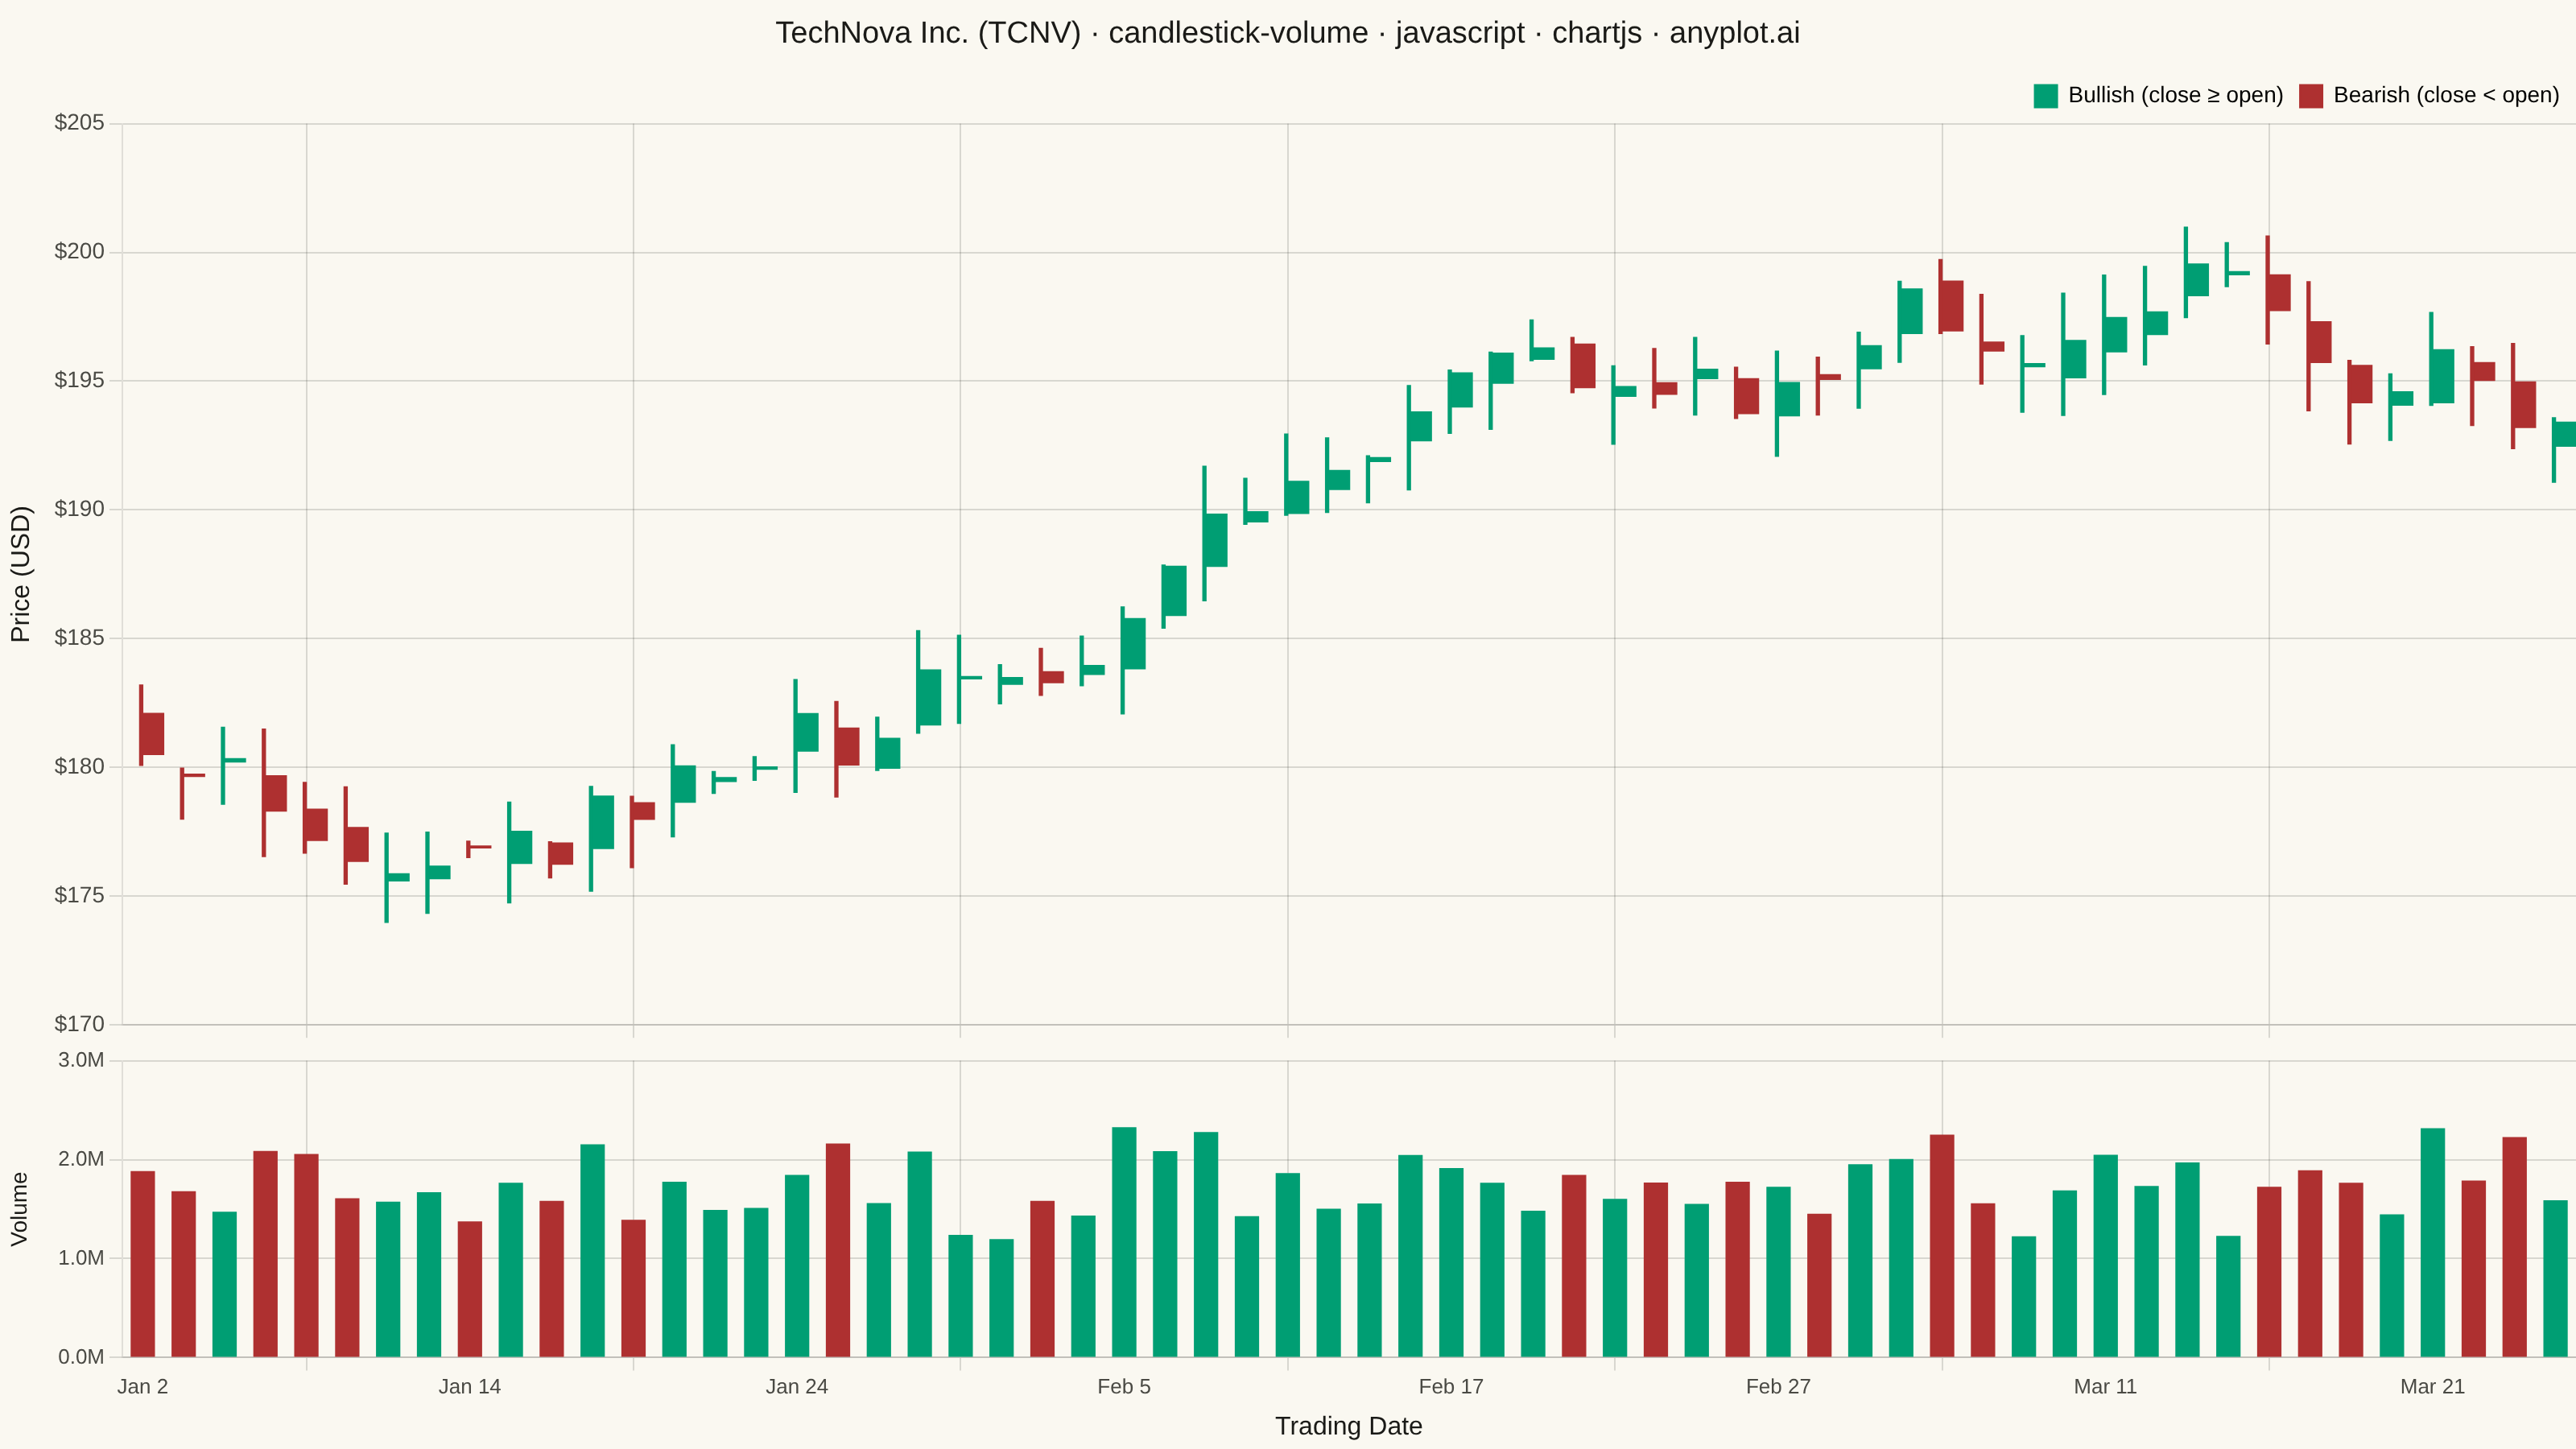
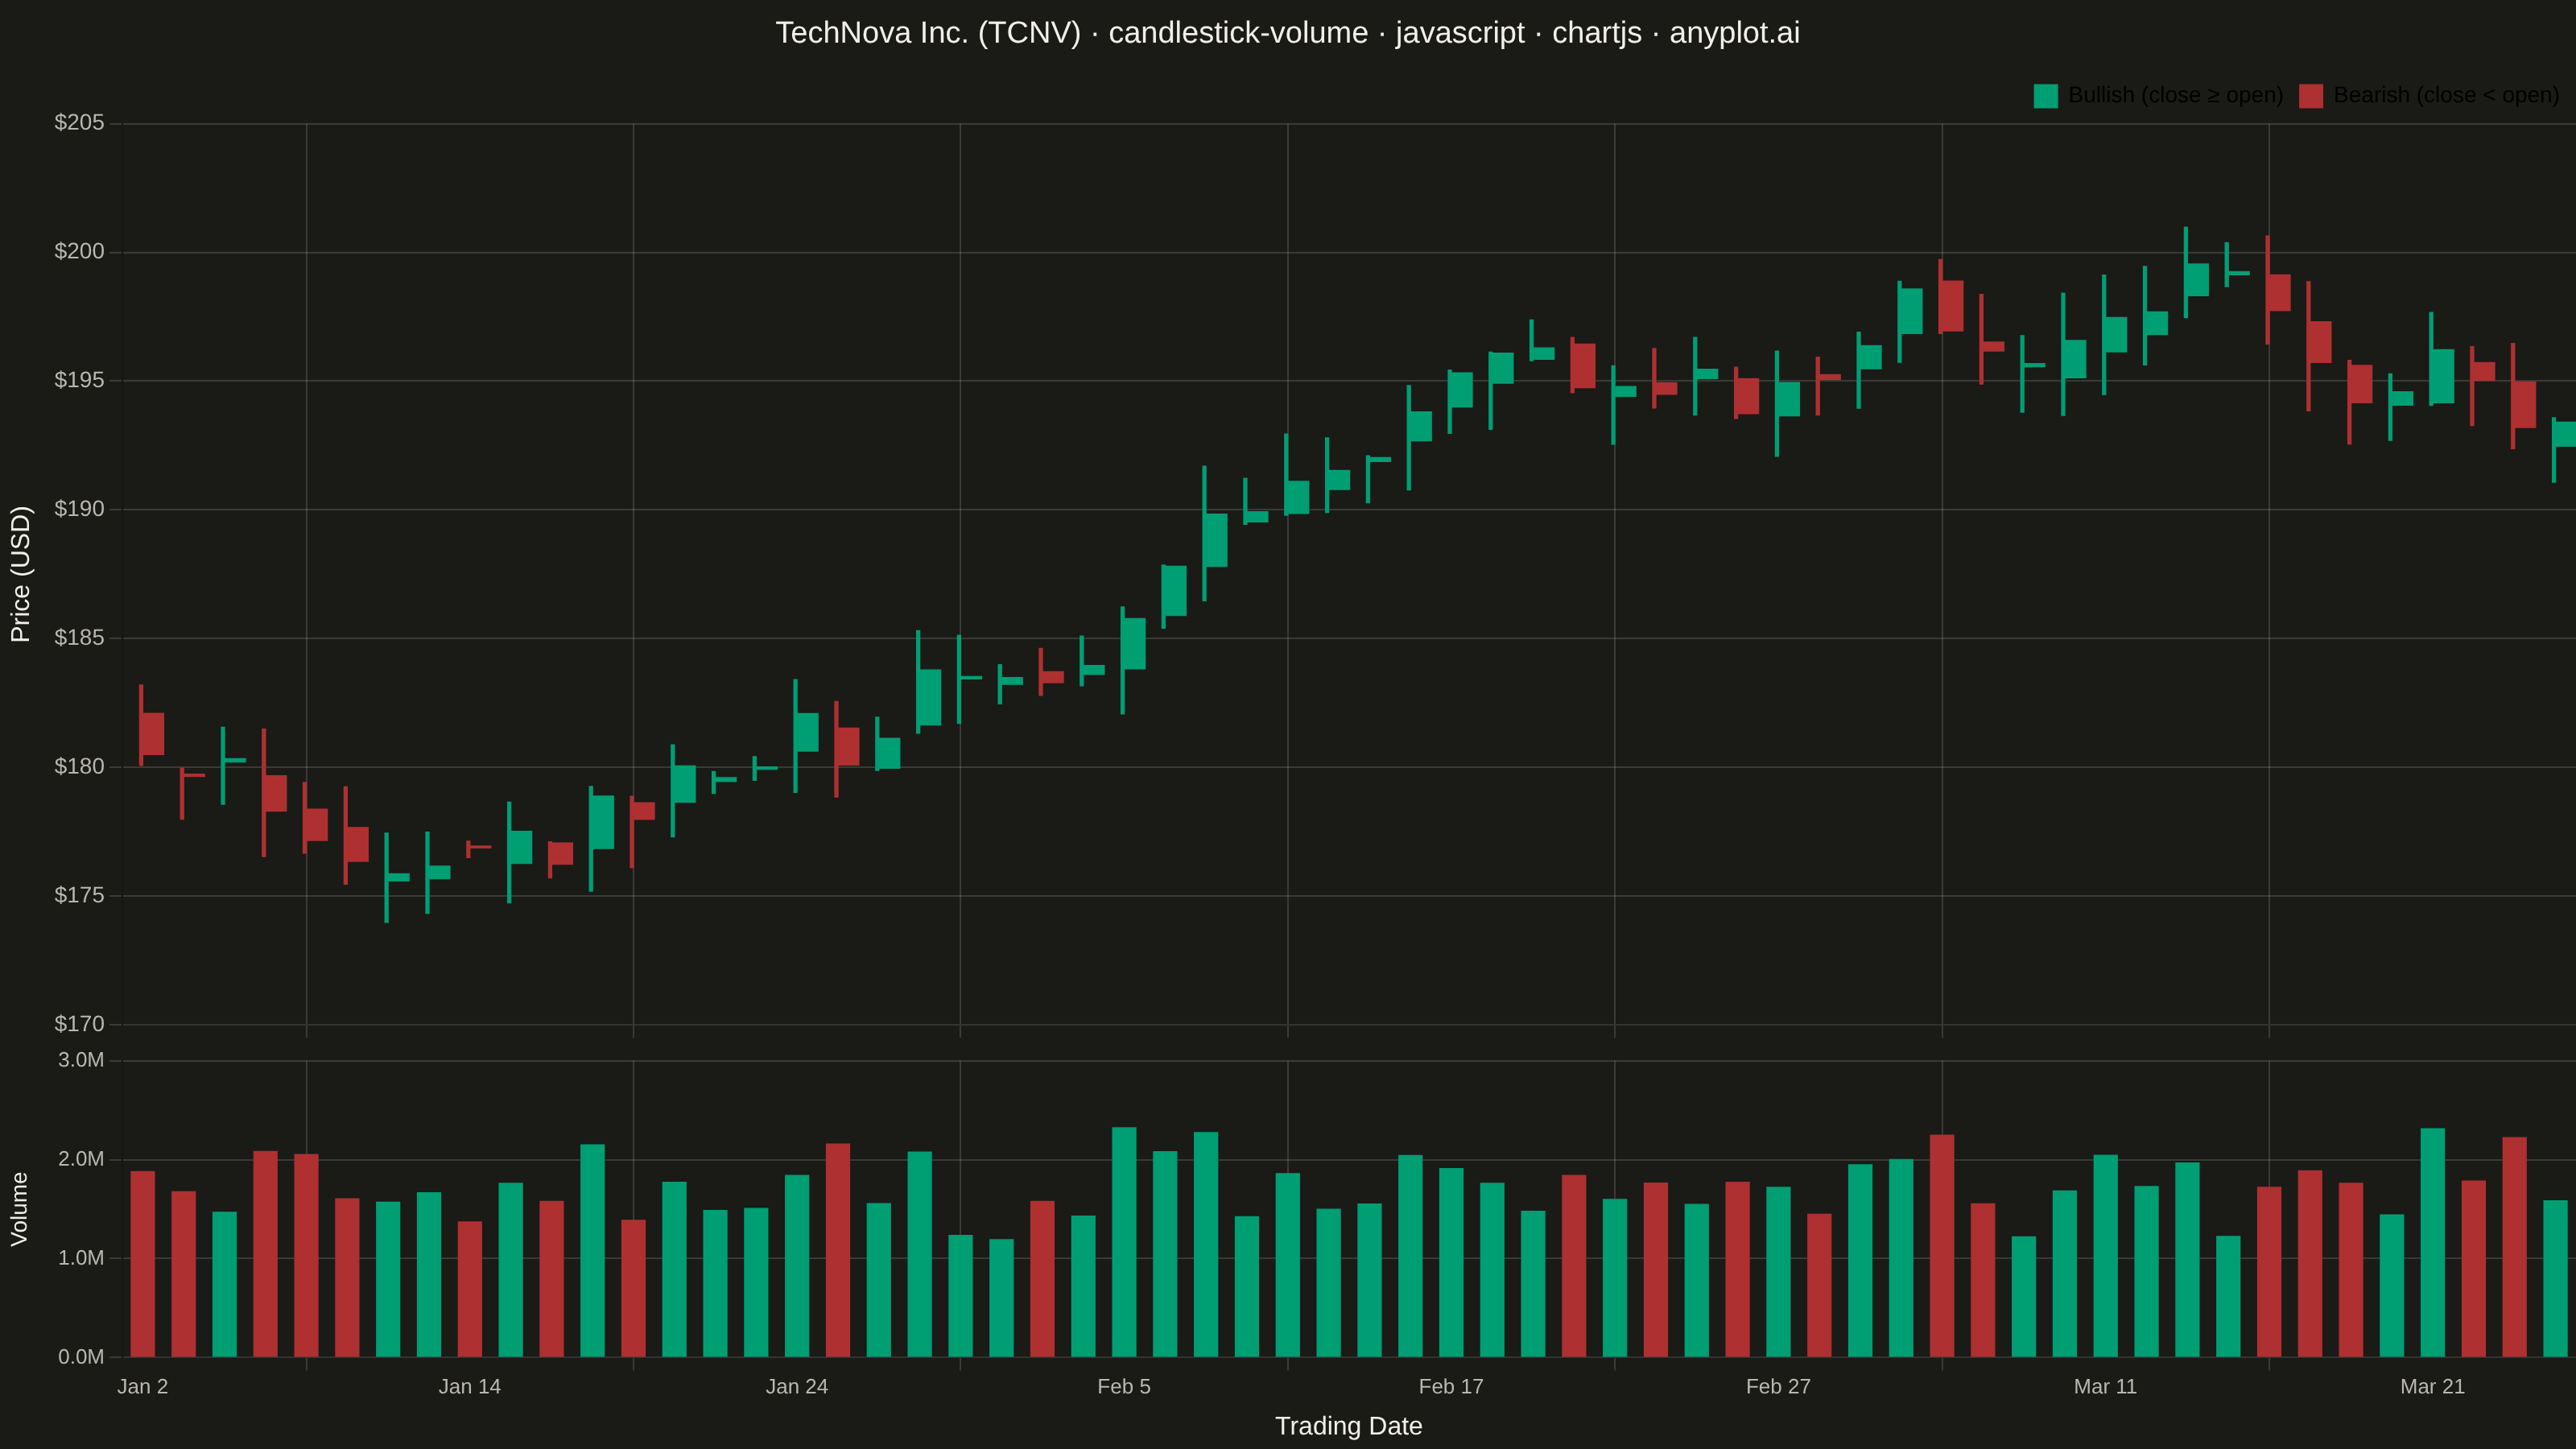
A professional candlestick chart combining OHLC (open, high, low, close) price data with volume bars in a synchronized lower pane. The dual-pane layout presents price action in the main chart with corresponding trading volume below, sharing a common time axis. This format is the standard for technical analysis platforms, enabling traders to correlate price movements with trading activity and identify volume-confirmed trends or reversals.
// anyplot.ai
// candlestick-volume: Stock Candlestick Chart with Volume
// Library: chartjs 4.4.7 | JavaScript 22.23.2
// Quality: 91/100 | Created: 2026-09-02

const t = window.ANYPLOT_TOKENS;
const upColor = t.palette[0]; // #009E73 brand green — bullish (close >= open)
const downColor = t.palette[4]; // #AE3030 matte red — bearish (close < open), finance semantic exception

// --- Data: 60 trading days of a synthetic ticker, deterministic LCG walk ---
function lcg(seed) {
  let state = seed;
  return () => {
    state = (state * 1664525 + 1013904223) % 4294967296;
    return state / 4294967296;
  };
}
const rand = lcg(42);

const MONTHS = ["Jan", "Feb", "Mar", "Apr", "May", "Jun", "Jul", "Aug", "Sep", "Oct", "Nov", "Dec"];
const NUM_DAYS = 60;
const dates = [];
const cursor = new Date(Date.UTC(2025, 0, 2));
while (dates.length < NUM_DAYS) {
  const weekday = cursor.getUTCDay();
  if (weekday !== 0 && weekday !== 6) dates.push(new Date(cursor));
  cursor.setUTCDate(cursor.getUTCDate() + 1);
}
const dateLabels = dates.map((d) => `${MONTHS[d.getUTCMonth()]} ${d.getUTCDate()}`);

const rows = [];
let prevClose = 182.5;
for (let i = 0; i < NUM_DAYS; i++) {
  const open = prevClose + (rand() - 0.5) * 1.6;
  const drift = (rand() - 0.47) * 4.2;
  const close = open + drift;
  const high = Math.max(open, close) + rand() * 1.9;
  const low = Math.min(open, close) - rand() * 1.9;
  const volume = Math.round(1.1e6 + Math.abs(drift) * 3.6e5 + rand() * 5.5e5);
  rows.push({
    open: Math.round(open * 100) / 100,
    high: Math.round(high * 100) / 100,
    low: Math.round(low * 100) / 100,
    close: Math.round(close * 100) / 100,
    volume,
  });
  prevClose = close;
}
const barColors = rows.map((r) => (r.close >= r.open ? upColor : downColor));

// Zoom the price axis to the data range instead of $0 — standard OHLC
// convention, and it keeps the candle bodies/wicks legible on a 60-day span.
const pricePad = (Math.max(...rows.map((r) => r.high)) - Math.min(...rows.map((r) => r.low))) * 0.12;
const priceMin = Math.floor(Math.min(...rows.map((r) => r.low)) - pricePad);
const priceMax = Math.ceil(Math.max(...rows.map((r) => r.high)) + pricePad);

// Both panes share the same category count but only every Nth label is
// shown — pruning identical tick indices on both x-scales keeps gridlines
// pixel-aligned across the two panes (spec: "grid lines ... aligned").
const TICK_STEP = 8;
function pruneTicks(scale) {
  scale.ticks = scale.ticks.filter((_, i) => i % TICK_STEP === 0);
}

// --- Mount: two stacked panes sharing a category axis ----------------------
const wrapper = document.createElement("div");
wrapper.style.display = "flex";
wrapper.style.flexDirection = "column";
wrapper.style.width = "100%";
wrapper.style.height = "100%";
document.getElementById("container").appendChild(wrapper);

const pricePane = document.createElement("div");
pricePane.style.flex = "0 0 72%";
pricePane.style.minHeight = "0";
wrapper.appendChild(pricePane);

const volumePane = document.createElement("div");
volumePane.style.flex = "0 0 28%";
volumePane.style.minHeight = "0";
wrapper.appendChild(volumePane);

const priceCanvas = document.createElement("canvas");
pricePane.appendChild(priceCanvas);
const volumeCanvas = document.createElement("canvas");
volumePane.appendChild(volumeCanvas);

// --- Title, sized to the mandated title-length formula ---------------------
const TITLE = "TechNova Inc. (TCNV) · candlestick-volume · javascript · chartjs · anyplot.ai";
const titleFontSize = TITLE.length > 67 ? Math.round(22 * (67 / TITLE.length)) : 22;

// --- Synced crosshair: a local plugin, no chartjs-chart-* package ----------
// Only draws once a real mousemove event fires on either pane — never baked
// into the static screenshot, so the light/dark PNGs stay crosshair-free.
const sharedHover = { index: null };
let priceChart;
let volumeChart;

const syncCrosshair = {
  id: "syncCrosshair",
  afterEvent(chart, args) {
    const event = args.event;
    if (event.type === "mousemove") {
      const points = chart.getElementsAtEventForMode(event, "index", { intersect: false }, true);
      if (points.length) {
        sharedHover.index = points[0].index;
        priceChart.update("none");
        volumeChart.update("none");
      }
    } else if (event.type === "mouseout") {
      sharedHover.index = null;
      priceChart.update("none");
      volumeChart.update("none");
    }
  },
  afterDraw(chart) {
    if (sharedHover.index === null) return;
    const el = chart.getDatasetMeta(0).data[sharedHover.index];
    if (!el) return;
    const { ctx, chartArea } = chart;
    ctx.save();
    ctx.strokeStyle = t.ink;
    ctx.globalAlpha = 0.35;
    ctx.lineWidth = 1;
    ctx.setLineDash([4, 4]);
    ctx.beginPath();
    ctx.moveTo(el.x, chartArea.top);
    ctx.lineTo(el.x, chartArea.bottom);
    ctx.stroke();
    ctx.restore();
  },
};
Chart.register(syncCrosshair);

// --- Price pane: candlestick built from two overlaid floating-bar datasets -
priceChart = new Chart(priceCanvas, {
  type: "bar",
  data: {
    labels: dateLabels,
    datasets: [
      {
        label: "High-Low",
        data: rows.map((r) => [r.low, r.high]),
        backgroundColor: barColors,
        barThickness: 2,
        order: 1,
      },
      {
        label: "Open-Close",
        data: rows.map((r) => [Math.min(r.open, r.close), Math.max(r.open, r.close)]),
        backgroundColor: barColors,
        barThickness: 13,
        order: 2,
      },
    ],
  },
  options: {
    responsive: true,
    maintainAspectRatio: false,
    animation: false,
    interaction: { mode: "index", intersect: false },
    plugins: {
      title: { display: true, text: TITLE, color: t.ink, font: { size: titleFontSize, weight: "500" } },
      legend: {
        display: true,
        position: "top",
        align: "end",
        onClick: () => {},
        labels: {
          color: t.inkSoft,
          font: { size: 14 },
          boxWidth: 14,
          generateLabels: () => [
            { text: "Bullish (close ≥ open)", fillStyle: upColor, strokeStyle: upColor },
            { text: "Bearish (close < open)", fillStyle: downColor, strokeStyle: downColor },
          ],
        },
      },
      tooltip: {
        backgroundColor: t.elevatedBg,
        titleColor: t.ink,
        bodyColor: t.inkSoft,
        borderColor: t.grid,
        borderWidth: 1,
        callbacks: {
          title: (items) => dateLabels[items[0].dataIndex],
          label: (item) => {
            const r = rows[item.dataIndex];
            return [`Open ${r.open.toFixed(2)}  High ${r.high.toFixed(2)}`, `Low ${r.low.toFixed(2)}  Close ${r.close.toFixed(2)}`];
          },
        },
      },
    },
    scales: {
      x: {
        grouped: false,
        ticks: { display: false },
        grid: { color: t.grid },
        afterBuildTicks: pruneTicks,
      },
      y: {
        min: priceMin,
        max: priceMax,
        ticks: { color: t.inkSoft, font: { size: 14 }, callback: (v) => `$${v}` },
        grid: { color: t.grid },
        title: { display: true, text: "Price (USD)", color: t.ink, font: { size: 16 } },
        afterFit: (scale) => {
          scale.width = 76;
        },
      },
    },
  },
  plugins: [syncCrosshair],
});

// --- Volume pane: bars colored by the same day's up/down direction ---------
volumeChart = new Chart(volumeCanvas, {
  type: "bar",
  data: {
    labels: dateLabels,
    datasets: [
      {
        label: "Volume",
        data: rows.map((r) => r.volume),
        backgroundColor: barColors,
        barPercentage: 0.7,
        categoryPercentage: 0.85,
      },
    ],
  },
  options: {
    responsive: true,
    maintainAspectRatio: false,
    animation: false,
    interaction: { mode: "index", intersect: false },
    plugins: {
      title: { display: false },
      legend: { display: false },
      tooltip: {
        backgroundColor: t.elevatedBg,
        titleColor: t.ink,
        bodyColor: t.inkSoft,
        borderColor: t.grid,
        borderWidth: 1,
        callbacks: {
          label: (item) => `Volume ${(item.raw / 1e6).toFixed(2)}M`,
        },
      },
    },
    scales: {
      x: {
        grouped: false,
        ticks: { color: t.inkSoft, font: { size: 13 }, maxRotation: 0 },
        grid: { color: t.grid },
        title: { display: true, text: "Trading Date", color: t.ink, font: { size: 16 } },
        afterBuildTicks: pruneTicks,
      },
      y: {
        ticks: { color: t.inkSoft, font: { size: 13 }, callback: (v) => `${(v / 1e6).toFixed(1)}M`, maxTicksLimit: 4 },
        grid: { color: t.grid },
        title: { display: true, text: "Volume", color: t.ink, font: { size: 14 } },
        afterFit: (scale) => {
          scale.width = 76;
        },
      },
    },
  },
  plugins: [syncCrosshair],
});
Runnable source as JSON, for any HTTP client: https://api.anyplot.ai/specs/candlestick-volume/chartjs/code. Any spec id and library id listed in llms-full.txt fit the same URL shape; every URL below is complete and callable.
{
  "spec_id": "candlestick-volume",
  "language": "javascript",
  "library": "chartjs",
  "page": "https://anyplot.ai/candlestick-volume/javascript/chartjs",
  "hub": "https://anyplot.ai/candlestick-volume",
  "code_json": "https://api.anyplot.ai/specs/candlestick-volume/chartjs/code",
  "spec_json": "https://api.anyplot.ai/specs/candlestick-volume",
  "render_light_png": "https://storage.googleapis.com/anyplot-images/plots/candlestick-volume/javascript/chartjs/plot-light.png",
  "render_dark_png": "https://storage.googleapis.com/anyplot-images/plots/candlestick-volume/javascript/chartjs/plot-dark.png",
  "interactive_light_html": "https://storage.googleapis.com/anyplot-images/plots/candlestick-volume/javascript/chartjs/plot-light.html",
  "interactive_dark_html": "https://storage.googleapis.com/anyplot-images/plots/candlestick-volume/javascript/chartjs/plot-dark.html",
  "quality_score": 91.0,
  "license": "MIT",
  "guide": "https://anyplot.ai/llms.txt"
}
Part of Stock Candlestick Chart with Volume on anyplot.ai.