The same plot in 14 other libraries — JavaScript: Chart.js, Apache ECharts, Highcharts, MUI X Charts; Python: Altair, Bokeh, lets-plot, Matplotlib, Plotly, plotnine, Pygal, Seaborn; R: ggplot2; Julia: Makie.jl. Compare all 15 side by side: Stock Candlestick Chart with Volume in Python, R, Julia and JavaScript.
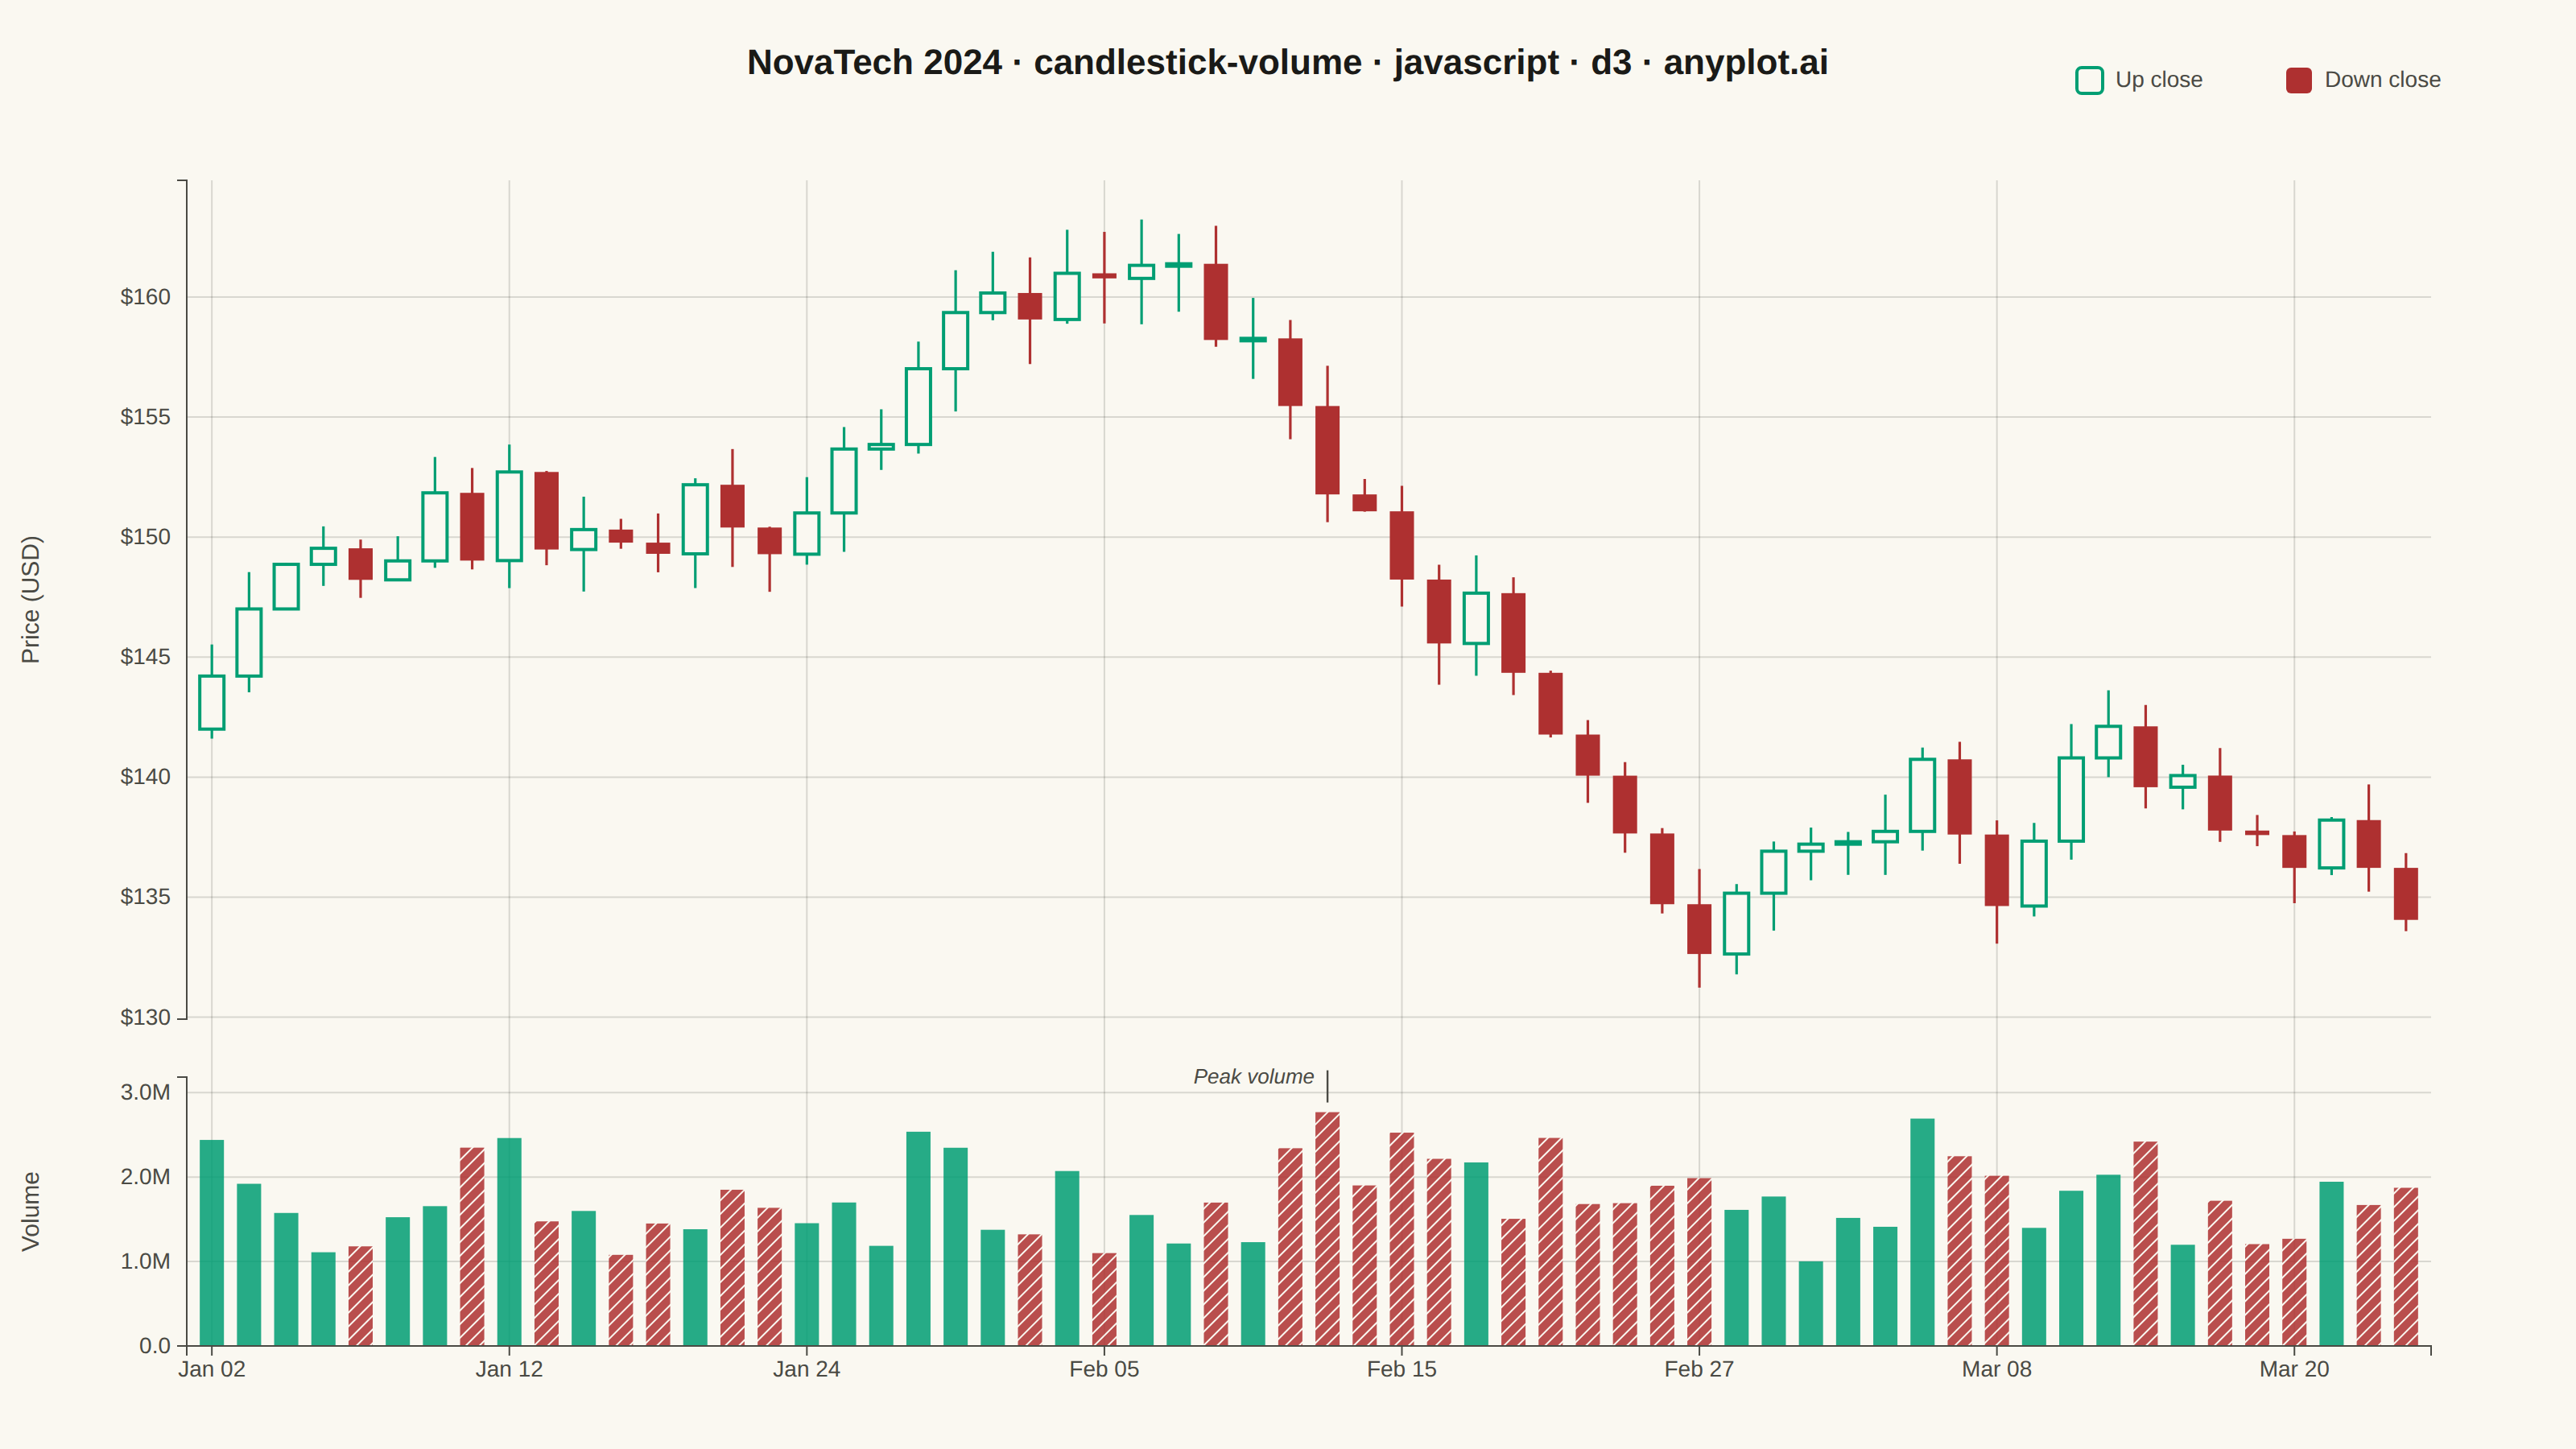
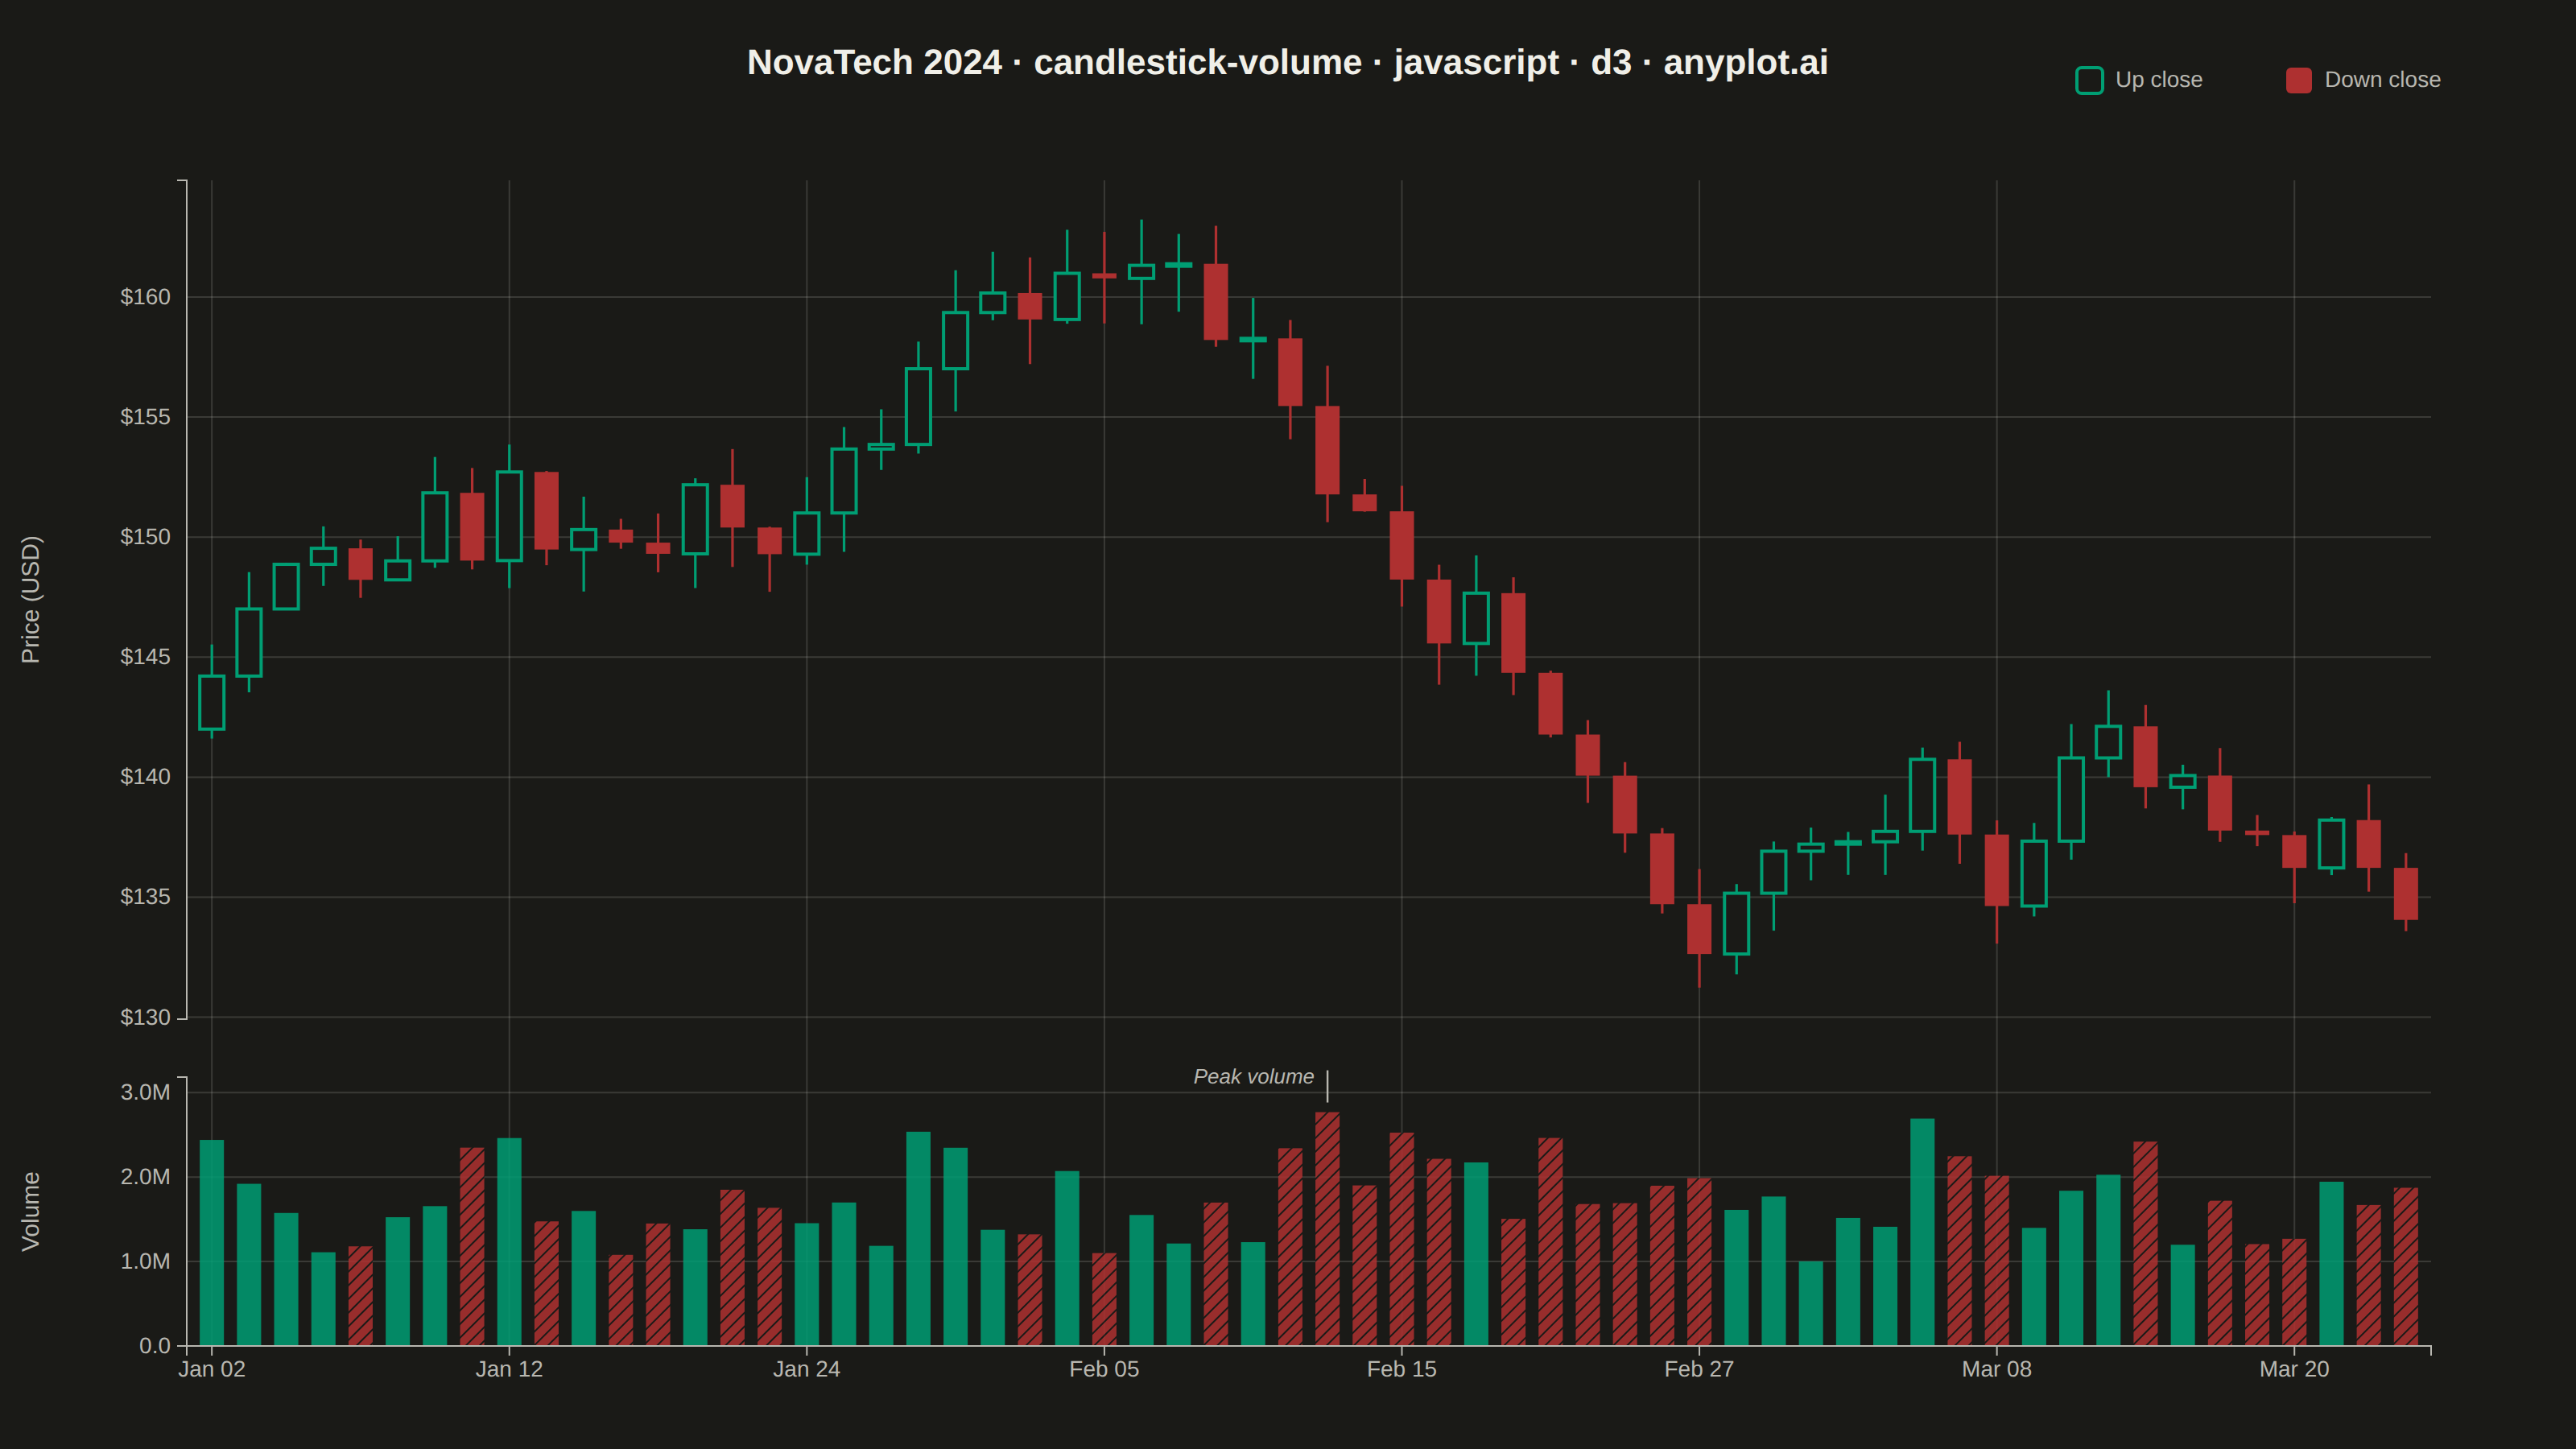
A professional candlestick chart combining OHLC (open, high, low, close) price data with volume bars in a synchronized lower pane. The dual-pane layout presents price action in the main chart with corresponding trading volume below, sharing a common time axis. This format is the standard for technical analysis platforms, enabling traders to correlate price movements with trading activity and identify volume-confirmed trends or reversals.
// anyplot.ai
// candlestick-volume: Stock Candlestick Chart with Volume
// Library: d3 7.9.0 | JavaScript 22.23.2
// Quality: 93/100 | Created: 2026-09-02
//# anyplot-orientation: landscape

const t = window.ANYPLOT_TOKENS;
const { width, height } = window.ANYPLOT_SIZE;

// --- Data: 60 trading days of OHLC + volume for a fictional stock ----------
// Fixed-seed LCG — the browser has no seeded RNG.
function lcg(seed) {
  let state = seed >>> 0;
  return function () {
    state = (1103515245 * state + 12345) >>> 0;
    return state / 4294967296;
  };
}
const rand = lcg(42);

const data = [];
let price = 142;
const cursor = new Date(2024, 0, 1);
while (data.length < 60) {
  cursor.setDate(cursor.getDate() + 1);
  const weekday = cursor.getDay();
  if (weekday === 0 || weekday === 6) continue;

  const changePct = (rand() - 0.48) * 0.05;
  const open = price;
  const close = open * (1 + changePct);
  const high = Math.max(open, close) * (1 + rand() * 0.012);
  const low = Math.min(open, close) * (1 - rand() * 0.012);
  const volatility = Math.abs(changePct);
  const volume = Math.round(1.4e6 * (1 + volatility * 26) * (0.65 + rand() * 0.6));

  data.push({ date: new Date(cursor), open, high, low, close, volume });
  price = close;
}

// --- Layout: price pane (~72%) + volume pane (~28%), shared x-axis ---------
const margin = { top: 112, right: 90, bottom: 64, left: 116 };
const paneGap = 36;
const plotWidth = width - margin.left - margin.right;
const plotHeight = height - margin.top - margin.bottom;
const priceHeight = Math.round(plotHeight * 0.72);
const volumeHeight = plotHeight - priceHeight - paneGap;

const svg = d3.select("#container").append("svg").attr("width", width).attr("height", height);
const defs = svg.append("defs");

const x = d3.scaleBand().domain(d3.range(data.length)).range([0, plotWidth]).padding(0.35);
const yPrice = d3
  .scaleLinear()
  .domain([d3.min(data, (d) => d.low) * 0.99, d3.max(data, (d) => d.high) * 1.01])
  .range([priceHeight, 0]);
const yVolume = d3
  .scaleLinear()
  .domain([0, d3.max(data, (d) => d.volume) * 1.15])
  .range([volumeHeight, 0]);

const UP = t.palette[0]; // brand green — profit/up
const DOWN = t.palette[4]; // semantic red anchor — loss/down
const colorFor = (d) => (d.close >= d.open ? UP : DOWN);
const isUp = (d) => d.close >= d.open;

// CVD-safe secondary cues (VQ-04): up candles render hollow, down candles solid;
// down-volume bars carry a diagonal hatch — shape distinguishes up/down without hue.
const hatch = defs
  .append("pattern")
  .attr("id", "down-volume-hatch")
  .attr("width", 6)
  .attr("height", 6)
  .attr("patternUnits", "userSpaceOnUse")
  .attr("patternTransform", "rotate(45)");
hatch.append("rect").attr("width", 6).attr("height", 6).attr("fill", DOWN);
hatch.append("line").attr("x1", 0).attr("y1", 0).attr("x2", 0).attr("y2", 6).attr("stroke", t.pageBg).attr("stroke-width", 2);

const tooltipShadow = defs
  .append("filter")
  .attr("id", "tooltip-shadow")
  .attr("x", "-30%")
  .attr("y", "-30%")
  .attr("width", "160%")
  .attr("height", "160%");
tooltipShadow.append("feDropShadow").attr("dx", 0).attr("dy", 2).attr("stdDeviation", 3).attr("flood-opacity", 0.28);

// --- Vertical gridlines spanning both panes (aligned by construction) ------
const tickStep = Math.max(1, Math.round(data.length / 8));
const tickIndices = data.map((_, i) => i).filter((i) => i % tickStep === 0);

const gridLayer = svg.append("g").attr("transform", `translate(${margin.left},${margin.top})`);
gridLayer
  .selectAll("line.vgrid")
  .data(tickIndices)
  .join("line")
  .attr("class", "vgrid")
  .attr("x1", (i) => x(i) + x.bandwidth() / 2)
  .attr("x2", (i) => x(i) + x.bandwidth() / 2)
  .attr("y1", 0)
  .attr("y2", priceHeight + paneGap + volumeHeight)
  .attr("stroke", t.grid)
  .attr("stroke-width", 1);

// --- Price pane --------------------------------------------------------------
const gPrice = svg.append("g").attr("transform", `translate(${margin.left},${margin.top})`);

gPrice
  .append("g")
  .call(d3.axisLeft(yPrice).ticks(6).tickFormat(d3.format("$,.0f")).tickSize(-plotWidth))
  .call((g) => g.select(".domain").remove())
  .call((g) => g.selectAll(".tick line").attr("stroke", t.grid))
  .call((g) => g.selectAll(".tick text").attr("fill", t.inkSoft).style("font-size", "14px").attr("x", -10));

gPrice
  .append("g")
  .call(d3.axisLeft(yPrice).ticks(6).tickFormat(d3.format("$,.0f")))
  .call((g) => g.select(".domain").attr("stroke", t.inkSoft))
  .call((g) => g.selectAll(".tick line").remove())
  .call((g) => g.selectAll(".tick text").remove());

const candles = gPrice.selectAll("g.candle").data(data).join("g").attr("class", "candle");

candles
  .append("line")
  .attr("x1", (d, i) => x(i) + x.bandwidth() / 2)
  .attr("x2", (d, i) => x(i) + x.bandwidth() / 2)
  .attr("y1", (d) => yPrice(d.high))
  .attr("y2", (d) => yPrice(d.low))
  .attr("stroke", colorFor)
  .attr("stroke-width", 1.6);

candles
  .append("rect")
  .attr("x", (d, i) => x(i))
  .attr("width", x.bandwidth())
  .attr("y", (d) => yPrice(Math.max(d.open, d.close)))
  .attr("height", (d) => Math.max(1.5, Math.abs(yPrice(d.open) - yPrice(d.close))))
  .attr("fill", (d) => (isUp(d) ? t.pageBg : DOWN))
  .attr("stroke", colorFor)
  .attr("stroke-width", (d) => (isUp(d) ? 2 : 0));

gPrice
  .append("text")
  .attr("transform", "rotate(-90)")
  .attr("x", -priceHeight / 2)
  .attr("y", -92)
  .attr("text-anchor", "middle")
  .attr("fill", t.inkSoft)
  .style("font-size", "15px")
  .text("Price (USD)");

// Legend — up / down bias, shape mirrors the hollow/solid candle cue
const legend = gPrice.append("g").attr("transform", `translate(${plotWidth - 220},-58)`);
const legendItems = [
  { label: "Up close", color: UP, up: true },
  { label: "Down close", color: DOWN, up: false },
];
legendItems.forEach((item, i) => {
  const row = legend.append("g").attr("transform", `translate(${i * 130},0)`);
  row
    .append("rect")
    .attr("width", 16)
    .attr("height", 16)
    .attr("y", -12)
    .attr("rx", 3)
    .attr("fill", item.up ? t.pageBg : item.color)
    .attr("stroke", item.color)
    .attr("stroke-width", item.up ? 2 : 0);
  row
    .append("text")
    .attr("x", 24)
    .attr("fill", t.inkSoft)
    .style("font-size", "14px")
    .text(item.label);
});

// --- Volume pane ---------------------------------------------------------
const gVolume = svg
  .append("g")
  .attr("transform", `translate(${margin.left},${margin.top + priceHeight + paneGap})`);

gVolume
  .append("g")
  .call(d3.axisLeft(yVolume).ticks(3).tickFormat(d3.format(".2s")).tickSize(-plotWidth))
  .call((g) => g.select(".domain").remove())
  .call((g) => g.selectAll(".tick line").attr("stroke", t.grid))
  .call((g) => g.selectAll(".tick text").attr("fill", t.inkSoft).style("font-size", "14px").attr("x", -10));

gVolume
  .append("g")
  .call(d3.axisLeft(yVolume).ticks(3).tickFormat(d3.format(".2s")))
  .call((g) => g.select(".domain").attr("stroke", t.inkSoft))
  .call((g) => g.selectAll(".tick line").remove())
  .call((g) => g.selectAll(".tick text").remove());

gVolume
  .selectAll("rect.volume")
  .data(data)
  .join("rect")
  .attr("class", "volume")
  .attr("x", (d, i) => x(i))
  .attr("width", x.bandwidth())
  .attr("y", (d) => yVolume(d.volume))
  .attr("height", (d) => volumeHeight - yVolume(d.volume))
  .attr("fill", (d) => (isUp(d) ? UP : "url(#down-volume-hatch)"))
  .attr("opacity", 0.85);

// --- Storytelling emphasis: call out the peak-volume trading day -----------
let peakIdx = 0;
data.forEach((d, i) => {
  if (d.volume > data[peakIdx].volume) peakIdx = i;
});
const peakX = x(peakIdx) + x.bandwidth() / 2;
const peakY = yVolume(data[peakIdx].volume);
const peakAnchor = peakIdx < data.length / 2 ? "start" : "end";

const annotation = gVolume.append("g").attr("class", "annotation");
annotation
  .append("line")
  .attr("x1", peakX)
  .attr("x2", peakX)
  .attr("y1", peakY - 26)
  .attr("y2", peakY - 6)
  .attr("stroke", t.inkSoft)
  .attr("stroke-width", 1.2);
annotation
  .append("text")
  .attr("x", peakX + (peakAnchor === "start" ? 8 : -8))
  .attr("y", peakY - 18)
  .attr("text-anchor", peakAnchor)
  .attr("fill", t.inkSoft)
  .style("font-size", "13px")
  .style("font-style", "italic")
  .text("Peak volume");

gVolume
  .append("text")
  .attr("transform", "rotate(-90)")
  .attr("x", -volumeHeight / 2)
  .attr("y", -92)
  .attr("text-anchor", "middle")
  .attr("fill", t.inkSoft)
  .style("font-size", "15px")
  .text("Volume");

// Shared x-axis, drawn once beneath the volume pane
const xAxis = gVolume
  .append("g")
  .attr("transform", `translate(0,${volumeHeight})`)
  .call(d3.axisBottom(x).tickValues(tickIndices).tickFormat((i) => d3.timeFormat("%b %d")(data[i].date)));
xAxis.select(".domain").attr("stroke", t.inkSoft);
xAxis.selectAll(".tick line").attr("stroke", t.inkSoft);
xAxis.selectAll(".tick text").attr("fill", t.inkSoft).style("font-size", "14px");

// --- Crosshair spanning both panes, driven by real pointer events ----------
const crosshairLayer = svg.append("g").attr("transform", `translate(${margin.left},${margin.top})`);
const crosshairLine = crosshairLayer
  .append("line")
  .attr("y1", 0)
  .attr("y2", priceHeight + paneGap + volumeHeight)
  .attr("stroke", t.ink)
  .attr("stroke-width", 1)
  .attr("opacity", 0);

const tooltip = crosshairLayer.append("g").attr("opacity", 0);
const tooltipBg = tooltip
  .append("rect")
  .attr("fill", t.elevatedBg)
  .attr("stroke", t.grid)
  .attr("rx", 8)
  .attr("filter", "url(#tooltip-shadow)");
const tooltipText = tooltip
  .append("text")
  .attr("fill", t.ink)
  .style("font-size", "14px")
  .style("font-family", "monospace");

function updateTooltip(i) {
  const d = data[i];
  const cx = x(i) + x.bandwidth() / 2;
  crosshairLine.attr("x1", cx).attr("x2", cx);

  tooltipText.selectAll("tspan").remove();
  const fmt = d3.format("$,.2f");
  const arrow = isUp(d) ? "▲" : "▼"; // secondary up/down cue, redundant with hue
  const lines = [
    d3.timeFormat("%b %d, %Y")(d.date),
    `O ${fmt(d.open)}  H ${fmt(d.high)}`,
    `L ${fmt(d.low)}  C ${fmt(d.close)} ${arrow}`,
    `Vol ${d3.format(",")(d.volume)}`,
  ];
  lines.forEach((line, li) => {
    const tspan = tooltipText.append("tspan").attr("x", 14).attr("y", 20 + li * 19).text(line);
    if (li === 2) tspan.attr("fill", colorFor(d));
  });

  const boxWidth = 220;
  const boxHeight = lines.length * 19 + 16;
  const tooltipX = Math.min(cx + 16, plotWidth - boxWidth);
  tooltip.attr("transform", `translate(${Math.max(0, tooltipX)},4)`);
  tooltipBg.attr("width", boxWidth).attr("height", boxHeight);
}

const overlay = crosshairLayer
  .append("rect")
  .attr("width", plotWidth)
  .attr("height", priceHeight + paneGap + volumeHeight)
  .attr("fill", "transparent")
  .style("cursor", "crosshair");

overlay
  .on("pointerenter", () => {
    crosshairLine.attr("opacity", 1);
    tooltip.attr("opacity", 1);
  })
  .on("pointerleave", () => {
    crosshairLine.attr("opacity", 0);
    tooltip.attr("opacity", 0);
  })
  .on("pointermove", (event) => {
    const [mx] = d3.pointer(event, overlay.node());
    const i = Math.max(0, Math.min(data.length - 1, Math.floor(mx / x.step())));
    updateTooltip(i);
  });

// --- Title -------------------------------------------------------------------
svg
  .append("text")
  .attr("x", width / 2)
  .attr("y", 46)
  .attr("text-anchor", "middle")
  .attr("fill", t.ink)
  .style("font-size", "22px")
  .style("font-weight", "600")
  .text("NovaTech 2024 · candlestick-volume · javascript · d3 · anyplot.ai");
Runnable source as JSON, for any HTTP client: https://api.anyplot.ai/specs/candlestick-volume/d3/code. Any spec id and library id listed in llms-full.txt fit the same URL shape; every URL below is complete and callable.
{
  "spec_id": "candlestick-volume",
  "language": "javascript",
  "library": "d3",
  "page": "https://anyplot.ai/candlestick-volume/javascript/d3",
  "hub": "https://anyplot.ai/candlestick-volume",
  "code_json": "https://api.anyplot.ai/specs/candlestick-volume/d3/code",
  "spec_json": "https://api.anyplot.ai/specs/candlestick-volume",
  "render_light_png": "https://storage.googleapis.com/anyplot-images/plots/candlestick-volume/javascript/d3/plot-light.png",
  "render_dark_png": "https://storage.googleapis.com/anyplot-images/plots/candlestick-volume/javascript/d3/plot-dark.png",
  "interactive_light_html": "https://storage.googleapis.com/anyplot-images/plots/candlestick-volume/javascript/d3/plot-light.html",
  "interactive_dark_html": "https://storage.googleapis.com/anyplot-images/plots/candlestick-volume/javascript/d3/plot-dark.html",
  "quality_score": 93.0,
  "license": "MIT",
  "guide": "https://anyplot.ai/llms.txt"
}
Part of Stock Candlestick Chart with Volume on anyplot.ai.