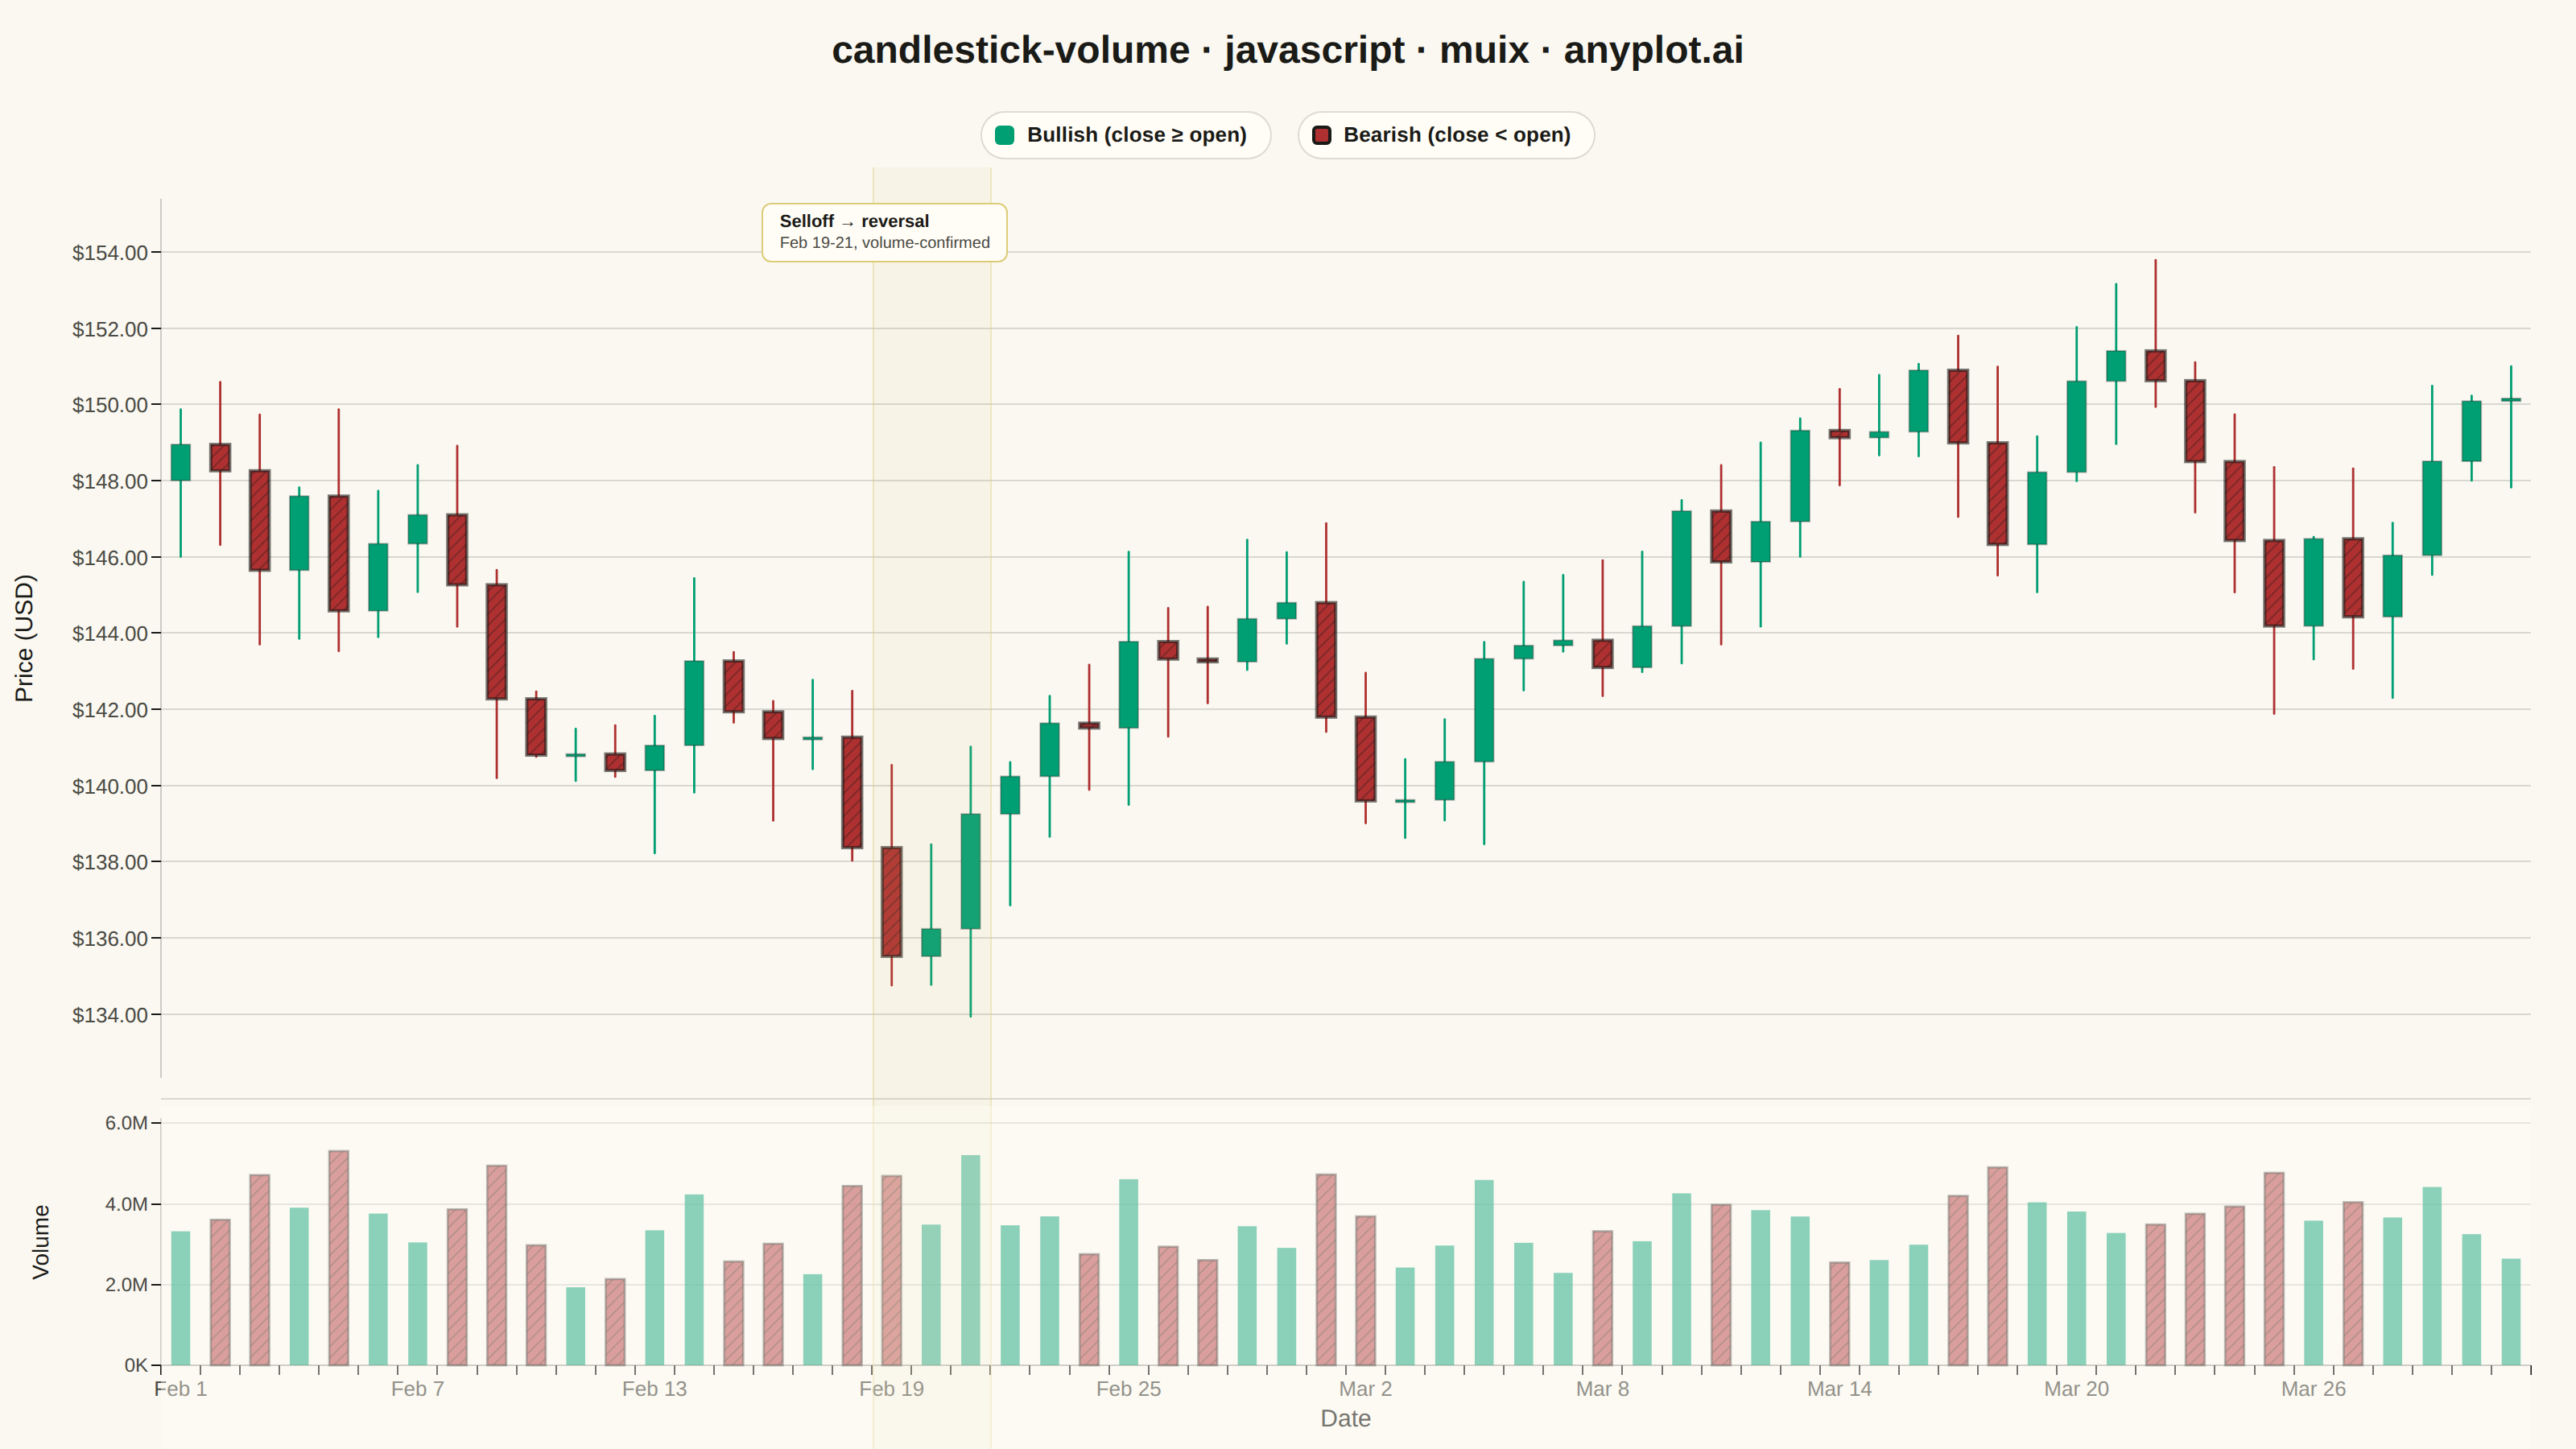
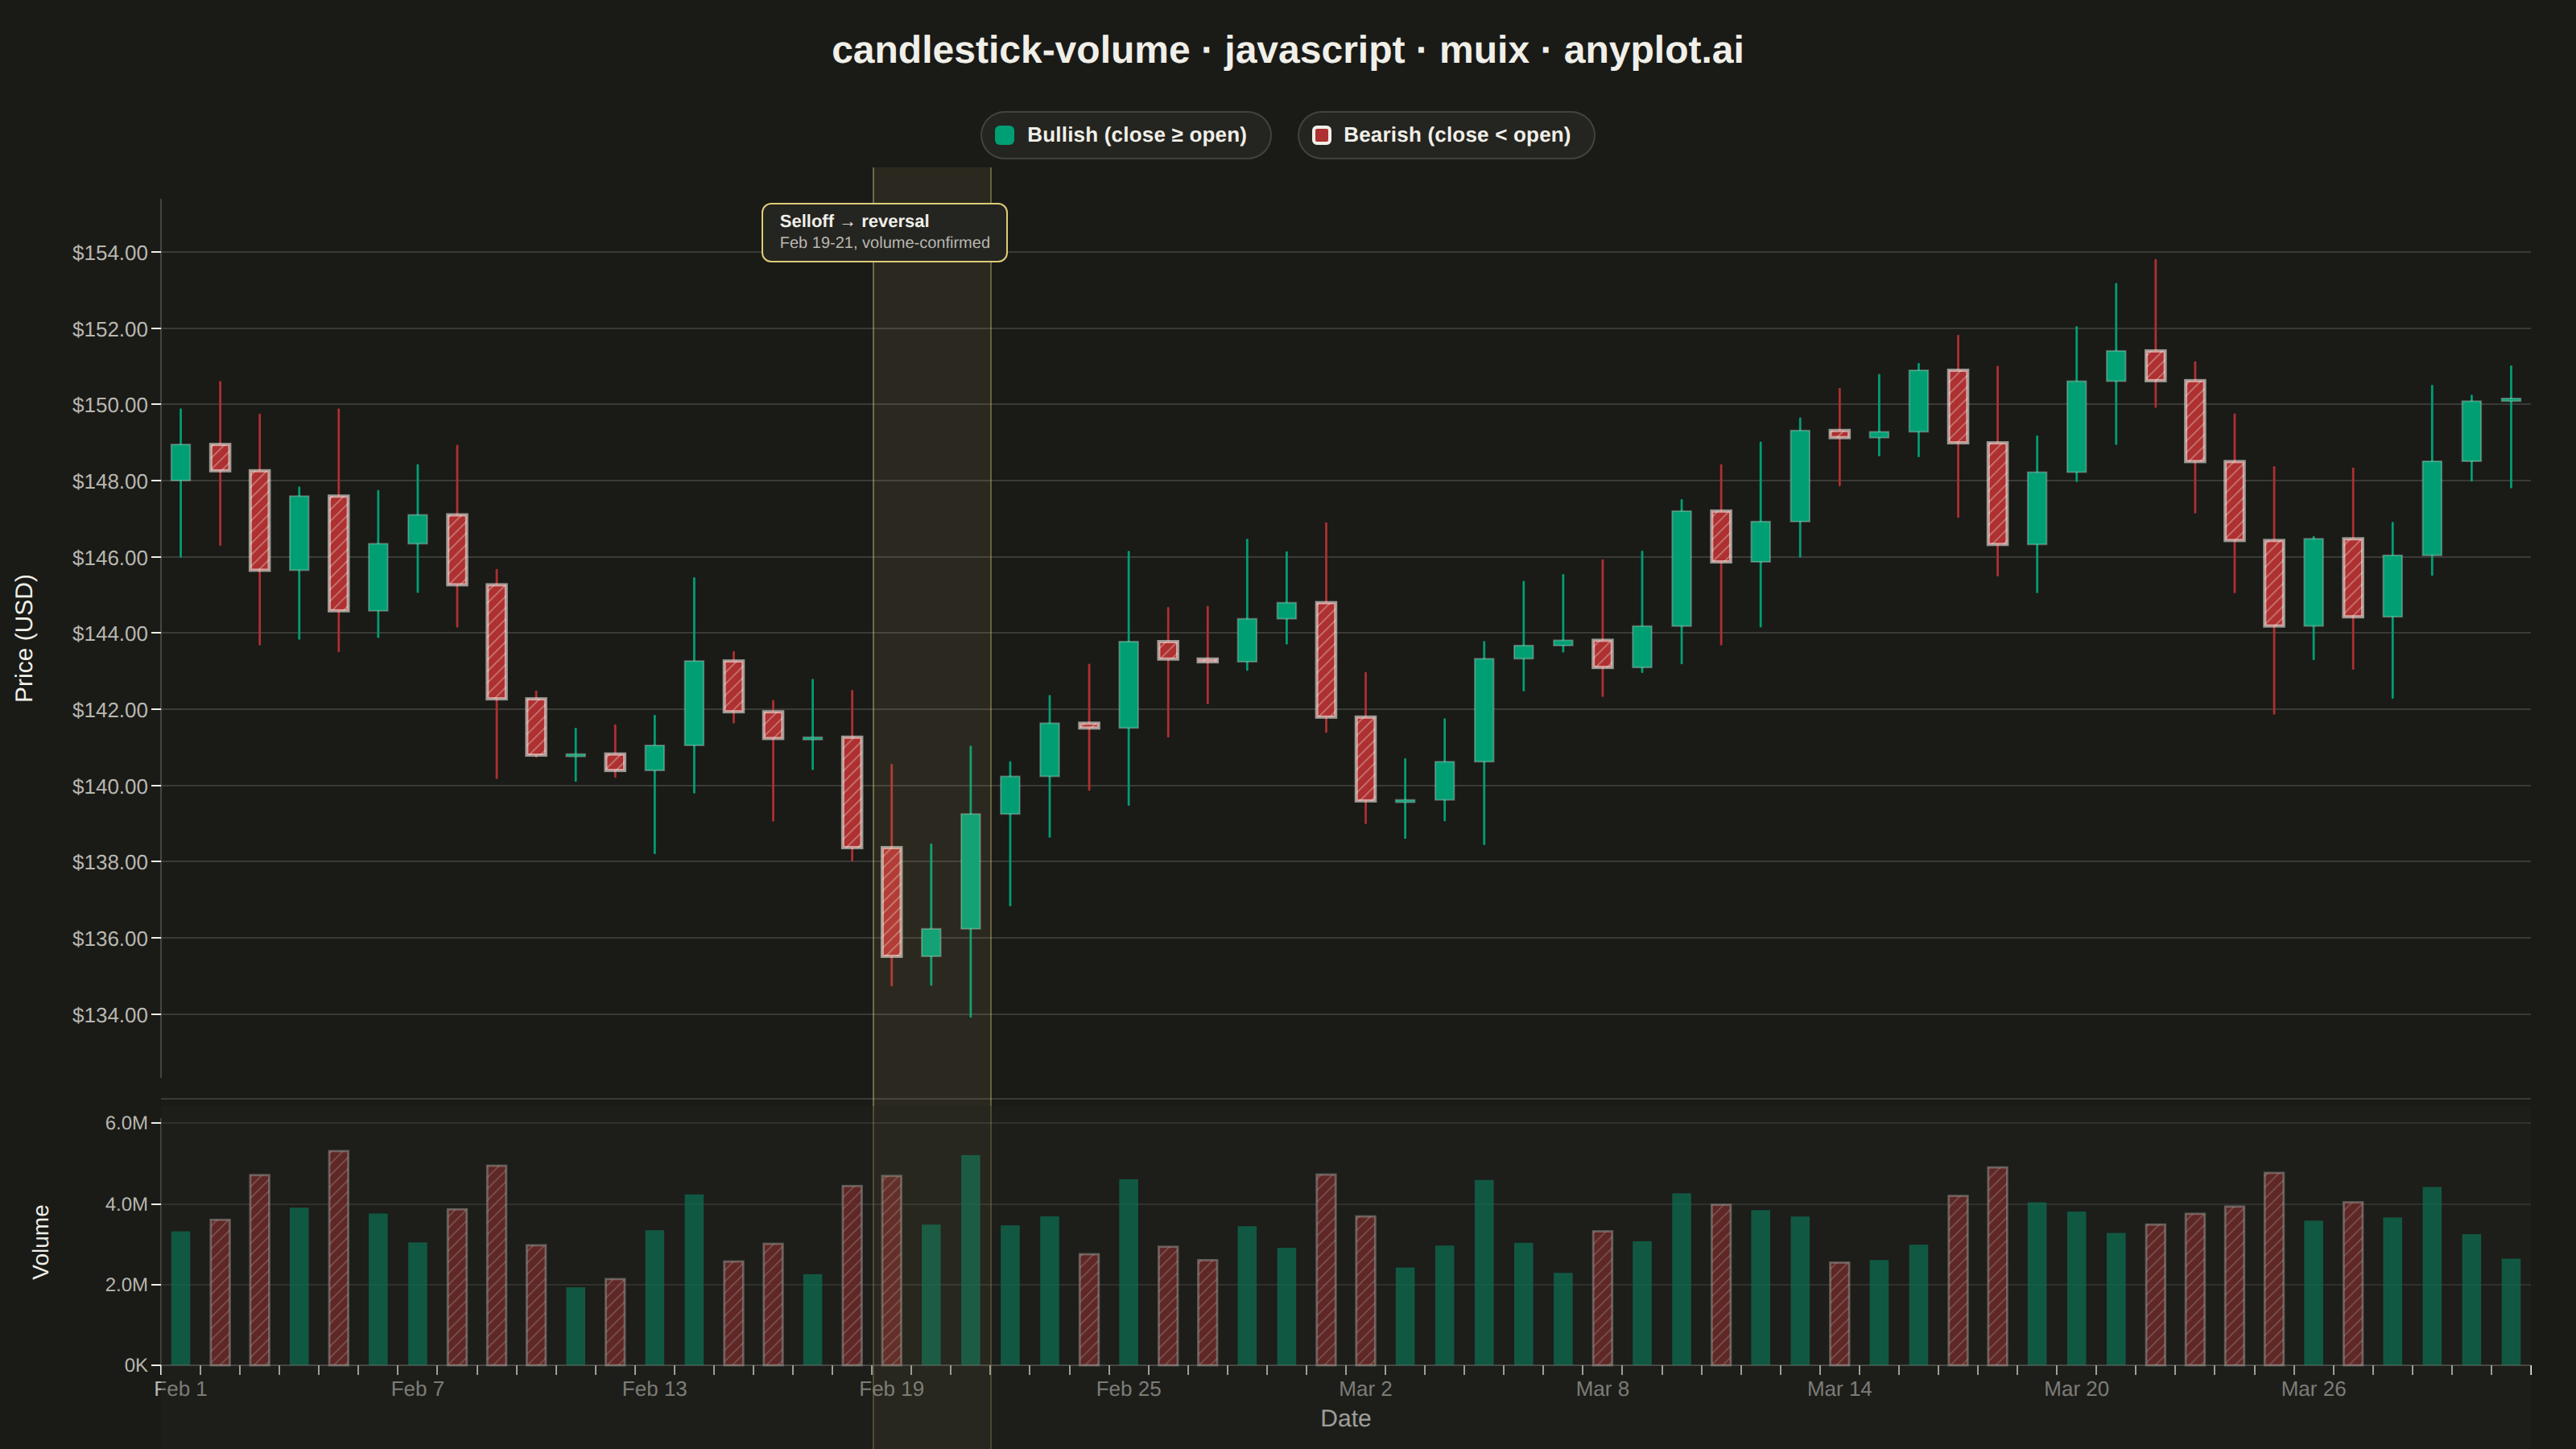
The same plot in 14 other libraries — JavaScript: Chart.js, D3.js, Apache ECharts, Highcharts; Python: Altair, Bokeh, lets-plot, Matplotlib, Plotly, plotnine, Pygal, Seaborn; R: ggplot2; Julia: Makie.jl. Compare all 15 side by side: Stock Candlestick Chart with Volume in Python, R, Julia and JavaScript.
A professional candlestick chart combining OHLC (open, high, low, close) price data with volume bars in a synchronized lower pane. The dual-pane layout presents price action in the main chart with corresponding trading volume below, sharing a common time axis. This format is the standard for technical analysis platforms, enabling traders to correlate price movements with trading activity and identify volume-confirmed trends or reversals.
// anyplot.ai
// candlestick-volume: Stock Candlestick Chart with Volume
// Library: muix 7.29.1 | JavaScript 22.23.2
// Quality: 94/100 | Created: 2026-09-02
import { useState } from "react";
import { ChartContainer } from "@mui/x-charts/ChartContainer";
import { ChartsXAxis } from "@mui/x-charts/ChartsXAxis";
import { ChartsYAxis } from "@mui/x-charts/ChartsYAxis";
import { ChartsGrid } from "@mui/x-charts/ChartsGrid";
import { useXScale, useYScale } from "@mui/x-charts/hooks";
import Box from "@mui/material/Box";
import Typography from "@mui/material/Typography";
const t = window.ANYPLOT_TOKENS;
// --- Data (in-memory, deterministic LCG PRNG — no fetch, no Math.random) ----
let seed = 11;
function rand() {
seed = (seed * 1103515245 + 12345) & 0x7fffffff;
return seed / 0x7fffffff;
}
const PERIODS = 60; // daily candles, ~3 trading months
const open: number[] = [];
const high: number[] = [];
const low: number[] = [];
const close: number[] = [];
const volume: number[] = [];
let price = 148; // opening price, USD
for (let i = 0; i < PERIODS; i++) {
const o = price;
const drift = (rand() - 0.5) * 6.2;
const c = Math.max(20, o + drift);
const h = Math.max(o, c) + rand() * 2.4;
const l = Math.max(Math.min(o, c) - rand() * 2.4, 1);
const move = Math.abs(c - o) + (h - l);
const vol = Math.round(1.4e6 + move * 3.6e5 + rand() * 6e5);
open.push(o);
high.push(h);
low.push(l);
close.push(c);
volume.push(vol);
price = c;
}
// Fixed calendar anchor (deterministic — not the render-time clock).
const START = new Date(2024, 1, 1);
const dateLabels: string[] = [];
const fullDateLabels: string[] = [];
for (let i = 0; i < PERIODS; i++) {
const d = new Date(START);
d.setDate(d.getDate() + i);
dateLabels.push(
d.toLocaleDateString("en-US", { month: "short", day: "numeric" }),
);
fullDateLabels.push(
d.toLocaleDateString("en-US", {
month: "short",
day: "numeric",
year: "numeric",
}),
);
}
const priceMin = Math.min(...low);
const priceMax = Math.max(...high);
const pricePad = (priceMax - priceMin) * 0.08;
const volumeMax = Math.max(...volume);
const fmtUsd = (v: number) => `$${v.toFixed(2)}`;
const fmtVolume = (v: number) =>
v >= 1e6 ? `${(v / 1e6).toFixed(1)}M` : `${Math.round(v / 1e3)}K`;
// --- Candlesticks: MUI X community has no native candlestick series — draw
// against the shared band scale via useXScale/useYScale, the documented
// ChartContainer composition pattern for chart types outside the community
// surface. Bullish (close >= open) bodies are brand green, bearish bodies
// matte red — the finance up/down semantic exception from the style guide.
function Candlesticks() {
const xScale = useXScale("x") as any;
const yScale = useYScale("yPrice") as any;
if (!xScale || !yScale) return null;
const bw = xScale.bandwidth();
const bodyWidth = bw * 0.6;
return (
<g>
{/* Bearish bodies get a heavier outline + diagonal hatch on top of the
fill — a redundant (non-hue) encoding of the up/down distinction for
color-vision-deficient readers, alongside the brand green / matte red. */}
<defs>
<pattern
id="candle-bear-hatch"
width={5}
height={5}
patternUnits="userSpaceOnUse"
patternTransform="rotate(45)"
>
<line
x1={0}
y1={0}
x2={0}
y2={5}
stroke={t.ink}
strokeOpacity={0.4}
strokeWidth={1.6}
/>
</pattern>
</defs>
{dateLabels.map((label, i) => {
const cx = xScale(label) + bw / 2;
const bullish = close[i] >= open[i];
const color = bullish ? t.palette[0] : t.palette[4];
const yOpen = yScale(open[i]);
const yClose = yScale(close[i]);
const bodyTop = Math.min(yOpen, yClose);
const bodyHeight = Math.max(Math.abs(yClose - yOpen), 1.5);
return (
<g key={i}>
<line
x1={cx}
x2={cx}
y1={yScale(high[i])}
y2={yScale(low[i])}
stroke={color}
strokeWidth={1.4}
strokeLinecap="round"
/>
<rect
x={cx - bodyWidth / 2}
y={bodyTop}
width={bodyWidth}
height={bodyHeight}
fill={color}
stroke={t.ink}
strokeOpacity={bullish ? 0.3 : 0.6}
strokeWidth={bullish ? 1 : 2}
/>
{!bullish && (
<rect
x={cx - bodyWidth / 2}
y={bodyTop}
width={bodyWidth}
height={bodyHeight}
fill="url(#candle-bear-hatch)"
pointerEvents="none"
/>
)}
</g>
);
})}
</g>
);
}
// --- Volume bars: same up/down color scheme as the candlesticks above, on a
// second ChartContainer sharing the identical band domain, width, and left /
// right margins so its columns land under the matching candle.
function VolumeBars() {
const xScale = useXScale("x2") as any;
const yScale = useYScale("yVolume") as any;
if (!xScale || !yScale) return null;
const bw = xScale.bandwidth();
const barWidth = bw * 0.6;
const yZero = yScale(0);
return (
<g>
{/* Same bearish hatch overlay as the candle bodies, so the secondary
up/down encoding stays consistent between the price and volume panes. */}
<defs>
<pattern
id="volume-bear-hatch"
width={5}
height={5}
patternUnits="userSpaceOnUse"
patternTransform="rotate(45)"
>
<line
x1={0}
y1={0}
x2={0}
y2={5}
stroke={t.ink}
strokeOpacity={0.4}
strokeWidth={1.6}
/>
</pattern>
</defs>
{dateLabels.map((label, i) => {
const bullish = close[i] >= open[i];
const color = bullish ? t.palette[0] : t.palette[4];
const cx = xScale(label) + bw / 2;
const yTop = yScale(volume[i]);
const barHeight = Math.max(yZero - yTop, 1);
return (
<g key={i}>
<rect
x={cx - barWidth / 2}
y={yTop}
width={barWidth}
height={barHeight}
fill={color}
fillOpacity={0.75}
stroke={bullish ? "none" : t.ink}
strokeOpacity={bullish ? 0 : 0.5}
strokeWidth={bullish ? 0 : 1.4}
/>
{!bullish && (
<rect
x={cx - barWidth / 2}
y={yTop}
width={barWidth}
height={barHeight}
fill="url(#volume-bear-hatch)"
pointerEvents="none"
/>
)}
</g>
);
})}
</g>
);
}
export default function Chart() {
// Real cross-pane crosshair: mouse position over the shared band grid
// drives both the vertical rule and the OHLCV readout. Absent on the
// headless screenshot (no cursor at capture time) — that is expected, not
// faked; it is live in the emitted interactive HTML.
const [hoverIndex, setHoverIndex] = useState<number | null>(null);
const W = window.ANYPLOT_SIZE.width;
const H = window.ANYPLOT_SIZE.height;
const title = "candlestick-volume · javascript · muix · anyplot.ai";
const titleSize =
title.length > 67 ? Math.round((24 * 67) / title.length) : 24;
const legendItems = [
{ label: "Bullish (close ≥ open)", color: t.palette[0], bearish: false },
{ label: "Bearish (close < open)", color: t.palette[4], bearish: true },
];
const TITLE_H = 64;
const LEGEND_H = 40;
const GAP = 10;
const chartsH = H - TITLE_H - LEGEND_H;
const PRICE_H = Math.round(chartsH * 0.72); // spec: price pane ~70-75% of vertical space
const VOLUME_H = chartsH - GAP - PRICE_H; // remaining ~25-30%
const MARGIN_LEFT = 100;
const MARGIN_RIGHT = 28;
const innerWidth = W - MARGIN_LEFT - MARGIN_RIGHT;
const bandStep = innerWidth / PERIODS;
const handleMouseMove = (event: React.MouseEvent<HTMLDivElement>) => {
const rect = event.currentTarget.getBoundingClientRect();
const localX = event.clientX - rect.left;
const idx = Math.floor((localX - MARGIN_LEFT) / bandStep);
setHoverIndex(idx >= 0 && idx < PERIODS ? idx : null);
};
const crosshairX =
hoverIndex === null
? null
: MARGIN_LEFT + hoverIndex * bandStep + bandStep / 2;
const tooltipLeft =
crosshairX === null ? 0 : Math.min(Math.max(crosshairX - 100, 4), W - 216);
// Data storytelling: the Feb 19-21 selloff-into-reversal is the largest
// directional swing in the series and lines up with a volume spike — the
// spec's own framing ("identify volume-confirmed trends or reversals").
// Highlight that window across both panes instead of leaving all 60 days
// undifferentiated.
const HILITE_START = 18; // Feb 19
const HILITE_END = 20; // Feb 21 (inclusive)
const hiliteX = MARGIN_LEFT + HILITE_START * bandStep;
const hiliteWidth = (HILITE_END - HILITE_START + 1) * bandStep;
const calloutLeft = Math.min(
Math.max(hiliteX + hiliteWidth / 2 - 105, MARGIN_LEFT),
W - MARGIN_RIGHT - 210,
);
return (
<Box
sx={{
width: W,
height: H,
bgcolor: t.pageBg,
display: "flex",
flexDirection: "column",
fontFamily: "'Roboto', 'Helvetica Neue', Arial, sans-serif",
boxSizing: "border-box",
}}
>
<Box
sx={{
height: TITLE_H,
display: "flex",
alignItems: "center",
justifyContent: "center",
}}
>
<Typography sx={{ color: t.ink, fontSize: titleSize, fontWeight: 600 }}>
{title}
</Typography>
</Box>
<Box
sx={{
height: LEGEND_H,
display: "flex",
alignItems: "center",
justifyContent: "center",
gap: "16px",
}}
>
{legendItems.map((item) => (
<Box
key={item.label}
sx={{
display: "flex",
alignItems: "center",
gap: "8px",
bgcolor: t.elevatedBg,
border: `1px solid ${t.grid}`,
borderRadius: "999px",
padding: "4px 14px 4px 8px",
}}
>
<Box
sx={{
width: 12,
height: 12,
borderRadius: "3px",
bgcolor: item.color,
border: item.bearish
? `2px solid ${t.ink}`
: `2px solid transparent`,
}}
/>
<Typography
sx={{
color: t.ink,
fontSize: 13,
fontWeight: 600,
letterSpacing: "0.1px",
}}
>
{item.label}
</Typography>
</Box>
))}
</Box>
<Box
sx={{ position: "relative" }}
onMouseMove={handleMouseMove}
onMouseLeave={() => setHoverIndex(null)}
>
{/* Data-storytelling highlight: brackets the volume-confirmed
selloff/reversal window so it reads before the reader scans every
candle — painted first so bars/candles render on top of it. */}
<Box
sx={{
position: "absolute",
top: 0,
left: hiliteX,
width: hiliteWidth,
height: PRICE_H + GAP + VOLUME_H,
bgcolor: t.amber,
opacity: 0.09,
pointerEvents: "none",
}}
/>
<Box
sx={{
position: "absolute",
top: 0,
left: hiliteX,
width: "1px",
height: PRICE_H + GAP + VOLUME_H,
bgcolor: t.amber,
opacity: 0.4,
pointerEvents: "none",
}}
/>
<Box
sx={{
position: "absolute",
top: 0,
left: hiliteX + hiliteWidth,
width: "1px",
height: PRICE_H + GAP + VOLUME_H,
bgcolor: t.amber,
opacity: 0.4,
pointerEvents: "none",
}}
/>
<Box
sx={{
position: "absolute",
top: 22,
left: calloutLeft,
maxWidth: 210,
bgcolor: t.elevatedBg,
border: `1px solid ${t.amber}`,
borderRadius: "6px",
padding: "4px 10px",
pointerEvents: "none",
}}
>
<Typography
sx={{ fontSize: 11, fontWeight: 700, color: t.ink, lineHeight: 1.3 }}
>
Selloff → reversal
</Typography>
<Typography sx={{ fontSize: 10, color: t.inkSoft, lineHeight: 1.3 }}>
Feb 19-21, volume-confirmed
</Typography>
</Box>
{/* Subtle tint on the volume pane's plot area delineates it from the
price pane above, beyond the shared divider rule. */}
<Box
sx={{
position: "absolute",
top: PRICE_H + GAP,
left: MARGIN_LEFT,
width: W - MARGIN_LEFT - MARGIN_RIGHT,
height: VOLUME_H,
bgcolor: t.elevatedBg,
opacity: 0.4,
pointerEvents: "none",
}}
/>
<ChartContainer
width={W}
height={PRICE_H}
skipAnimation
series={[]}
xAxis={[{ id: "x", scaleType: "band", data: dateLabels }]}
yAxis={[
{
id: "yPrice",
min: priceMin - pricePad,
max: priceMax + pricePad,
label: "Price (USD)",
valueFormatter: fmtUsd,
tickLabelStyle: { fontSize: 13, fill: t.inkSoft },
labelStyle: { fontSize: 15, fill: t.ink },
},
]}
margin={{
top: 20,
bottom: 8,
left: MARGIN_LEFT,
right: MARGIN_RIGHT,
}}
sx={{
"& .MuiChartsAxis-line": { stroke: t.inkSoft, strokeOpacity: 0.2 },
"& .MuiChartsGrid-line": { stroke: t.grid },
}}
>
<ChartsGrid horizontal />
<Candlesticks />
<ChartsYAxis axisId="yPrice" slotProps={{ axisLabel: { x: -80 } }} />
</ChartContainer>
<Box
sx={{
height: GAP,
display: "flex",
alignItems: "center",
marginLeft: `${MARGIN_LEFT}px`,
marginRight: `${MARGIN_RIGHT}px`,
}}
>
<Box sx={{ flex: 1, height: "1px", bgcolor: t.grid }} />
</Box>
<ChartContainer
width={W}
height={VOLUME_H}
skipAnimation
series={[]}
xAxis={[
{
id: "x2",
scaleType: "band",
data: dateLabels,
label: "Date",
tickLabelInterval: (_value: string, index: number) =>
index % 6 === 0,
tickLabelStyle: { fontSize: 13, fill: t.inkSoft },
labelStyle: { fontSize: 15, fill: t.ink },
},
]}
yAxis={[
{
id: "yVolume",
min: 0,
max: volumeMax * 1.15,
label: "Volume",
valueFormatter: fmtVolume,
tickLabelStyle: { fontSize: 12, fill: t.inkSoft },
labelStyle: { fontSize: 14, fill: t.ink },
},
]}
margin={{
top: 8,
bottom: 52,
left: MARGIN_LEFT,
right: MARGIN_RIGHT,
}}
sx={{
"& .MuiChartsAxis-line": { stroke: t.inkSoft, strokeOpacity: 0.2 },
"& .MuiChartsGrid-line": { stroke: t.grid },
}}
>
<ChartsGrid horizontal />
<VolumeBars />
<ChartsXAxis axisId="x2" />
<ChartsYAxis axisId="yVolume" slotProps={{ axisLabel: { x: -70 } }} />
</ChartContainer>
{crosshairX !== null && (
<Box
sx={{
position: "absolute",
top: 0,
left: crosshairX,
width: "1px",
height: PRICE_H + GAP + VOLUME_H,
bgcolor: t.ink,
opacity: 0.45,
pointerEvents: "none",
}}
/>
)}
{hoverIndex !== null && (
<Box
sx={{
position: "absolute",
top: 8,
left: tooltipLeft,
bgcolor: t.elevatedBg,
border: `1px solid ${t.grid}`,
borderRadius: "6px",
padding: "8px 14px",
pointerEvents: "none",
}}
>
<Typography sx={{ fontSize: 12, fontWeight: 600, color: t.ink }}>
{fullDateLabels[hoverIndex]}
</Typography>
<Typography sx={{ fontSize: 11, color: t.inkSoft }}>
O {fmtUsd(open[hoverIndex])} H {fmtUsd(high[hoverIndex])}{" "}
L {fmtUsd(low[hoverIndex])} C{" "}
{fmtUsd(close[hoverIndex])}
</Typography>
<Typography sx={{ fontSize: 11, color: t.inkSoft }}>
Vol {fmtVolume(volume[hoverIndex])}
</Typography>
</Box>
)}
</Box>
</Box>
);
}
Runnable source as JSON, for any HTTP client: https://api.anyplot.ai/specs/candlestick-volume/muix/code. Any spec id and library id listed in llms-full.txt fit the same URL shape; every URL below is complete and callable.
{
  "spec_id": "candlestick-volume",
  "language": "javascript",
  "library": "muix",
  "page": "https://anyplot.ai/candlestick-volume/javascript/muix",
  "hub": "https://anyplot.ai/candlestick-volume",
  "code_json": "https://api.anyplot.ai/specs/candlestick-volume/muix/code",
  "spec_json": "https://api.anyplot.ai/specs/candlestick-volume",
  "render_light_png": "https://storage.googleapis.com/anyplot-images/plots/candlestick-volume/javascript/muix/plot-light.png",
  "render_dark_png": "https://storage.googleapis.com/anyplot-images/plots/candlestick-volume/javascript/muix/plot-dark.png",
  "interactive_light_html": "https://storage.googleapis.com/anyplot-images/plots/candlestick-volume/javascript/muix/plot-light.html",
  "interactive_dark_html": "https://storage.googleapis.com/anyplot-images/plots/candlestick-volume/javascript/muix/plot-dark.html",
  "quality_score": 94.0,
  "license": "MIT",
  "guide": "https://anyplot.ai/llms.txt"
}
Part of Stock Candlestick Chart with Volume on anyplot.ai.