The same plot in 14 other libraries — Python: Altair, Bokeh, lets-plot, Matplotlib, Plotly, plotnine, Seaborn; R: ggplot2; Julia: Makie.jl; JavaScript: Chart.js, D3.js, Apache ECharts, Highcharts, MUI X Charts. Compare all 15 side by side: Stock Candlestick Chart with Volume in Python, R, Julia and JavaScript.
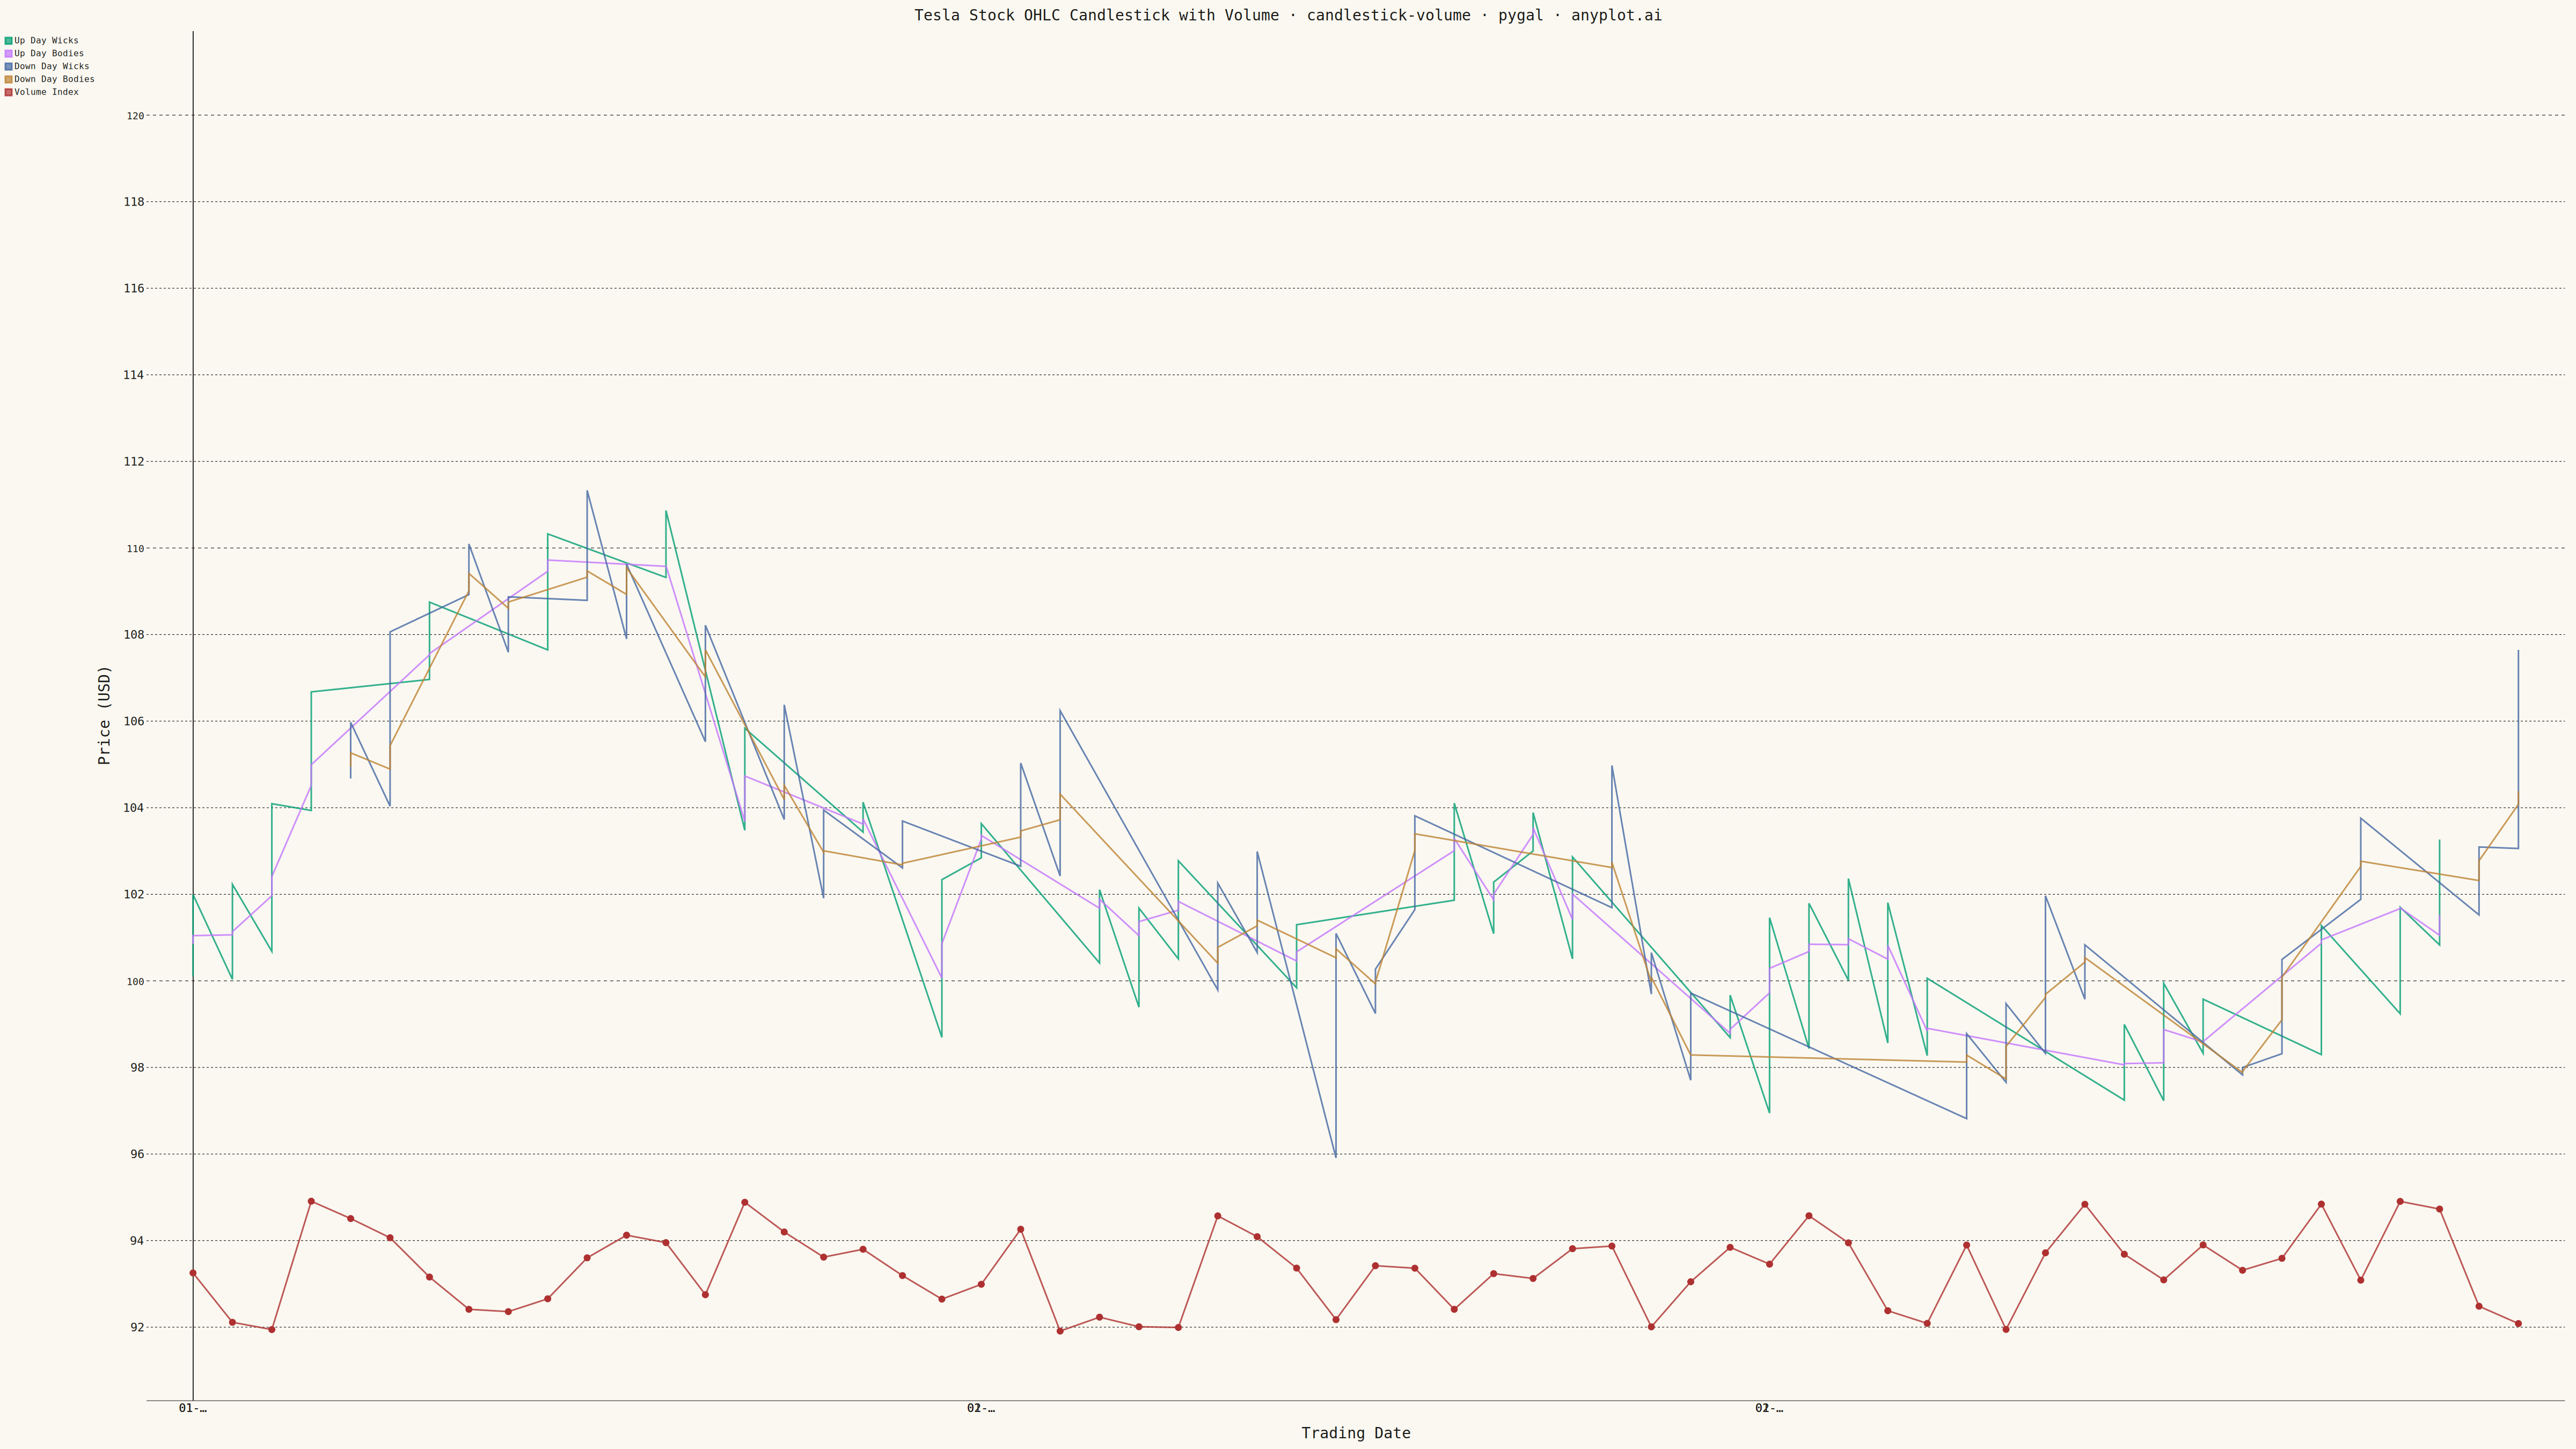
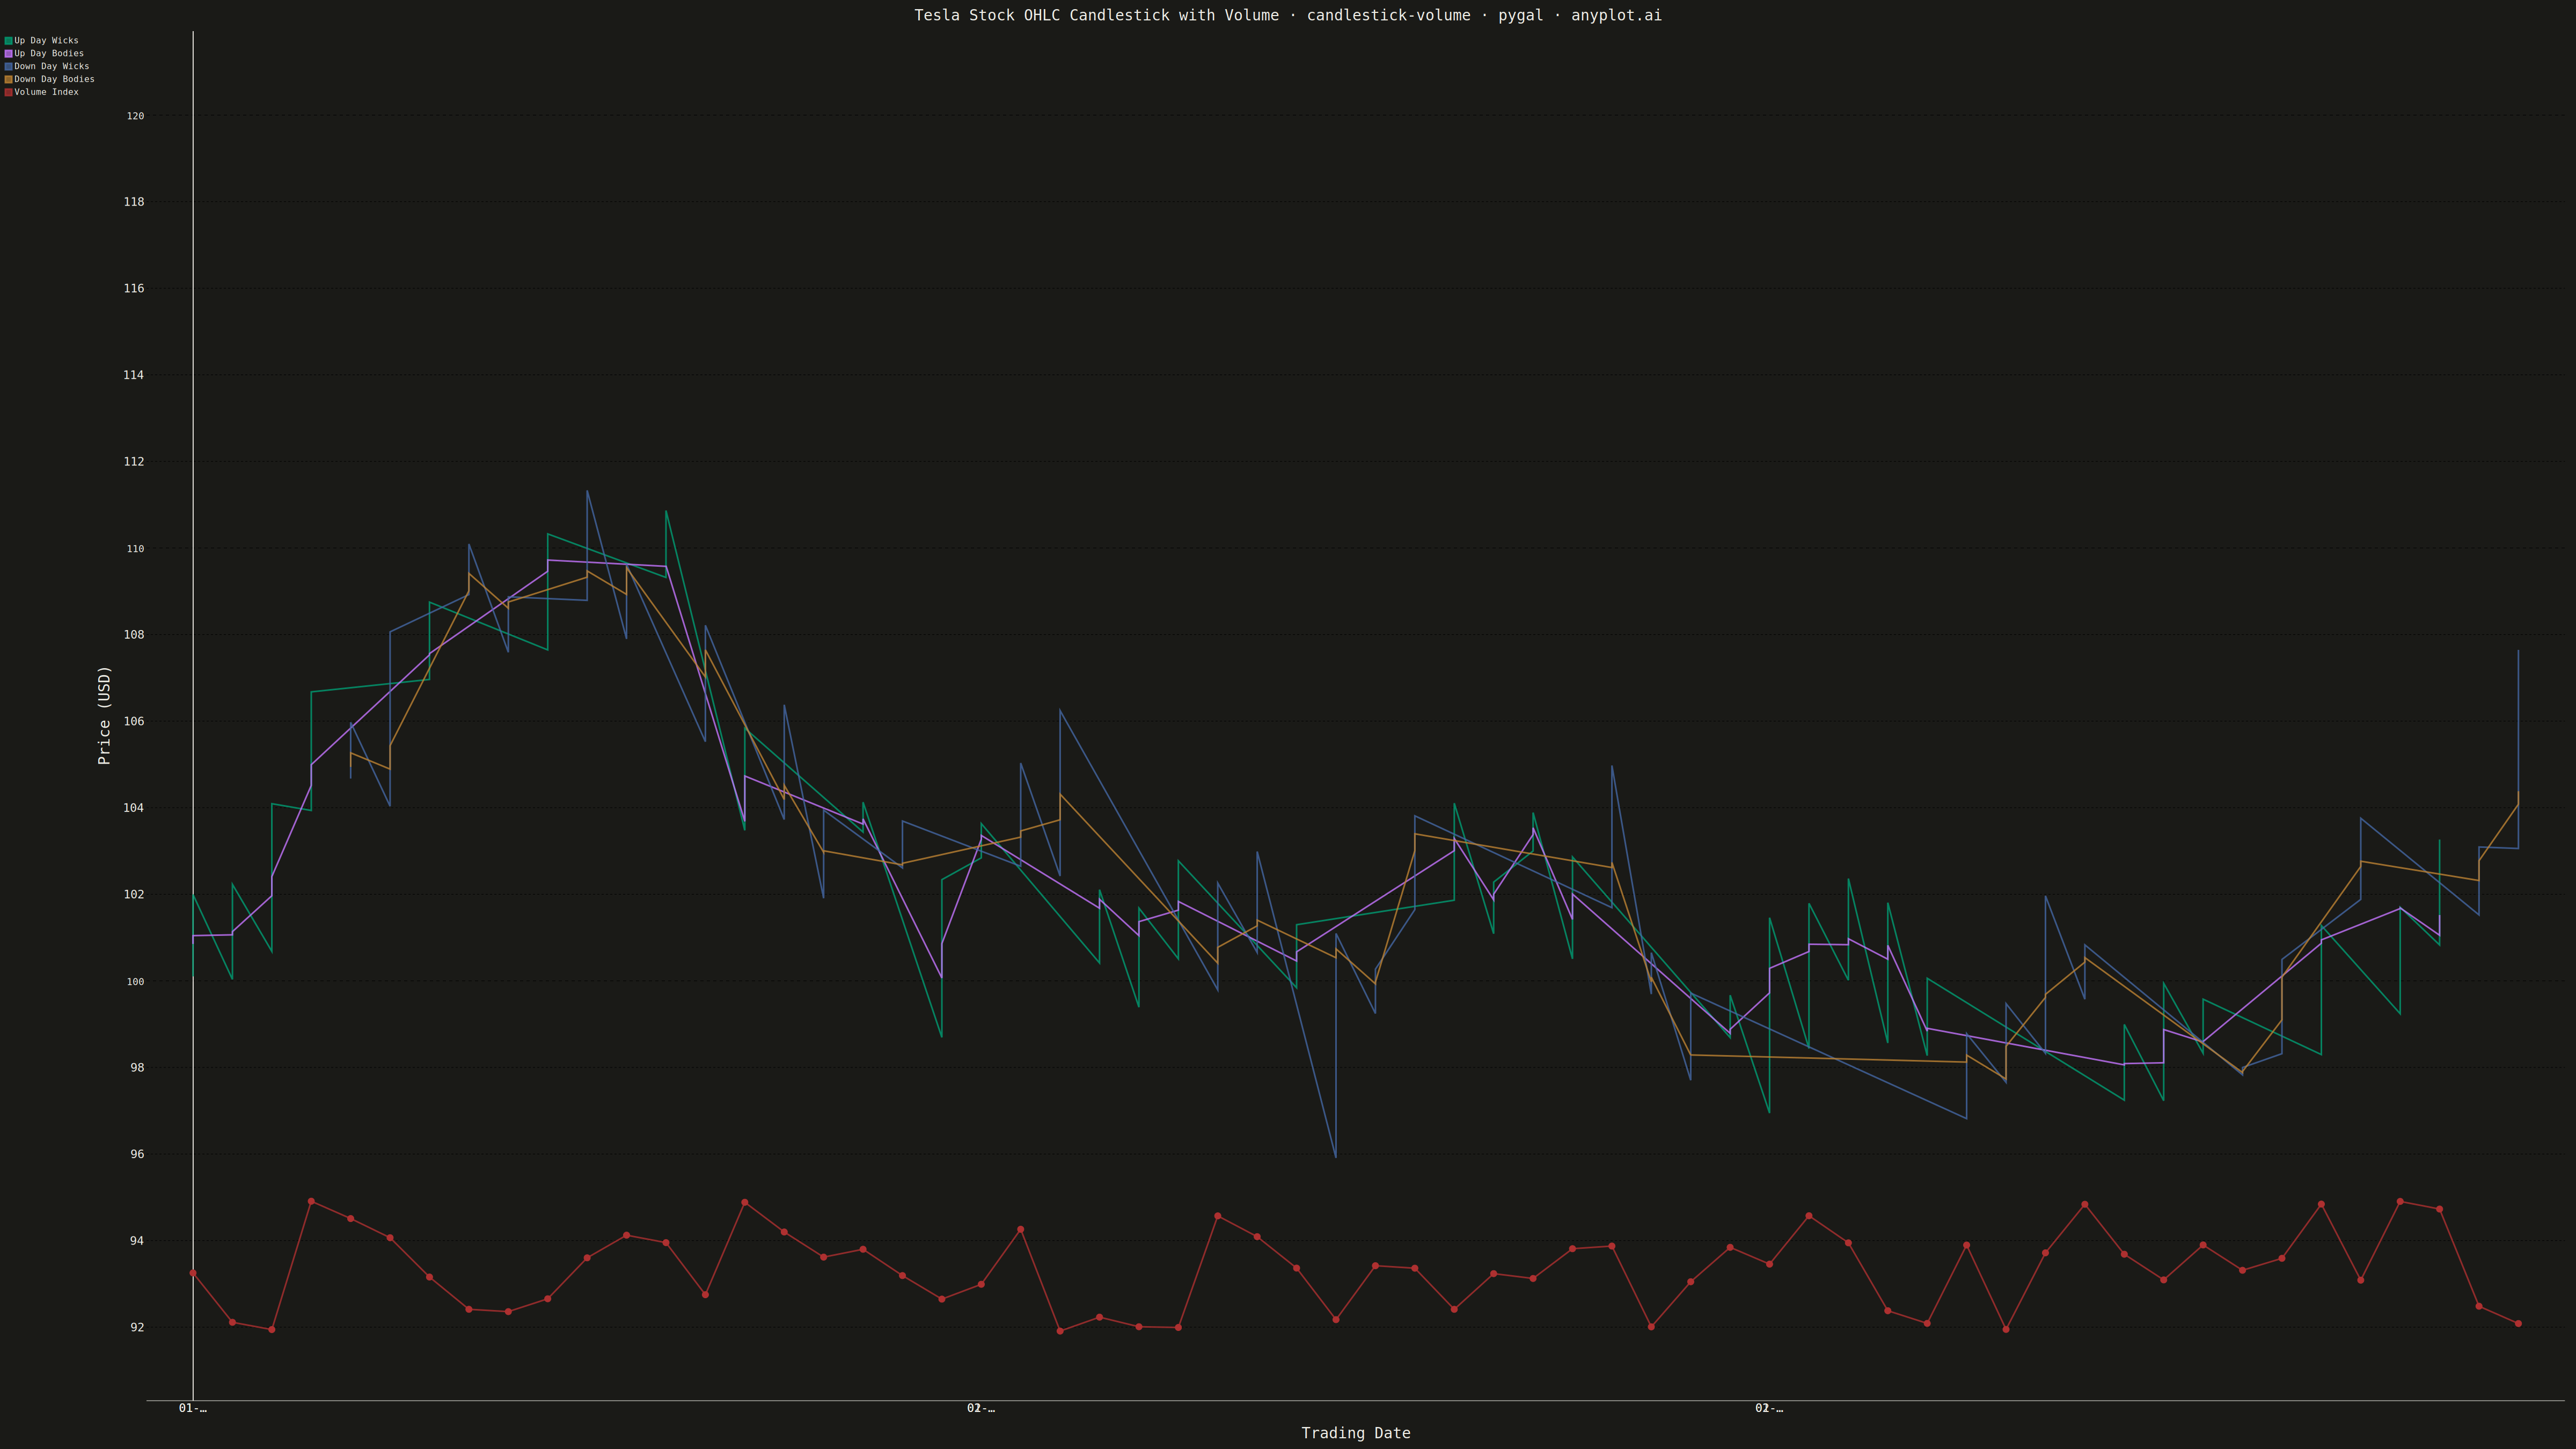
A professional candlestick chart combining OHLC (open, high, low, close) price data with volume bars in a synchronized lower pane. The dual-pane layout presents price action in the main chart with corresponding trading volume below, sharing a common time axis. This format is the standard for technical analysis platforms, enabling traders to correlate price movements with trading activity and identify volume-confirmed trends or reversals.
""" anyplot.ai
candlestick-volume: Stock Candlestick Chart with Volume
Library: pygal 3.1.0 | Python 3.13.13
Quality: 83/100 | Created: 2026-05-16
"""

import os
import sys

import numpy as np
import pandas as pd


current_dir = os.path.dirname(os.path.abspath(__file__))
sys.path = [p for p in sys.path if os.path.abspath(p) != current_dir]

import pygal
from pygal.style import Style


THEME = os.getenv("ANYPLOT_THEME", "light")
PAGE_BG = "#FAF8F1" if THEME == "light" else "#1A1A17"
INK = "#1A1A17" if THEME == "light" else "#F0EFE8"
INK_MUTED = "#6B6A63" if THEME == "light" else "#A8A79F"

UP_COLOR = "#009E73"
DOWN_COLOR = "#AE3030"  # imprint red — down days
VOLUME_COLOR = "#2ABCCD"

IMPRINT = ("#009E73", "#C475FD", "#4467A3", "#BD8233", "#AE3030", "#2ABCCD", "#954477")

np.random.seed(42)
n_periods = 60

dates = pd.date_range("2024-01-01", periods=n_periods, freq="D")
date_nums = np.arange(n_periods)

close_prices = 100 + np.cumsum(np.random.normal(0.3, 1.5, n_periods))
open_prices = close_prices + np.random.normal(0, 0.4, n_periods)
high_prices = np.maximum(open_prices, close_prices) + np.abs(np.random.normal(0, 1.2, n_periods))
low_prices = np.minimum(open_prices, close_prices) - np.abs(np.random.normal(0, 1.2, n_periods))
volumes = np.random.uniform(1e6, 4e6, n_periods)

up_mask = close_prices >= open_prices
down_mask = ~up_mask

custom_style = Style(
    background=PAGE_BG,
    plot_background=PAGE_BG,
    foreground=INK,
    foreground_strong=INK,
    foreground_subtle=INK_MUTED,
    colors=IMPRINT,
    title_font_size=28,
    label_font_size=22,
    major_label_font_size=18,
    legend_font_size=16,
    value_font_size=14,
    stroke_width=3,
)

chart = pygal.XY(
    style=custom_style,
    width=4800,
    height=2700,
    title="Tesla Stock OHLC Candlestick with Volume · candlestick-volume · pygal · anyplot.ai",
    x_title="Trading Date",
    y_title="Price (USD)",
    show_legend=True,
    show_y_guides=True,
    show_x_guides=False,
    range=(low_prices.min() - 5, high_prices.max() + 10),
)

up_wicks = []
down_wicks = []
up_bodies = []
down_bodies = []

for i in range(n_periods):
    x = float(date_nums[i])
    h = float(high_prices[i])
    low = float(low_prices[i])
    o = float(open_prices[i])
    c = float(close_prices[i])

    if up_mask[i]:
        up_wicks.append((x, low))
        up_wicks.append((x, h))
        up_wicks.append(None)
        body_min = min(o, c)
        body_max = max(o, c)
        up_bodies.append((x, body_min))
        up_bodies.append((x, body_max))
        up_bodies.append(None)
    else:
        down_wicks.append((x, low))
        down_wicks.append((x, h))
        down_wicks.append(None)
        body_min = min(o, c)
        body_max = max(o, c)
        down_bodies.append((x, body_min))
        down_bodies.append((x, body_max))
        down_bodies.append(None)

if up_wicks:
    chart.add(
        "Up Day Wicks", up_wicks, stroke_width=5, color=UP_COLOR, dots_size=0, show_only_major_dots=False, fill=False
    )
    chart.add(
        "Up Day Bodies", up_bodies, stroke_width=16, color=UP_COLOR, dots_size=0, show_only_major_dots=False, fill=False
    )

if down_wicks:
    chart.add(
        "Down Day Wicks",
        down_wicks,
        stroke_width=5,
        color=DOWN_COLOR,
        dots_size=0,
        show_only_major_dots=False,
        fill=False,
    )
    chart.add(
        "Down Day Bodies",
        down_bodies,
        stroke_width=16,
        color=DOWN_COLOR,
        dots_size=0,
        show_only_major_dots=False,
        fill=False,
    )

volume_min = low_prices.min() - 4
volume_normalized = (volumes - volumes.min()) / (volumes.max() - volumes.min()) * 3 + volume_min
volume_series = [(float(date_nums[i]), float(volume_normalized[i])) for i in range(n_periods)]
chart.add(
    "Volume Index",
    volume_series,
    stroke_width=2,
    color=VOLUME_COLOR,
    dots_size=6,
    show_only_major_dots=False,
    fill=False,
    opacity=0.7,
)

x_labels = [dates[i].strftime("%m-%d") if i % 10 == 0 else "" for i in range(n_periods)]
chart.x_labels = x_labels

chart.render_to_png(f"plot-{THEME}.png")
with open(f"plot-{THEME}.html", "wb") as f:
    f.write(chart.render())
Runnable source as JSON, for any HTTP client: https://api.anyplot.ai/specs/candlestick-volume/pygal/code. Any spec id and library id listed in llms-full.txt fit the same URL shape; every URL below is complete and callable.
{
  "spec_id": "candlestick-volume",
  "language": "python",
  "library": "pygal",
  "page": "https://anyplot.ai/candlestick-volume/python/pygal",
  "hub": "https://anyplot.ai/candlestick-volume",
  "code_json": "https://api.anyplot.ai/specs/candlestick-volume/pygal/code",
  "spec_json": "https://api.anyplot.ai/specs/candlestick-volume",
  "render_light_png": "https://storage.googleapis.com/anyplot-images/plots/candlestick-volume/python/pygal/plot-light.png",
  "render_dark_png": "https://storage.googleapis.com/anyplot-images/plots/candlestick-volume/python/pygal/plot-dark.png",
  "interactive_light_html": "https://storage.googleapis.com/anyplot-images/plots/candlestick-volume/python/pygal/plot-light.html",
  "interactive_dark_html": "https://storage.googleapis.com/anyplot-images/plots/candlestick-volume/python/pygal/plot-dark.html",
  "quality_score": 83.0,
  "license": "MIT",
  "guide": "https://anyplot.ai/llms.txt"
}
Part of Stock Candlestick Chart with Volume on anyplot.ai.