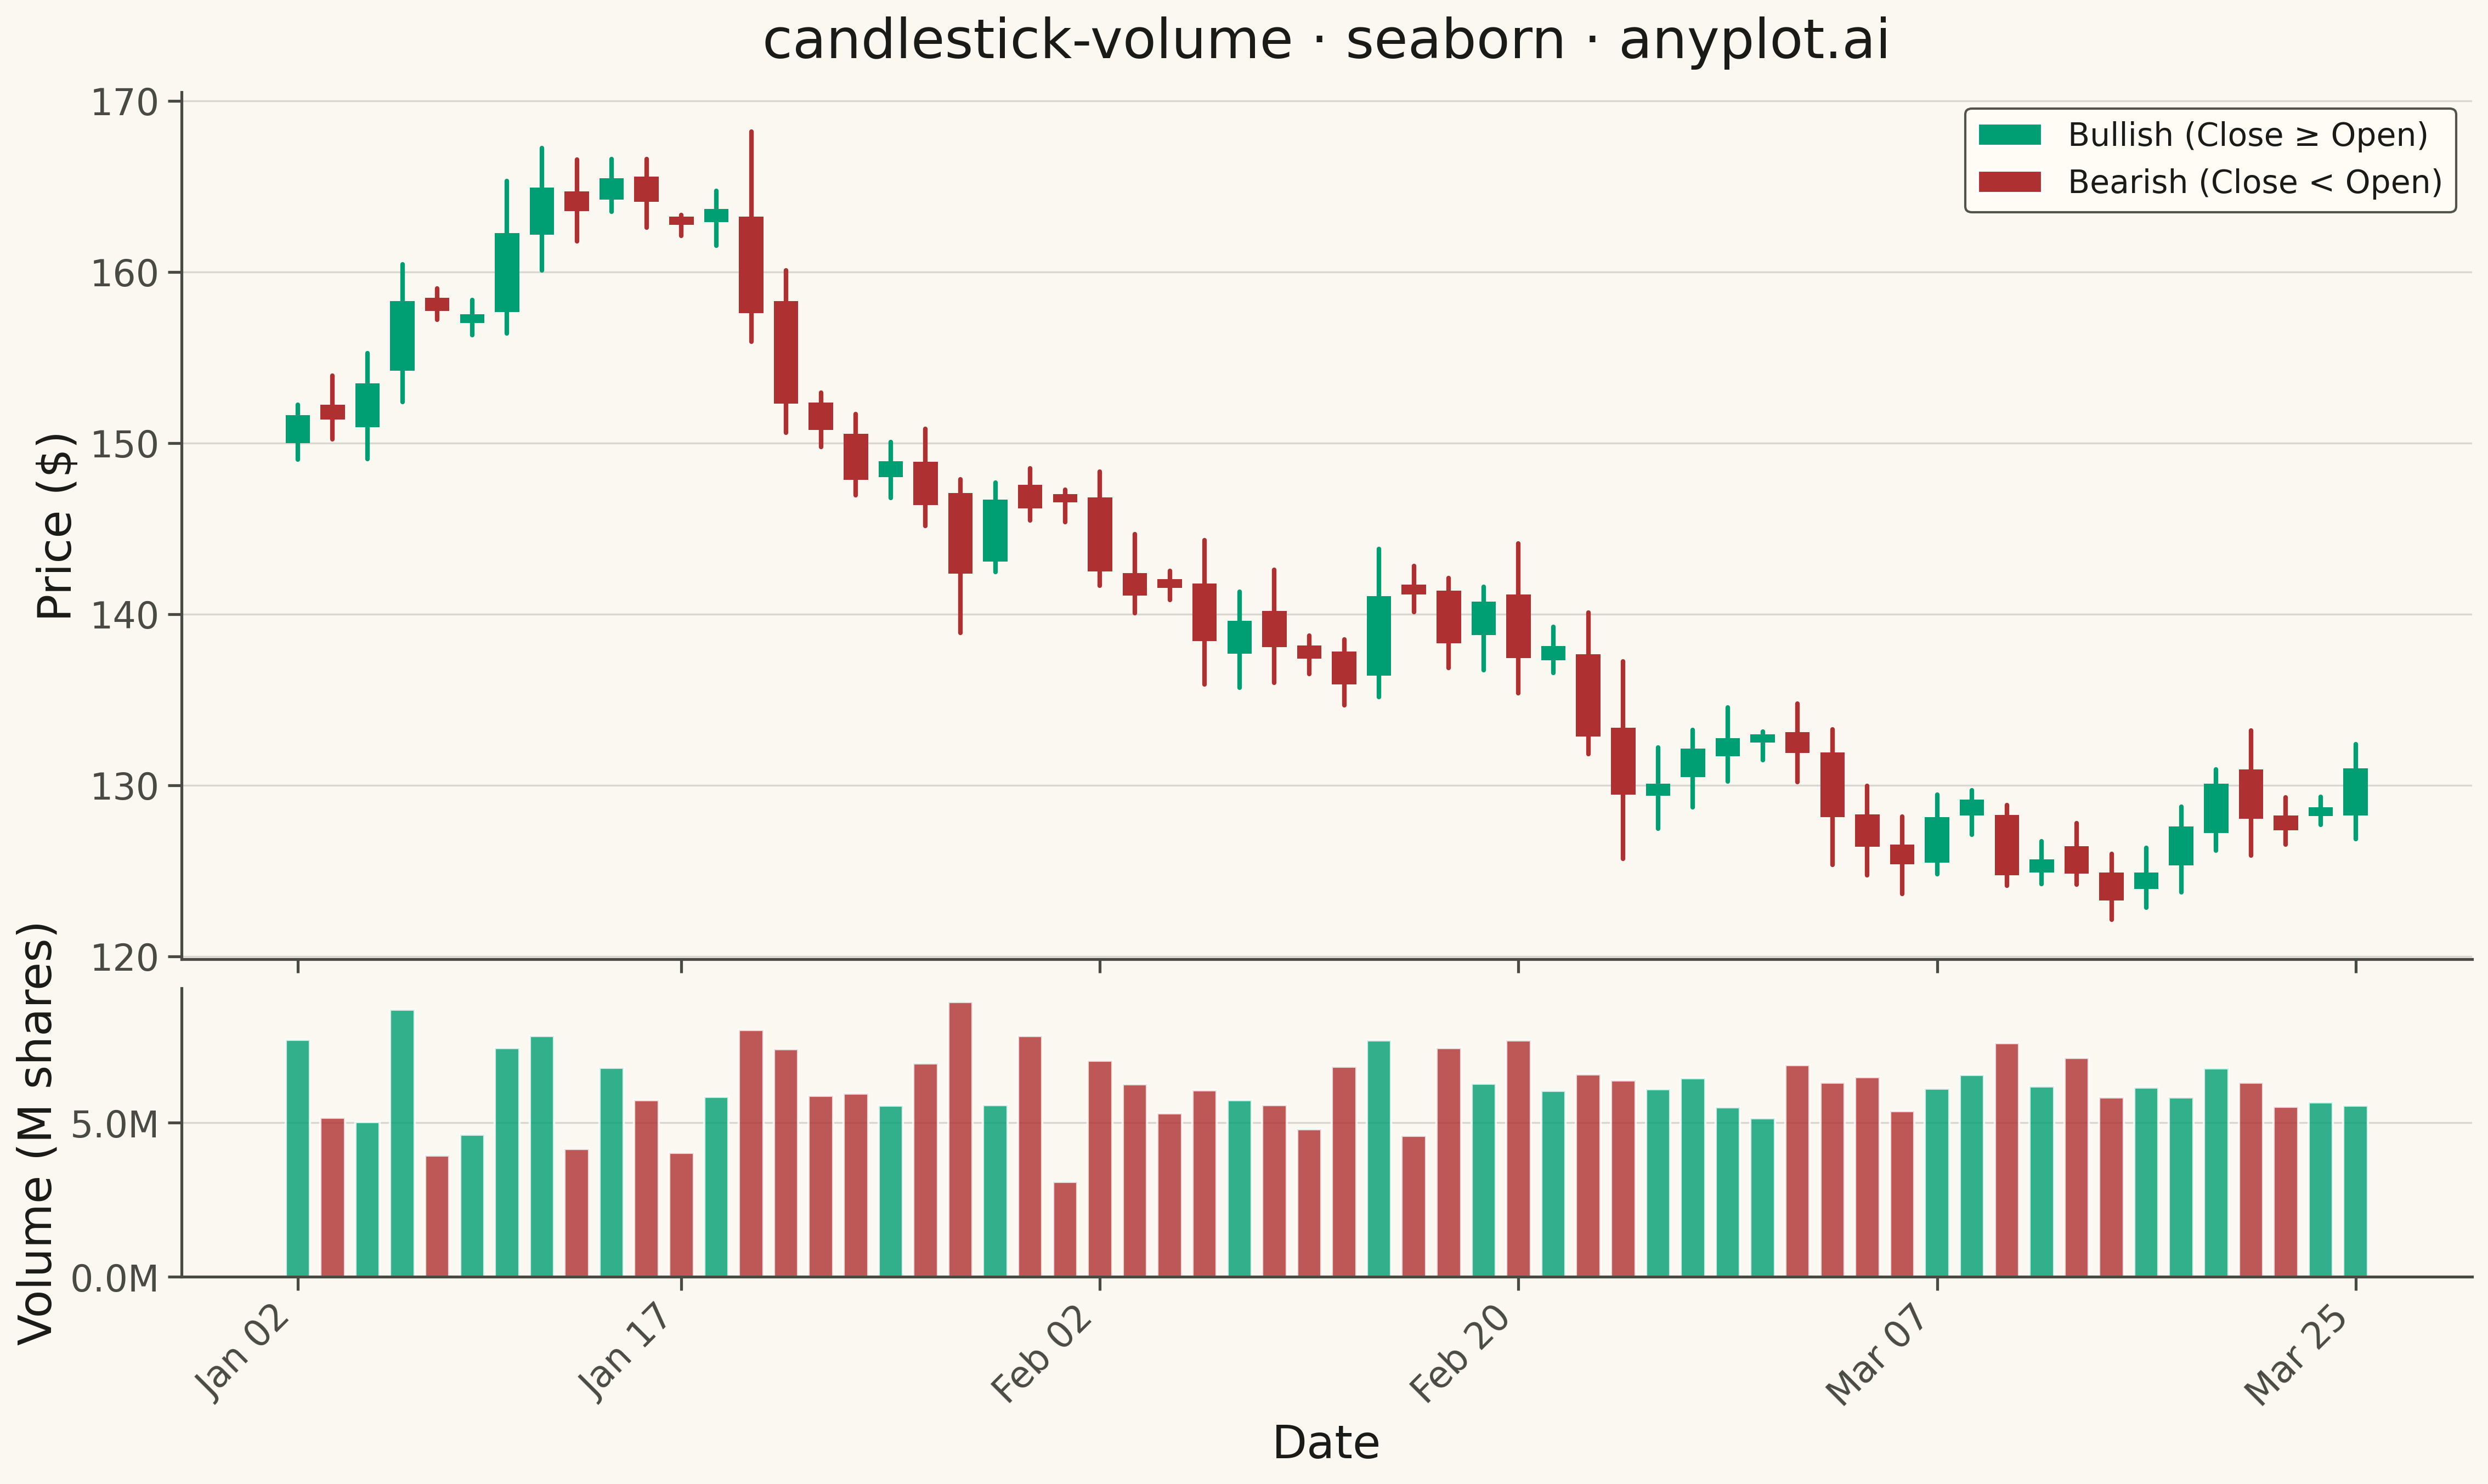
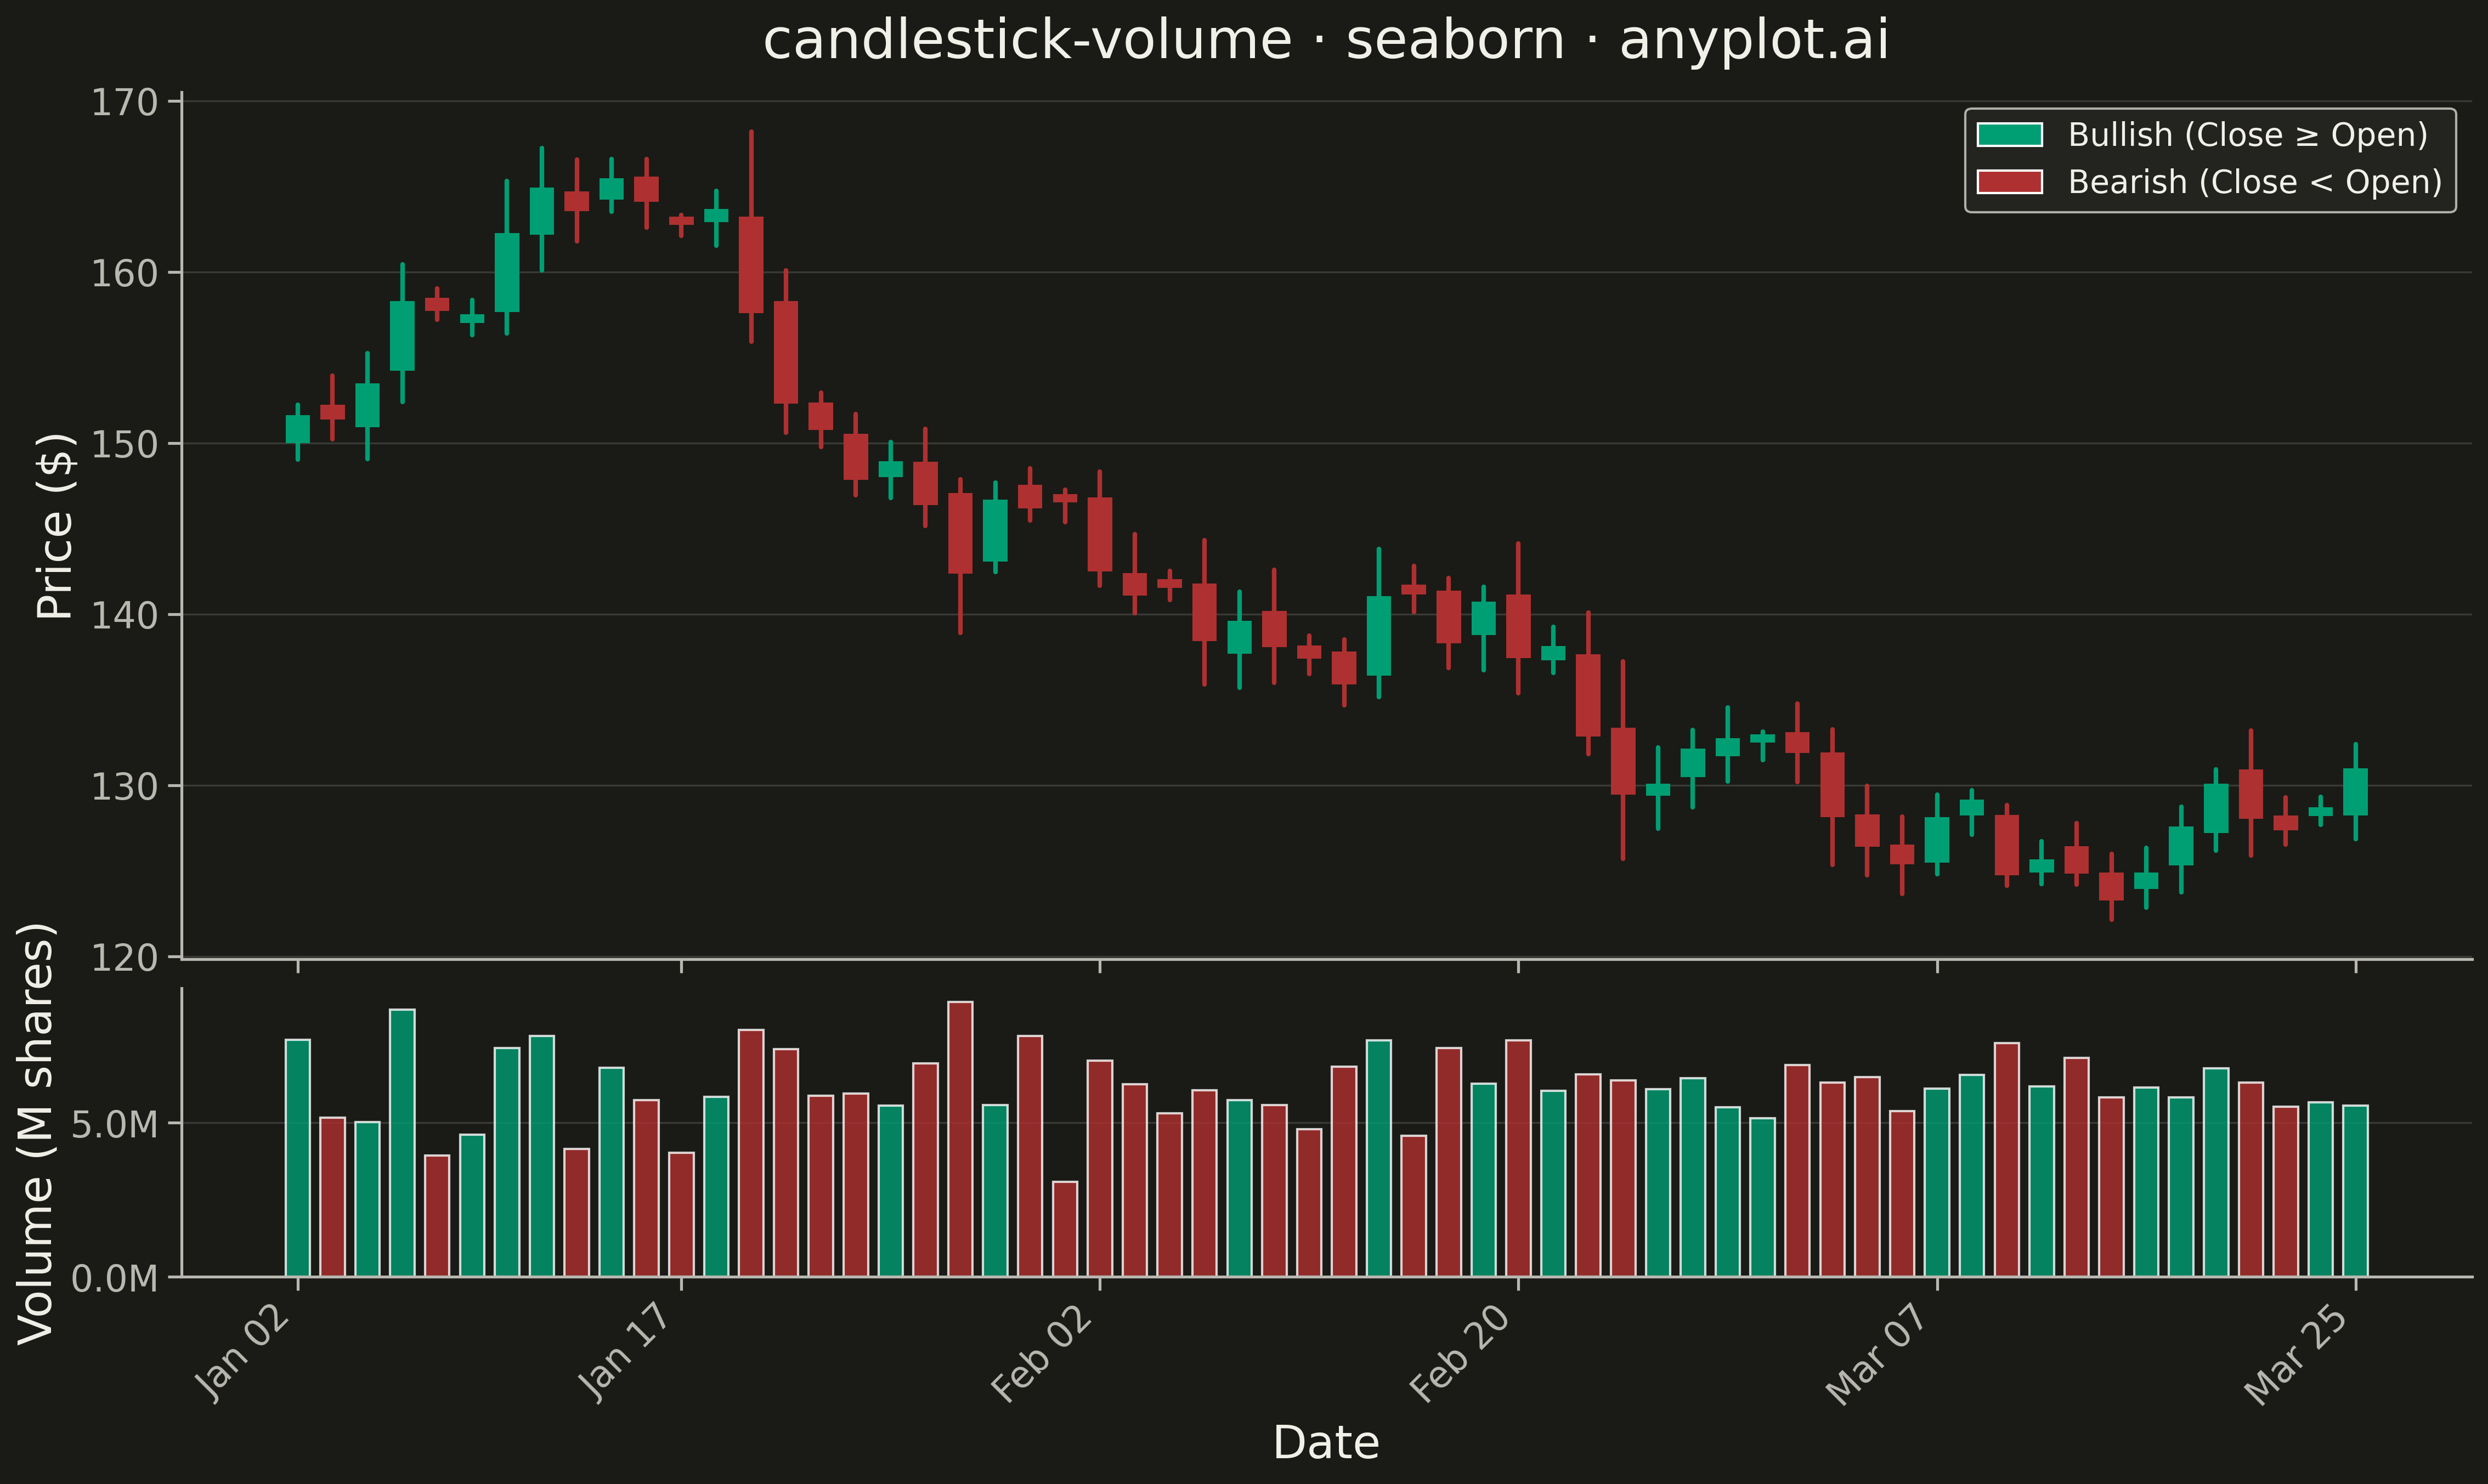
A professional candlestick chart combining OHLC (open, high, low, close) price data with volume bars in a synchronized lower pane. The dual-pane layout presents price action in the main chart with corresponding trading volume below, sharing a common time axis. This format is the standard for technical analysis platforms, enabling traders to correlate price movements with trading activity and identify volume-confirmed trends or reversals.
""" anyplot.ai
candlestick-volume: Stock Candlestick Chart with Volume
Library: seaborn 0.13.2 | Python 3.13.13
Quality: 90/100 | Updated: 2026-05-16
"""

import os
import sys
from pathlib import Path


# Remove current directory from sys.path before importing to avoid local matplotlib.py conflict
original_path = sys.path.copy()
sys.path = [p for p in sys.path if p not in ("", ".", str(Path(__file__).parent))]

import matplotlib.pyplot as plt
import numpy as np
import pandas as pd
import seaborn as sns
from matplotlib.patches import Patch


# Restore sys.path for potential relative imports later
sys.path = original_path

# Theme tokens
THEME = os.getenv("ANYPLOT_THEME", "light")
PAGE_BG = "#FAF8F1" if THEME == "light" else "#1A1A17"
ELEVATED_BG = "#FFFDF6" if THEME == "light" else "#242420"
INK = "#1A1A17" if THEME == "light" else "#F0EFE8"
INK_SOFT = "#4A4A44" if THEME == "light" else "#B8B7B0"
BRAND = "#009E73"  # imprint green — bullish
SECONDARY = "#AE3030"  # imprint red — bearish

# Apply theme-aware seaborn styling
sns.set_theme(
    style="ticks",
    rc={
        "figure.facecolor": PAGE_BG,
        "axes.facecolor": PAGE_BG,
        "axes.edgecolor": INK_SOFT,
        "axes.labelcolor": INK,
        "text.color": INK,
        "xtick.color": INK_SOFT,
        "ytick.color": INK_SOFT,
        "grid.color": INK,
        "grid.alpha": 0.10,
        "legend.facecolor": ELEVATED_BG,
        "legend.edgecolor": INK_SOFT,
    },
)

# Generate realistic stock data for 60 trading days
np.random.seed(42)
n_days = 60

dates = pd.date_range("2024-01-02", periods=n_days, freq="B")
base_price = 150.0

# Generate price series with trends and volatility
returns = np.random.normal(0.001, 0.02, n_days)
prices = base_price * np.cumprod(1 + returns)

# Generate OHLC from the price series
opens = np.zeros(n_days)
highs = np.zeros(n_days)
lows = np.zeros(n_days)
closes = np.zeros(n_days)

opens[0] = base_price
for i in range(n_days):
    if i > 0:
        opens[i] = closes[i - 1] + np.random.normal(0, 0.5)
    closes[i] = prices[i]
    daily_range = abs(closes[i] - opens[i]) + np.random.uniform(1.0, 3.0)
    highs[i] = max(opens[i], closes[i]) + np.random.uniform(0.5, daily_range * 0.6)
    lows[i] = min(opens[i], closes[i]) - np.random.uniform(0.5, daily_range * 0.6)

# Generate volume with correlation to price movements
base_volume = 5_000_000
volume = base_volume + np.random.normal(0, 1_000_000, n_days)
price_change = np.abs(closes - opens)
volume = volume + price_change * 500_000
volume = np.clip(volume, 1_000_000, 15_000_000).astype(int)

# Create DataFrame
df = pd.DataFrame({"date": dates, "open": opens, "high": highs, "low": lows, "close": closes, "volume": volume})

# Determine bullish vs bearish candles
df["bullish"] = df["close"] >= df["open"]
df["day_idx"] = range(len(df))

# Color scheme: imprint semantic anchors
bullish_color = BRAND  # #009E73 green
bearish_color = SECONDARY  # #AE3030 red

# Create figure with two subplots (75% price, 25% volume)
fig, (ax1, ax2) = plt.subplots(2, 1, figsize=(16, 9), height_ratios=[3, 1], sharex=True, gridspec_kw={"hspace": 0.05})

# Set grid below chart elements
for ax in [ax1, ax2]:
    ax.set_axisbelow(True)
    ax.set_facecolor(PAGE_BG)

# === Upper pane: Candlestick chart ===
# Prepare data for wicks
df["wick_min"] = df[["open", "close"]].min(axis=1)
df["wick_max"] = df[["open", "close"]].max(axis=1)
df["body_height"] = (df["wick_max"] - df["wick_min"]).clip(lower=0.5)
df["direction"] = df["bullish"].map({True: "Bullish", False: "Bearish"})

# Draw high-low wicks using seaborn lineplot
wick_long = pd.melt(
    df[["day_idx", "high", "low", "direction"]],
    id_vars=["day_idx", "direction"],
    value_vars=["low", "high"],
    var_name="price_type",
    value_name="price",
).sort_values(["day_idx", "price_type"])

sns.lineplot(
    data=wick_long,
    x="day_idx",
    y="price",
    hue="direction",
    palette={"Bullish": bullish_color, "Bearish": bearish_color},
    linewidth=2,
    units="day_idx",
    estimator=None,
    legend=False,
    ax=ax1,
    zorder=2,
)

# Draw candle bodies
for _, row in df.iterrows():
    color = bullish_color if row["bullish"] else bearish_color
    body_low = row["wick_min"]
    body_high = body_low + row["body_height"]
    ax1.fill_between(
        [row["day_idx"] - 0.35, row["day_idx"] + 0.35],
        [body_low] * 2,
        [body_high] * 2,
        color=color,
        alpha=1.0,
        linewidth=0,
        zorder=3,
    )

# Style the price axis
ax1.set_ylabel("Price ($)", fontsize=20, color=INK)
ax1.set_xlabel("")
ax1.tick_params(axis="both", labelsize=16, colors=INK_SOFT)
ax1.set_title("candlestick-volume · seaborn · anyplot.ai", fontsize=24, color=INK, pad=15)

# Set y-axis range with padding
price_min = df["low"].min()
price_max = df["high"].max()
price_padding = (price_max - price_min) * 0.05
ax1.set_ylim(price_min - price_padding, price_max + price_padding)

# Remove top and right spines
ax1.spines["top"].set_visible(False)
ax1.spines["right"].set_visible(False)
for spine in ["left", "bottom"]:
    ax1.spines[spine].set_color(INK_SOFT)

# === Lower pane: Volume bars ===
bar_colors = [bullish_color if b else bearish_color for b in df["bullish"]]
ax2.bar(df["day_idx"], df["volume"], color=bar_colors, width=0.7, alpha=0.8, zorder=2)

# Style the volume axis
ax2.set_ylabel("Volume (M shares)", fontsize=20, color=INK)
ax2.set_xlabel("Date", fontsize=20, color=INK)
ax2.tick_params(axis="both", labelsize=16, colors=INK_SOFT)

# Format y-axis for volume (millions)
ax2.yaxis.set_major_formatter(plt.FuncFormatter(lambda x, p: f"{x / 1e6:.1f}M"))

# Remove top and right spines from volume pane
ax2.spines["top"].set_visible(False)
ax2.spines["right"].set_visible(False)
for spine in ["left", "bottom"]:
    ax2.spines[spine].set_color(INK_SOFT)

# === Grid lines ===
ax1.yaxis.grid(True, alpha=0.15, linewidth=0.8, color=INK)
ax2.yaxis.grid(True, alpha=0.15, linewidth=0.8, color=INK)

# Configure x-axis with date labels
n_ticks = 6
tick_positions = np.linspace(0, len(df) - 1, n_ticks, dtype=int)
tick_labels = [df.iloc[i]["date"].strftime("%b %d") for i in tick_positions]
ax2.set_xticks(tick_positions)
ax2.set_xticklabels(tick_labels, rotation=45, ha="right")

# Add legend in upper right area to avoid data overlap
legend_elements = [
    Patch(facecolor=bullish_color, label="Bullish (Close ≥ Open)"),
    Patch(facecolor=bearish_color, label="Bearish (Close < Open)"),
]
ax1.legend(
    handles=legend_elements, loc="upper right", fontsize=14, framealpha=0.95, facecolor=ELEVATED_BG, edgecolor=INK_SOFT
)

# Adjust layout and save
fig.subplots_adjust(left=0.08, right=0.95, top=0.92, bottom=0.12, hspace=0.05)
plt.savefig(f"plot-{THEME}.png", dpi=300, bbox_inches="tight", facecolor=PAGE_BG)
plt.close()
Runnable source as JSON, for any HTTP client: https://api.anyplot.ai/specs/candlestick-volume/seaborn/code. Any spec id and library id listed in llms-full.txt fit the same URL shape; every URL below is complete and callable.
{
  "spec_id": "candlestick-volume",
  "language": "python",
  "library": "seaborn",
  "page": "https://anyplot.ai/candlestick-volume/python/seaborn",
  "hub": "https://anyplot.ai/candlestick-volume",
  "code_json": "https://api.anyplot.ai/specs/candlestick-volume/seaborn/code",
  "spec_json": "https://api.anyplot.ai/specs/candlestick-volume",
  "render_light_png": "https://storage.googleapis.com/anyplot-images/plots/candlestick-volume/python/seaborn/plot-light.png",
  "render_dark_png": "https://storage.googleapis.com/anyplot-images/plots/candlestick-volume/python/seaborn/plot-dark.png",
  "quality_score": 90.0,
  "license": "MIT",
  "guide": "https://anyplot.ai/llms.txt"
}
Part of Stock Candlestick Chart with Volume on anyplot.ai.