The same plot in 14 other libraries — JavaScript: Chart.js, D3.js, Highcharts, MUI X Charts; Python: Altair, Bokeh, lets-plot, Matplotlib, Plotly, plotnine, Pygal, Seaborn; R: ggplot2; Julia: Makie.jl. Compare all 15 side by side: Stock Candlestick Chart with Volume in Python, R, Julia and JavaScript.
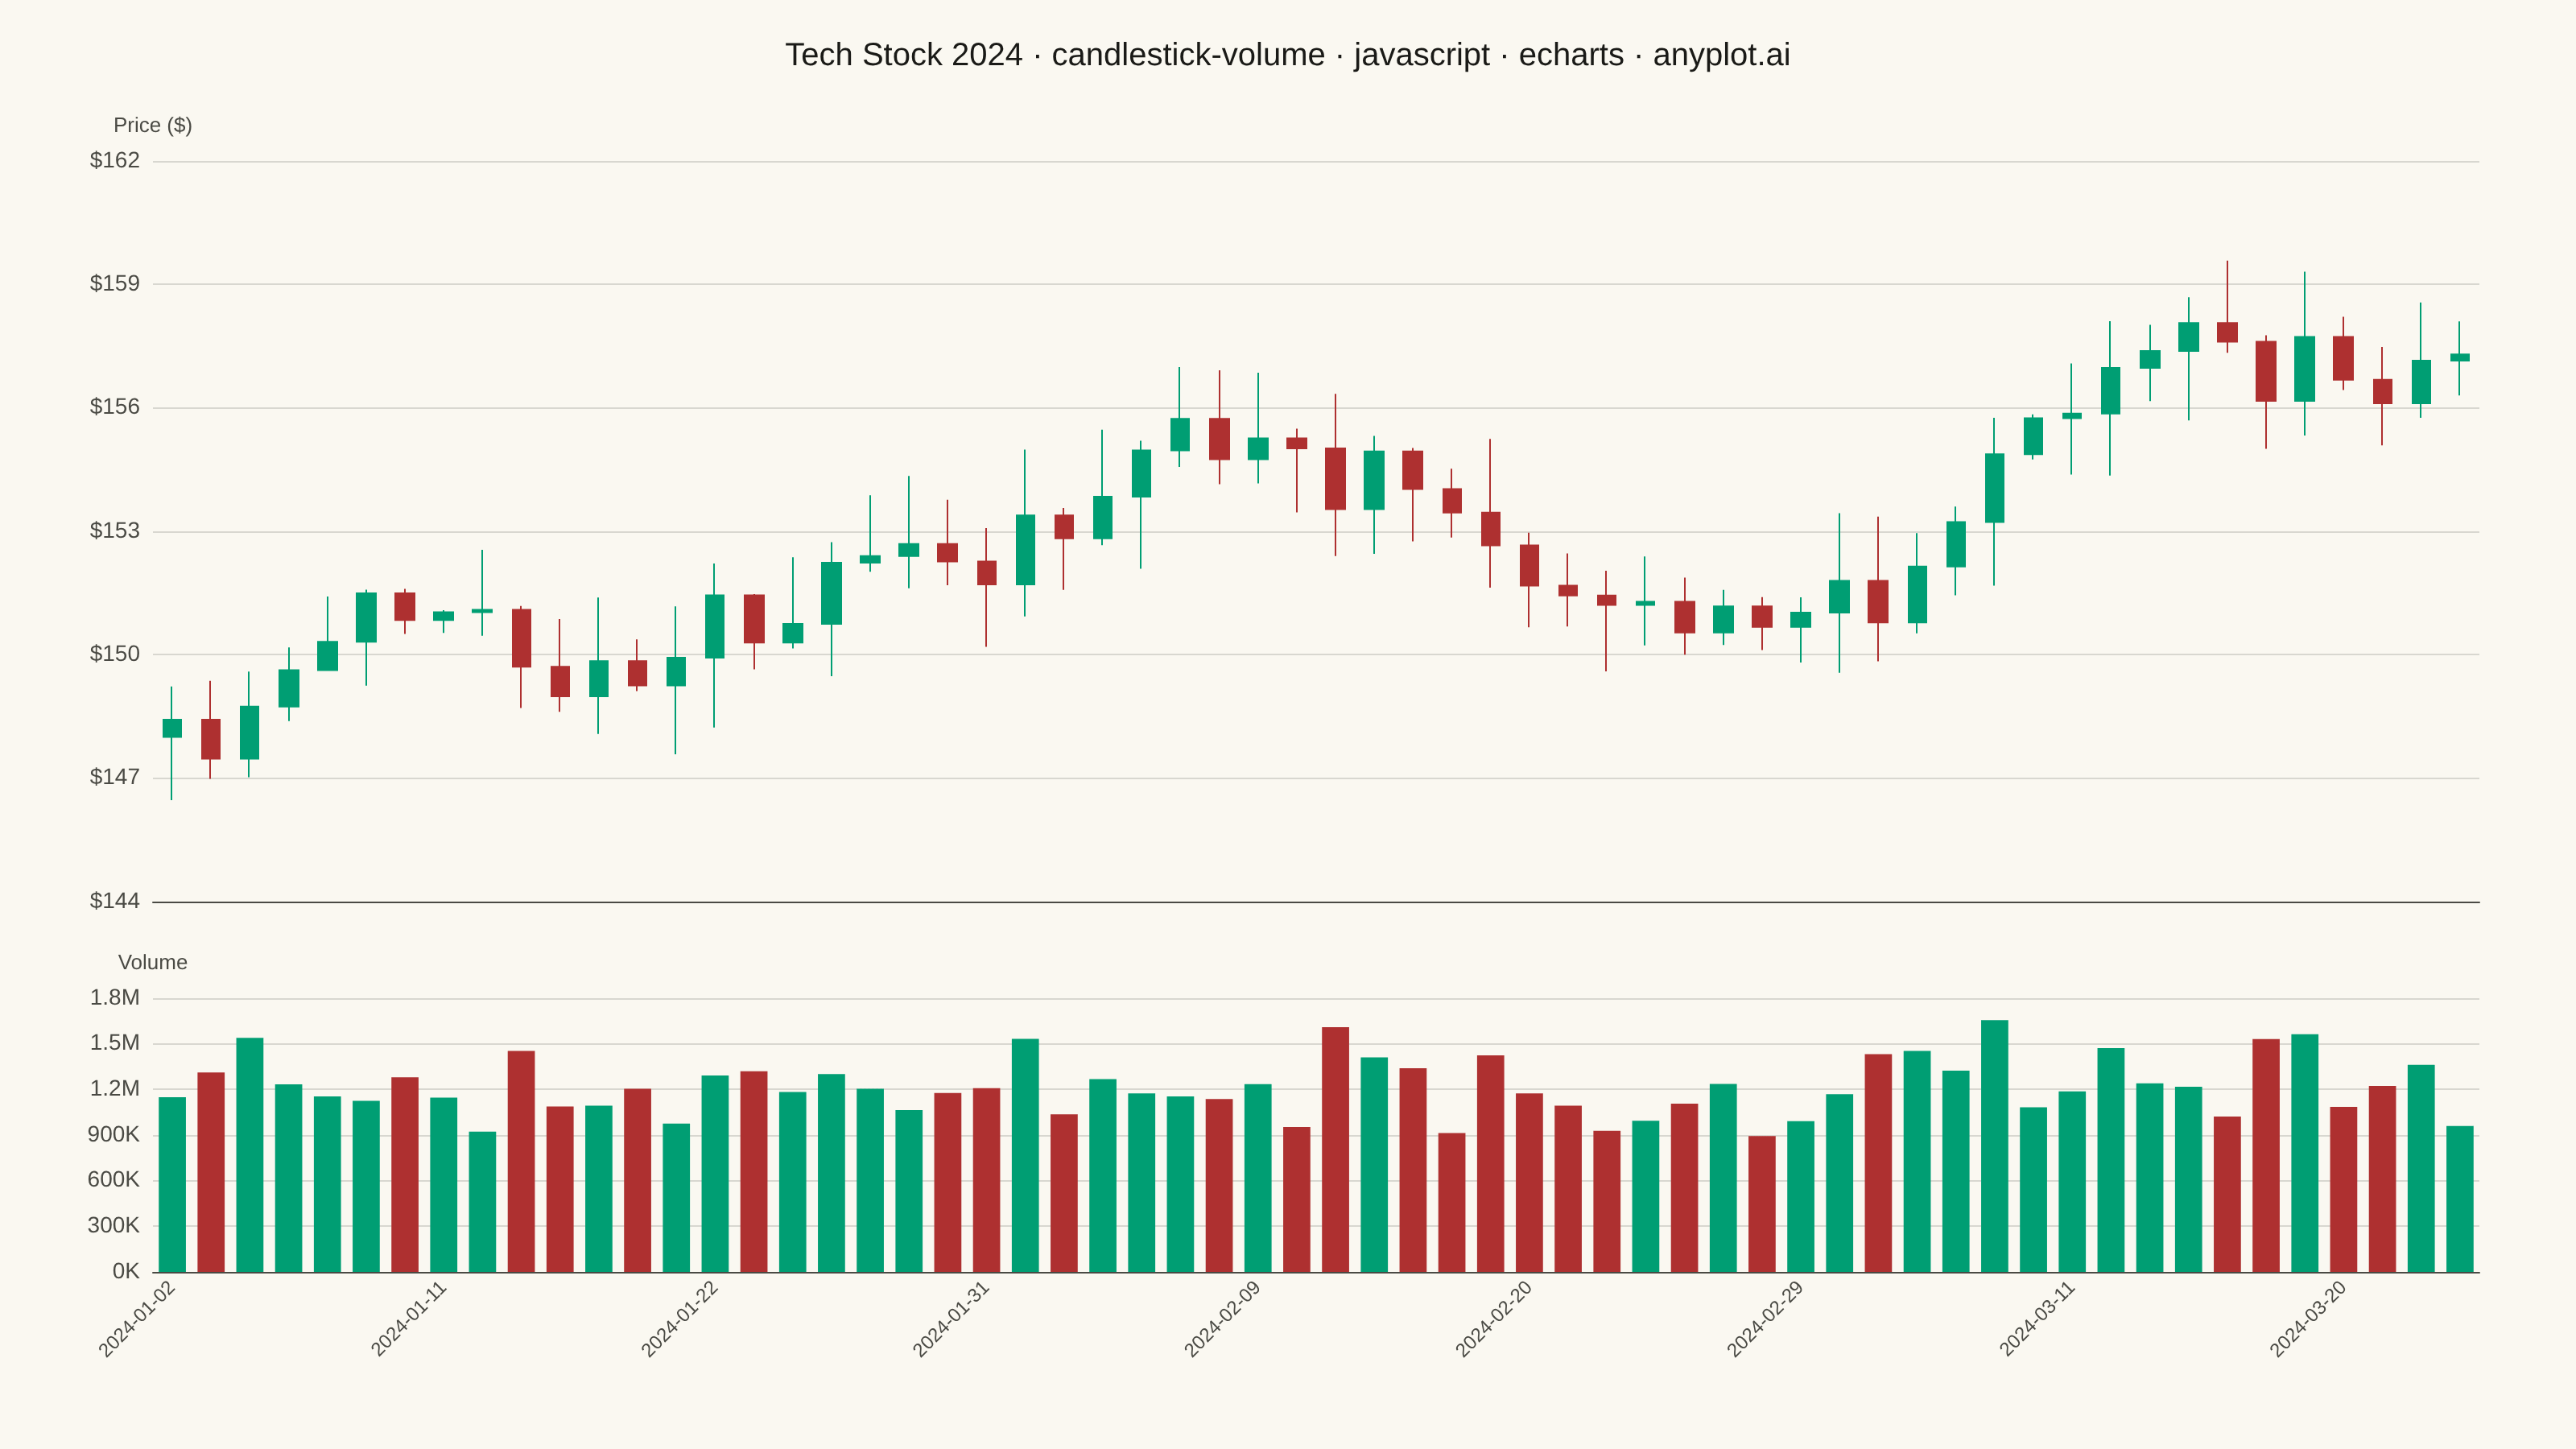
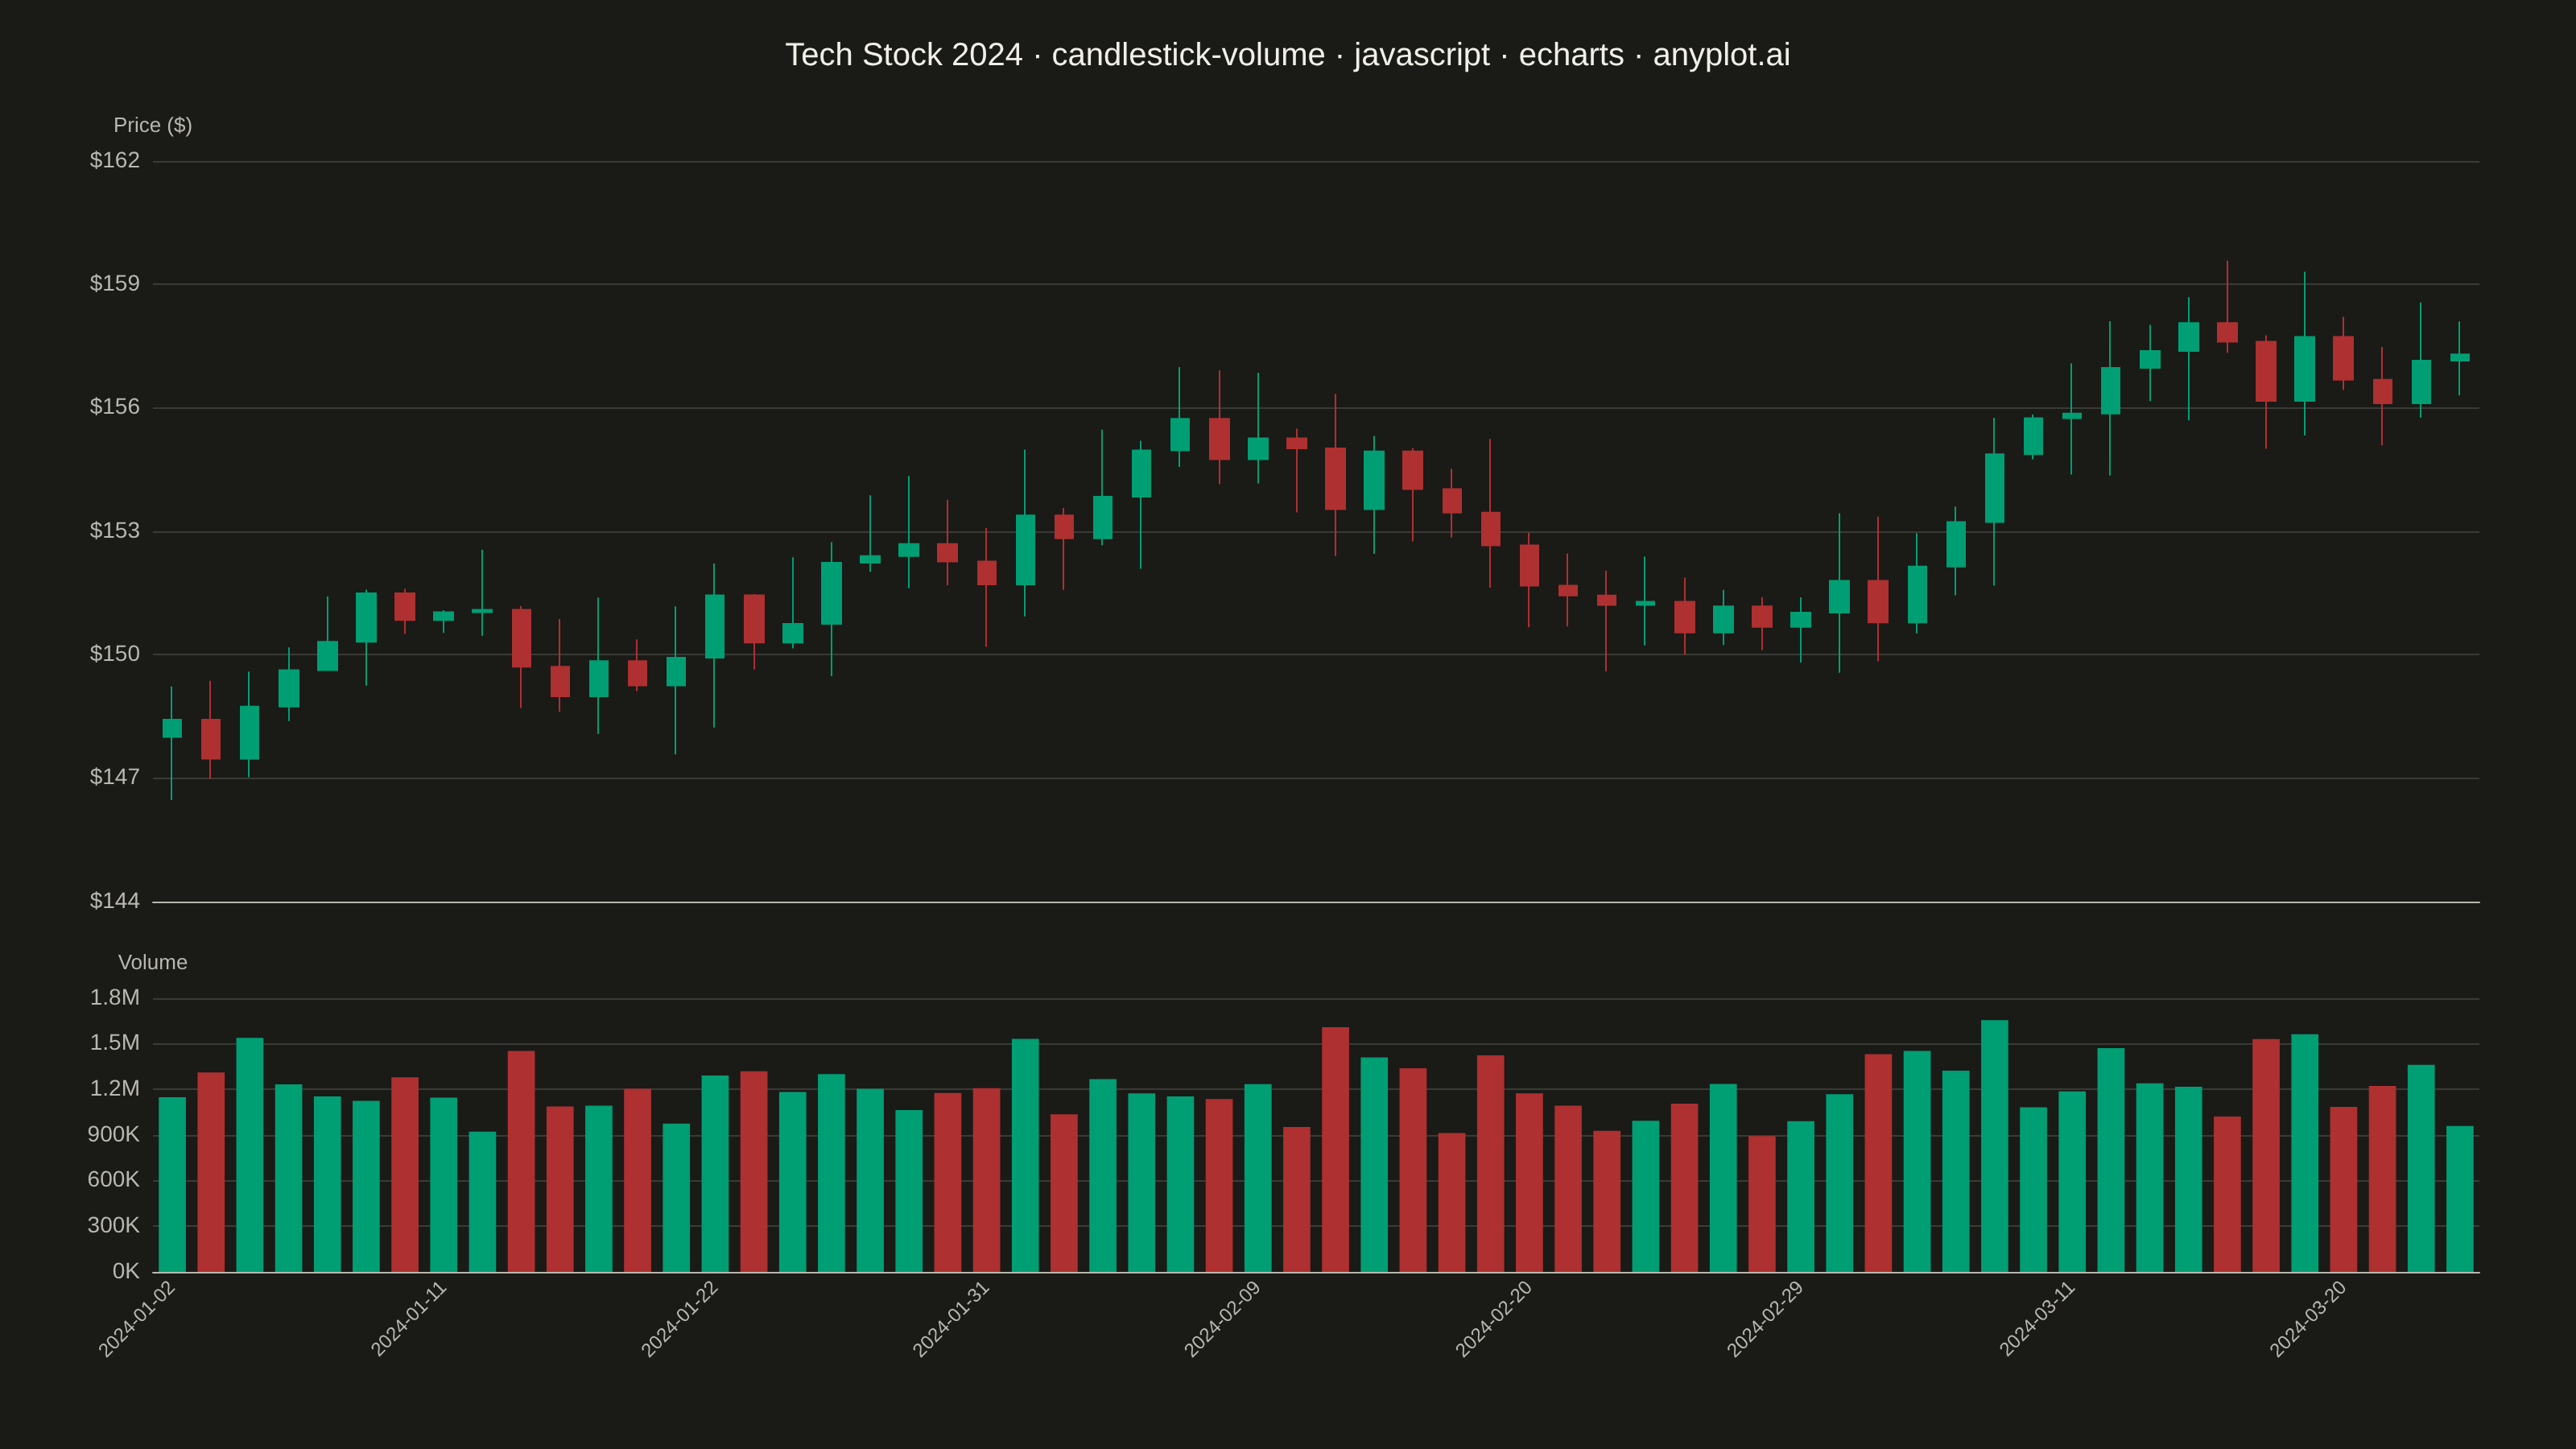
A professional candlestick chart combining OHLC (open, high, low, close) price data with volume bars in a synchronized lower pane. The dual-pane layout presents price action in the main chart with corresponding trading volume below, sharing a common time axis. This format is the standard for technical analysis platforms, enabling traders to correlate price movements with trading activity and identify volume-confirmed trends or reversals.
// anyplot.ai
// candlestick-volume: Stock Candlestick Chart with Volume
// Library: echarts 6.1.0 | JavaScript 22.23.2
// Quality: 90/100 | Created: 2026-09-02

const t = window.ANYPLOT_TOKENS;
const UP_COLOR = t.palette[0]; // "#009E73" — profit/up (Imprint semantic exception)
const DOWN_COLOR = t.palette[4]; // "#AE3030" — loss/down (Imprint semantic exception)

// --- Data (in-memory, deterministic) ----------------------------------------
// Tiny fixed-seed PRNG — the browser has no seeded Math.random().
function mulberry32(seed) {
  let a = seed;
  return function () {
    a |= 0;
    a = (a + 0x6d2b79f5) | 0;
    let x = Math.imul(a ^ (a >>> 15), 1 | a);
    x = (x + Math.imul(x ^ (x >>> 7), 61 | x)) ^ x;
    return ((x ^ (x >>> 14)) >>> 0) / 4294967296;
  };
}
const rand = mulberry32(42);

const dates = [];
const cursor = new Date(Date.UTC(2024, 0, 2));
while (dates.length < 60) {
  const weekday = cursor.getUTCDay();
  if (weekday !== 0 && weekday !== 6) dates.push(cursor.toISOString().slice(0, 10));
  cursor.setUTCDate(cursor.getUTCDate() + 1);
}

const candles = [];
const volumes = [];
let price = 148;
for (let i = 0; i < dates.length; i++) {
  const open = price;
  const drift = (rand() - 0.47) * 3.2;
  const close = Math.max(60, open + drift);
  const high = Math.max(open, close) + rand() * 1.8;
  const low = Math.min(open, close) - rand() * 1.8;
  candles.push([open, close, low, high]);
  const volume = Math.round(700000 + Math.abs(drift) * 350000 + rand() * 450000);
  volumes.push({
    value: volume,
    itemStyle: { color: close >= open ? UP_COLOR : DOWN_COLOR },
  });
  price = close;
}

function formatVolume(v) {
  return v >= 1e6 ? `${(v / 1e6).toFixed(1)}M` : `${Math.round(v / 1e3)}K`;
}

// --- Init --------------------------------------------------------------------
const chart = echarts.init(document.getElementById("container"));

// --- Option --------------------------------------------------------------------
chart.setOption({
  animation: false,
  backgroundColor: "transparent",
  title: {
    text: "Tech Stock 2024 · candlestick-volume · javascript · echarts · anyplot.ai",
    left: "center",
    top: 20,
    textStyle: { color: t.ink, fontSize: 20, fontWeight: 500 },
  },
  tooltip: {
    trigger: "axis",
    axisPointer: { type: "cross" },
  },
  axisPointer: {
    link: [{ xAxisIndex: "all" }],
  },
  grid: [
    { left: 95, right: 60, top: 100, height: 460 },
    { left: 95, right: 60, top: 620, height: 170 },
  ],
  xAxis: [
    {
      gridIndex: 0,
      type: "category",
      data: dates,
      boundaryGap: true,
      axisLabel: { show: false },
      axisLine: { lineStyle: { color: t.inkSoft } },
      axisTick: { show: false },
      splitLine: { show: false },
    },
    {
      gridIndex: 1,
      type: "category",
      data: dates,
      boundaryGap: true,
      axisLabel: { color: t.inkSoft, fontSize: 12, rotate: 45, interval: 6 },
      axisLine: { lineStyle: { color: t.inkSoft } },
      axisTick: { show: false },
      splitLine: { show: false },
    },
  ],
  yAxis: [
    {
      gridIndex: 0,
      type: "value",
      scale: true,
      name: "Price ($)",
      nameTextStyle: { color: t.inkSoft, fontSize: 13 },
      axisLabel: { color: t.inkSoft, fontSize: 14, formatter: "${value}" },
      axisLine: { show: false },
      axisTick: { show: false },
      splitLine: { lineStyle: { color: t.grid } },
    },
    {
      gridIndex: 1,
      type: "value",
      name: "Volume",
      nameTextStyle: { color: t.inkSoft, fontSize: 13 },
      axisLabel: { color: t.inkSoft, fontSize: 14, formatter: formatVolume },
      axisLine: { show: false },
      axisTick: { show: false },
      splitLine: { lineStyle: { color: t.grid } },
    },
  ],
  series: [
    {
      type: "candlestick",
      xAxisIndex: 0,
      yAxisIndex: 0,
      data: candles,
      itemStyle: {
        color: UP_COLOR,
        color0: DOWN_COLOR,
        borderColor: UP_COLOR,
        borderColor0: DOWN_COLOR,
      },
    },
    {
      type: "bar",
      xAxisIndex: 1,
      yAxisIndex: 1,
      data: volumes,
      barWidth: "70%",
    },
  ],
});
Runnable source as JSON, for any HTTP client: https://api.anyplot.ai/specs/candlestick-volume/echarts/code. Any spec id and library id listed in llms-full.txt fit the same URL shape; every URL below is complete and callable.
{
  "spec_id": "candlestick-volume",
  "language": "javascript",
  "library": "echarts",
  "page": "https://anyplot.ai/candlestick-volume/javascript/echarts",
  "hub": "https://anyplot.ai/candlestick-volume",
  "code_json": "https://api.anyplot.ai/specs/candlestick-volume/echarts/code",
  "spec_json": "https://api.anyplot.ai/specs/candlestick-volume",
  "render_light_png": "https://storage.googleapis.com/anyplot-images/plots/candlestick-volume/javascript/echarts/plot-light.png",
  "render_dark_png": "https://storage.googleapis.com/anyplot-images/plots/candlestick-volume/javascript/echarts/plot-dark.png",
  "interactive_light_html": "https://storage.googleapis.com/anyplot-images/plots/candlestick-volume/javascript/echarts/plot-light.html",
  "interactive_dark_html": "https://storage.googleapis.com/anyplot-images/plots/candlestick-volume/javascript/echarts/plot-dark.html",
  "quality_score": 90.0,
  "license": "MIT",
  "guide": "https://anyplot.ai/llms.txt"
}
Part of Stock Candlestick Chart with Volume on anyplot.ai.