The same plot in 14 other libraries — JavaScript: Chart.js, D3.js, Apache ECharts, MUI X Charts; Python: Altair, Bokeh, lets-plot, Matplotlib, Plotly, plotnine, Pygal, Seaborn; R: ggplot2; Julia: Makie.jl. Compare all 15 side by side: Stock Candlestick Chart with Volume in Python, R, Julia and JavaScript.
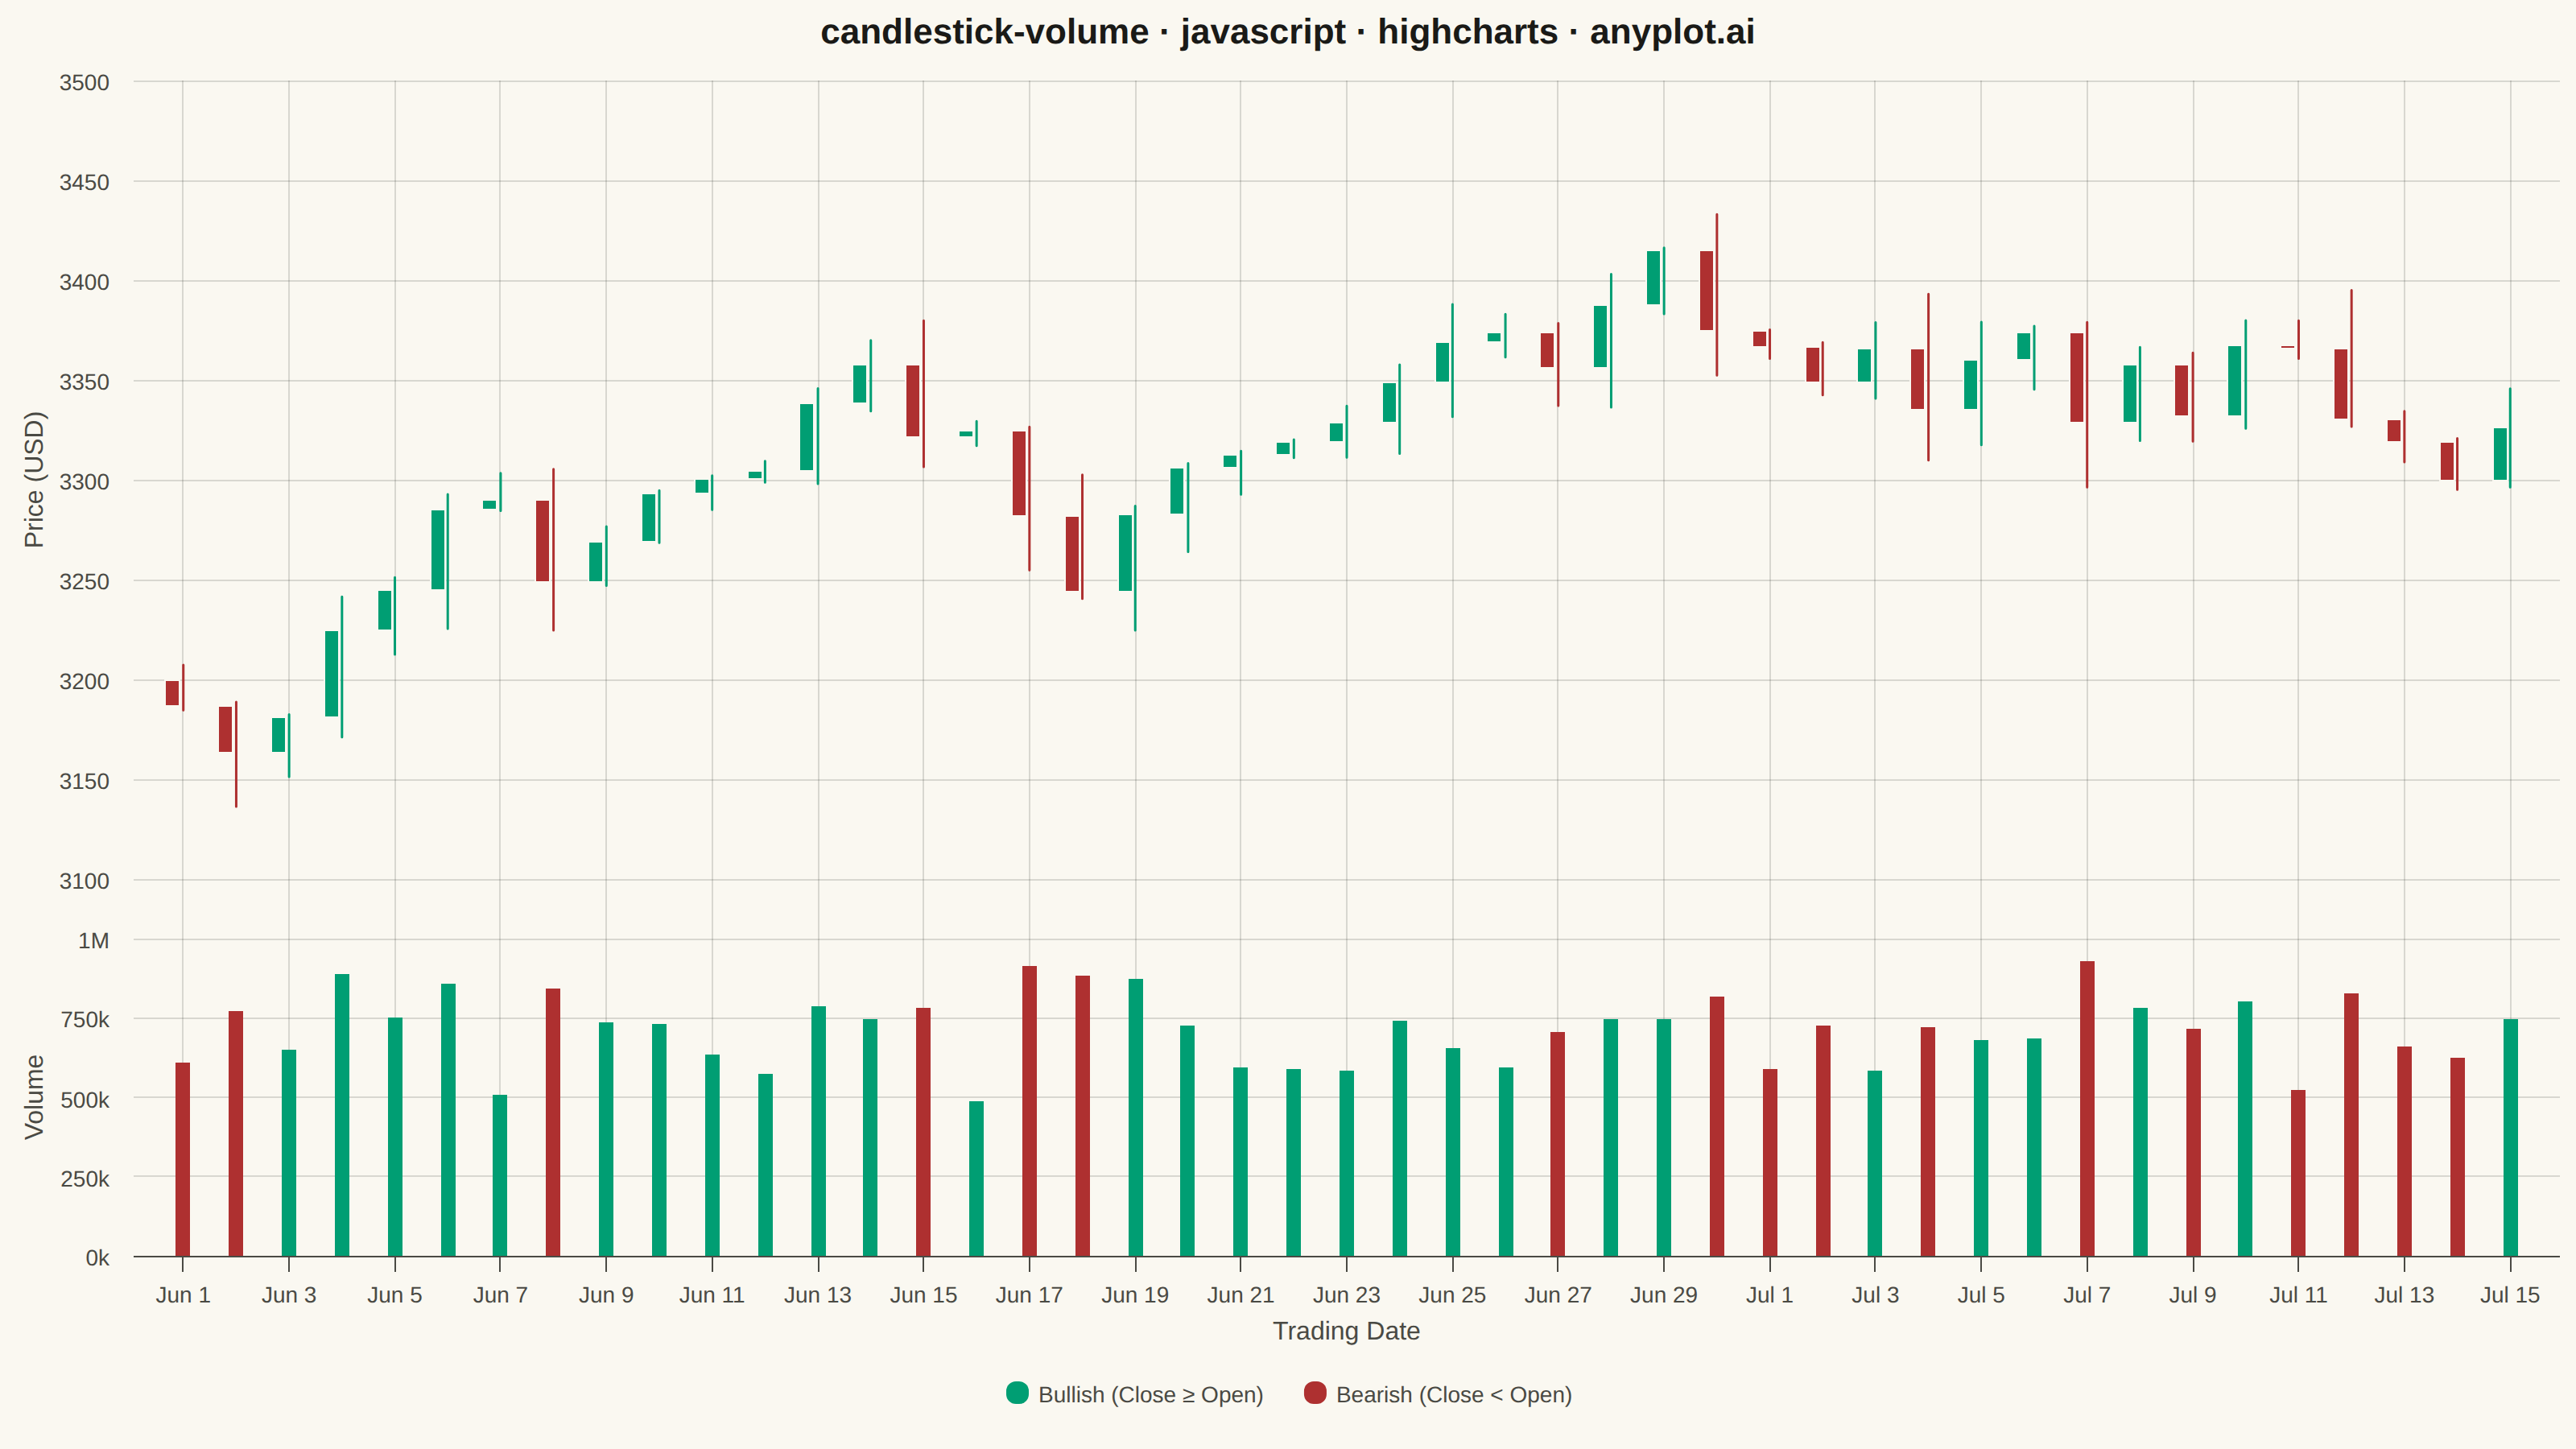
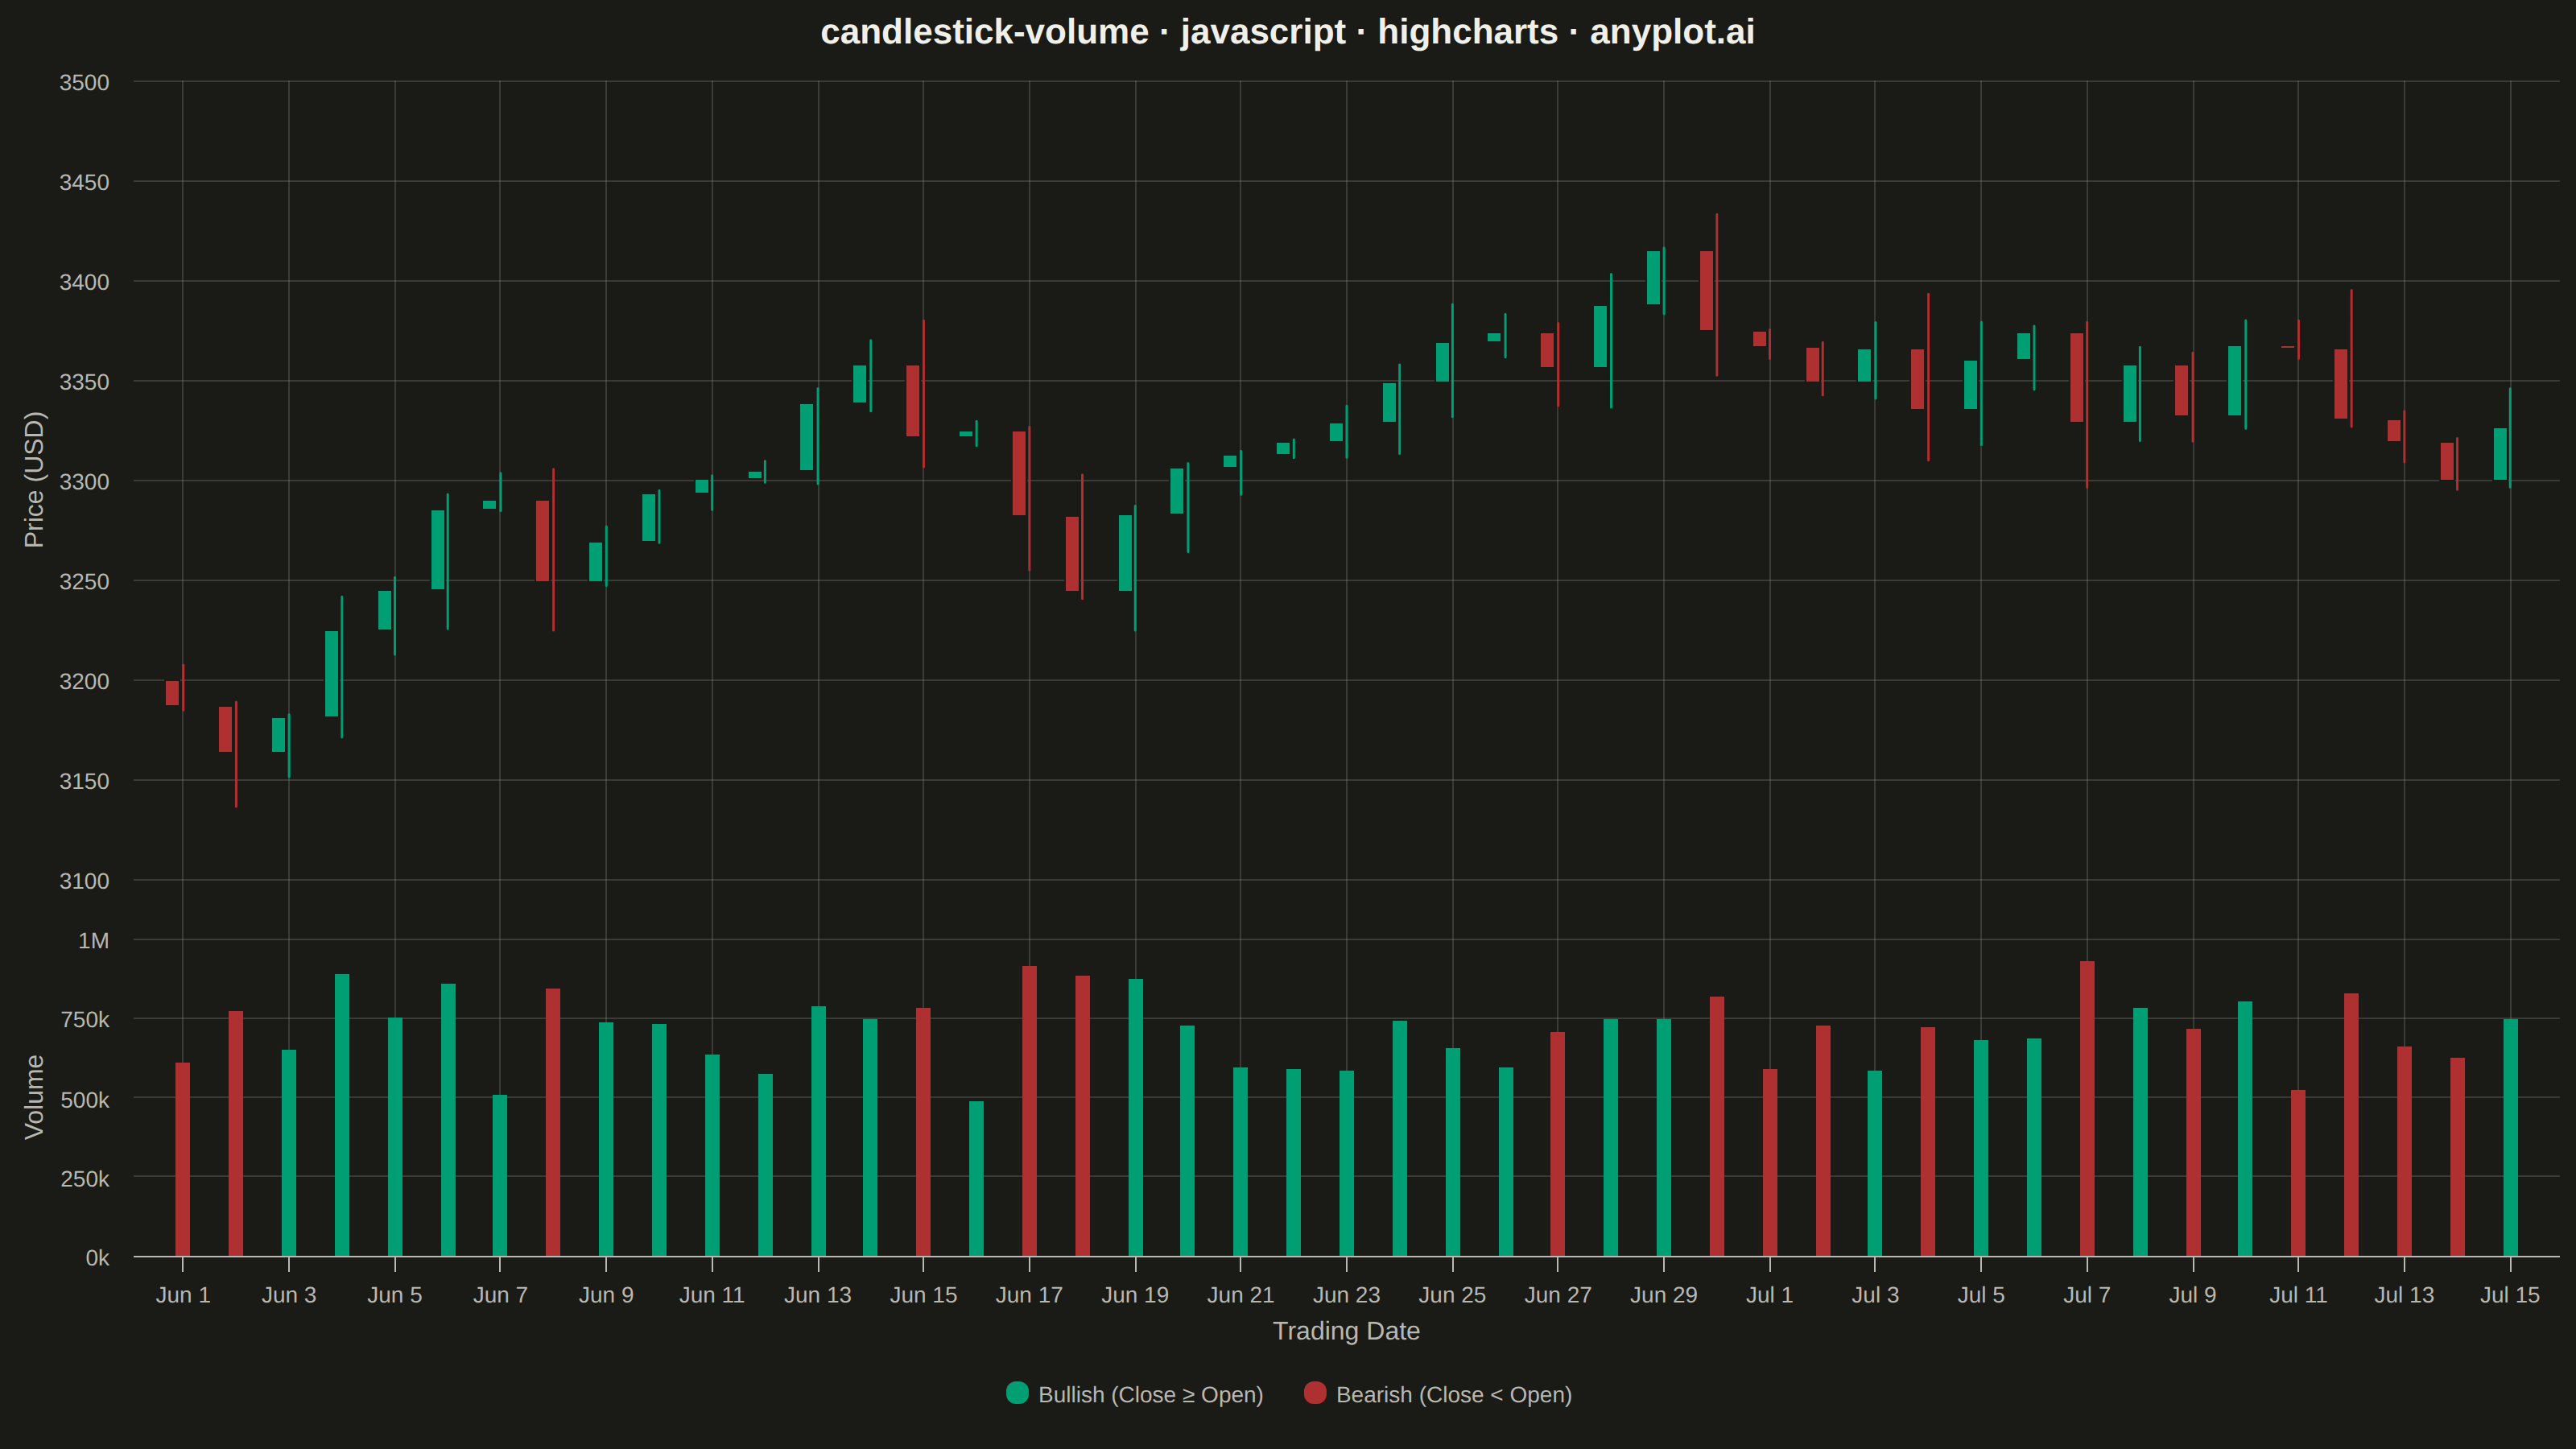
A professional candlestick chart combining OHLC (open, high, low, close) price data with volume bars in a synchronized lower pane. The dual-pane layout presents price action in the main chart with corresponding trading volume below, sharing a common time axis. This format is the standard for technical analysis platforms, enabling traders to correlate price movements with trading activity and identify volume-confirmed trends or reversals.
// anyplot.ai
// candlestick-volume: Stock Candlestick Chart with Volume
// Library: highcharts 12.6.0 | JavaScript 22.23.2
// Quality: 89/100 | Created: 2026-09-02

// The core bundle (no highcharts-more / modules/stock) has no "candlestick"
// series — that type ships in modules/stock.js, which isn't loaded. Each
// candle is built from an invisible "Floor" column stacked under a
// colorByPoint "Body" column for the open-close range, with per-direction
// "line" series (null-separated, one pair per candle) for the high-low wicks
// — pure core series types, no add-on module. The volume pane is a second
// yAxis (top/height split of the same plot area) sharing the chart's single
// xAxis, so the built-in crosshair and vertical gridlines span both panes
// automatically — no cross-pane sync code needed.
const t = window.ANYPLOT_TOKENS;

// --- Data (in-memory, deterministic mulberry32 PRNG) ------------------------
function mulberry32(seed) {
  return function () {
    seed |= 0;
    seed = (seed + 0x6d2b79f5) | 0;
    let z = Math.imul(seed ^ (seed >>> 15), 1 | seed);
    z = (z + Math.imul(z ^ (z >>> 7), 61 | z)) ^ z;
    return ((z ^ (z >>> 14)) >>> 0) / 4294967296;
  };
}
const rand = mulberry32(20240601);

const upColor = t.palette[0]; // #009E73 brand green — bullish (profit/up)
const downColor = t.palette[4]; // #AE3030 matte red — bearish (loss/down), finance semantic anchor

const dayMs = 24 * 3600 * 1000;
const numDays = 45; // continuous daily bars — crypto trades every calendar day
const startTime = Date.UTC(2024, 5, 1); // Sat 1 Jun 2024
const dates = Array.from({ length: numDays }, (_, i) => startTime + i * dayMs);

let price = 3200; // ETH-style token price in USD
const candles = dates.map((time) => {
  const open = price;
  const drift = (rand() - 0.5) * 90;
  const close = Math.max(50, open + drift);
  const swing = Math.abs(close - open) + rand() * 40 + 12;
  const high = Math.max(open, close) + rand() * swing * 0.4;
  const low = Math.max(10, Math.min(open, close) - rand() * swing * 0.4);
  const bullish = close >= open;
  const volume = Math.round(420000 + Math.abs(close - open) * 9000 + rand() * 160000);
  price = close;
  return {
    time,
    open: +open.toFixed(2),
    high: +high.toFixed(2),
    low: +low.toFixed(2),
    close: +close.toFixed(2),
    volume,
    bullish,
  };
});

const candleWidth = 9;

const floorData = candles.map((c) => ({ x: c.time, y: +Math.min(c.open, c.close).toFixed(2) }));
const bodyData = candles.map((c) => ({
  x: c.time,
  y: +Math.abs(c.close - c.open).toFixed(2),
  color: c.bullish ? upColor : downColor,
  custom: c,
}));
const wickUpData = candles
  .filter((c) => c.bullish)
  .flatMap((c) => [{ x: c.time, y: c.low }, { x: c.time, y: c.high }, { x: c.time, y: null }]);
const wickDownData = candles
  .filter((c) => !c.bullish)
  .flatMap((c) => [{ x: c.time, y: c.low }, { x: c.time, y: c.high }, { x: c.time, y: null }]);
const volumeData = candles.map((c) => ({ x: c.time, y: c.volume, color: c.bullish ? upColor : downColor }));

const allLows = candles.map((c) => c.low);
const allHighs = candles.map((c) => c.high);
const pricePad = (Math.max(...allHighs) - Math.min(...allLows)) * 0.08;
const priceMin = Math.floor(Math.min(...allLows) - pricePad);
const priceMax = Math.ceil(Math.max(...allHighs) + pricePad);

// --- Chart -------------------------------------------------------------------
Highcharts.chart("container", {
  chart: {
    type: "column",
    backgroundColor: "transparent",
    animation: false,
    style: { fontFamily: "inherit" },
  },
  credits: { enabled: false },
  colors: t.palette,
  title: {
    text: "candlestick-volume · javascript · highcharts · anyplot.ai",
    style: { color: t.ink, fontSize: "22px", fontWeight: "600" },
  },
  xAxis: {
    type: "datetime",
    lineColor: t.inkSoft,
    tickColor: t.inkSoft,
    gridLineColor: t.grid,
    gridLineWidth: 1,
    crosshair: { color: t.inkSoft, dashStyle: "Dash", width: 1 },
    labels: { style: { color: t.inkSoft, fontSize: "14px" } },
    title: { text: "Trading Date", style: { color: t.inkSoft, fontSize: "16px" } },
  },
  yAxis: [
    {
      // Price pane — top 68% of the plot area
      top: "0%",
      height: "68%",
      min: priceMin,
      max: priceMax,
      reversedStacks: false, // keep the invisible "Floor" series at the bottom of the stack
      title: { text: "Price (USD)", style: { color: t.inkSoft, fontSize: "16px" } },
      gridLineColor: t.grid,
      lineColor: t.inkSoft,
      labels: { style: { color: t.inkSoft, fontSize: "14px" } },
    },
    {
      // Volume pane — bottom 27%, a 5% gap separates it from the price pane
      top: "73%",
      height: "27%",
      offset: 0,
      min: 0,
      title: { text: "Volume", style: { color: t.inkSoft, fontSize: "16px" } },
      gridLineColor: t.grid,
      lineColor: t.inkSoft,
      labels: {
        style: { color: t.inkSoft, fontSize: "14px" },
        formatter() {
          return this.value >= 1000000
            ? Highcharts.numberFormat(this.value / 1000000, 1).replace(/\.0$/, "") + "M"
            : Highcharts.numberFormat(this.value / 1000, 0) + "k";
        },
      },
    },
  ],
  legend: {
    enabled: true,
    itemStyle: { color: t.inkSoft, fontSize: "14px" },
    itemHoverStyle: { color: t.ink },
    symbolRadius: 6,
    itemDistance: 24,
    padding: 12,
  },
  tooltip: {
    shared: true,
    outside: false,
    formatter: function () {
      const bodyPoint = this.points && this.points.find((p) => p.series.name === "Body");
      if (!bodyPoint) return false;
      const c = bodyPoint.point.custom;
      const volumePoint = this.points.find((p) => p.series.name === "Volume");
      let html =
        `<b>${Highcharts.dateFormat("%b %e, %Y", c.time)}</b><br/>` +
        `Open: ${c.open.toFixed(2)}<br/>High: ${c.high.toFixed(2)}<br/>` +
        `Low: ${c.low.toFixed(2)}<br/>Close: ${c.close.toFixed(2)}`;
      if (volumePoint) html += `<br/>Volume: ${Highcharts.numberFormat(volumePoint.y, 0)}`;
      return html;
    },
  },
  plotOptions: {
    series: { animation: false },
    column: { borderRadius: 0, animation: false },
  },
  series: [
    {
      name: "Floor",
      data: floorData,
      yAxis: 0,
      stacking: "normal",
      stack: "price",
      pointWidth: candleWidth,
      color: "transparent",
      borderWidth: 0,
      enableMouseTracking: false,
      showInLegend: false,
    },
    {
      type: "line",
      name: "Wicks (up)",
      data: wickUpData,
      yAxis: 0,
      color: upColor,
      lineWidth: 1.5,
      marker: { enabled: false },
      enableMouseTracking: false,
      showInLegend: false,
    },
    {
      type: "line",
      name: "Wicks (down)",
      data: wickDownData,
      yAxis: 0,
      color: downColor,
      lineWidth: 1.5,
      marker: { enabled: false },
      enableMouseTracking: false,
      showInLegend: false,
    },
    {
      name: "Body",
      data: bodyData,
      yAxis: 0,
      stacking: "normal",
      stack: "price",
      pointWidth: candleWidth,
      borderColor: t.pageBg,
      borderWidth: 1,
      showInLegend: false,
    },
    {
      name: "Volume",
      data: volumeData,
      yAxis: 1,
      pointWidth: candleWidth,
      borderWidth: 0,
      showInLegend: false,
    },
    {
      name: "Bullish (Close ≥ Open)",
      data: [],
      color: upColor,
      showInLegend: true,
    },
    {
      name: "Bearish (Close < Open)",
      data: [],
      color: downColor,
      showInLegend: true,
    },
  ],
});
Runnable source as JSON, for any HTTP client: https://api.anyplot.ai/specs/candlestick-volume/highcharts/code. Any spec id and library id listed in llms-full.txt fit the same URL shape; every URL below is complete and callable.
{
  "spec_id": "candlestick-volume",
  "language": "javascript",
  "library": "highcharts",
  "page": "https://anyplot.ai/candlestick-volume/javascript/highcharts",
  "hub": "https://anyplot.ai/candlestick-volume",
  "code_json": "https://api.anyplot.ai/specs/candlestick-volume/highcharts/code",
  "spec_json": "https://api.anyplot.ai/specs/candlestick-volume",
  "render_light_png": "https://storage.googleapis.com/anyplot-images/plots/candlestick-volume/javascript/highcharts/plot-light.png",
  "render_dark_png": "https://storage.googleapis.com/anyplot-images/plots/candlestick-volume/javascript/highcharts/plot-dark.png",
  "interactive_light_html": "https://storage.googleapis.com/anyplot-images/plots/candlestick-volume/javascript/highcharts/plot-light.html",
  "interactive_dark_html": "https://storage.googleapis.com/anyplot-images/plots/candlestick-volume/javascript/highcharts/plot-dark.html",
  "quality_score": 89.0,
  "license": "MIT",
  "guide": "https://anyplot.ai/llms.txt"
}
Part of Stock Candlestick Chart with Volume on anyplot.ai.