The same plot in 14 other libraries — Python: Altair, Bokeh, lets-plot, Matplotlib, Plotly, Pygal, Seaborn; R: ggplot2; Julia: Makie.jl; JavaScript: Chart.js, D3.js, Apache ECharts, Highcharts, MUI X Charts. Compare all 15 side by side: Stock Candlestick Chart with Volume in Python, R, Julia and JavaScript.
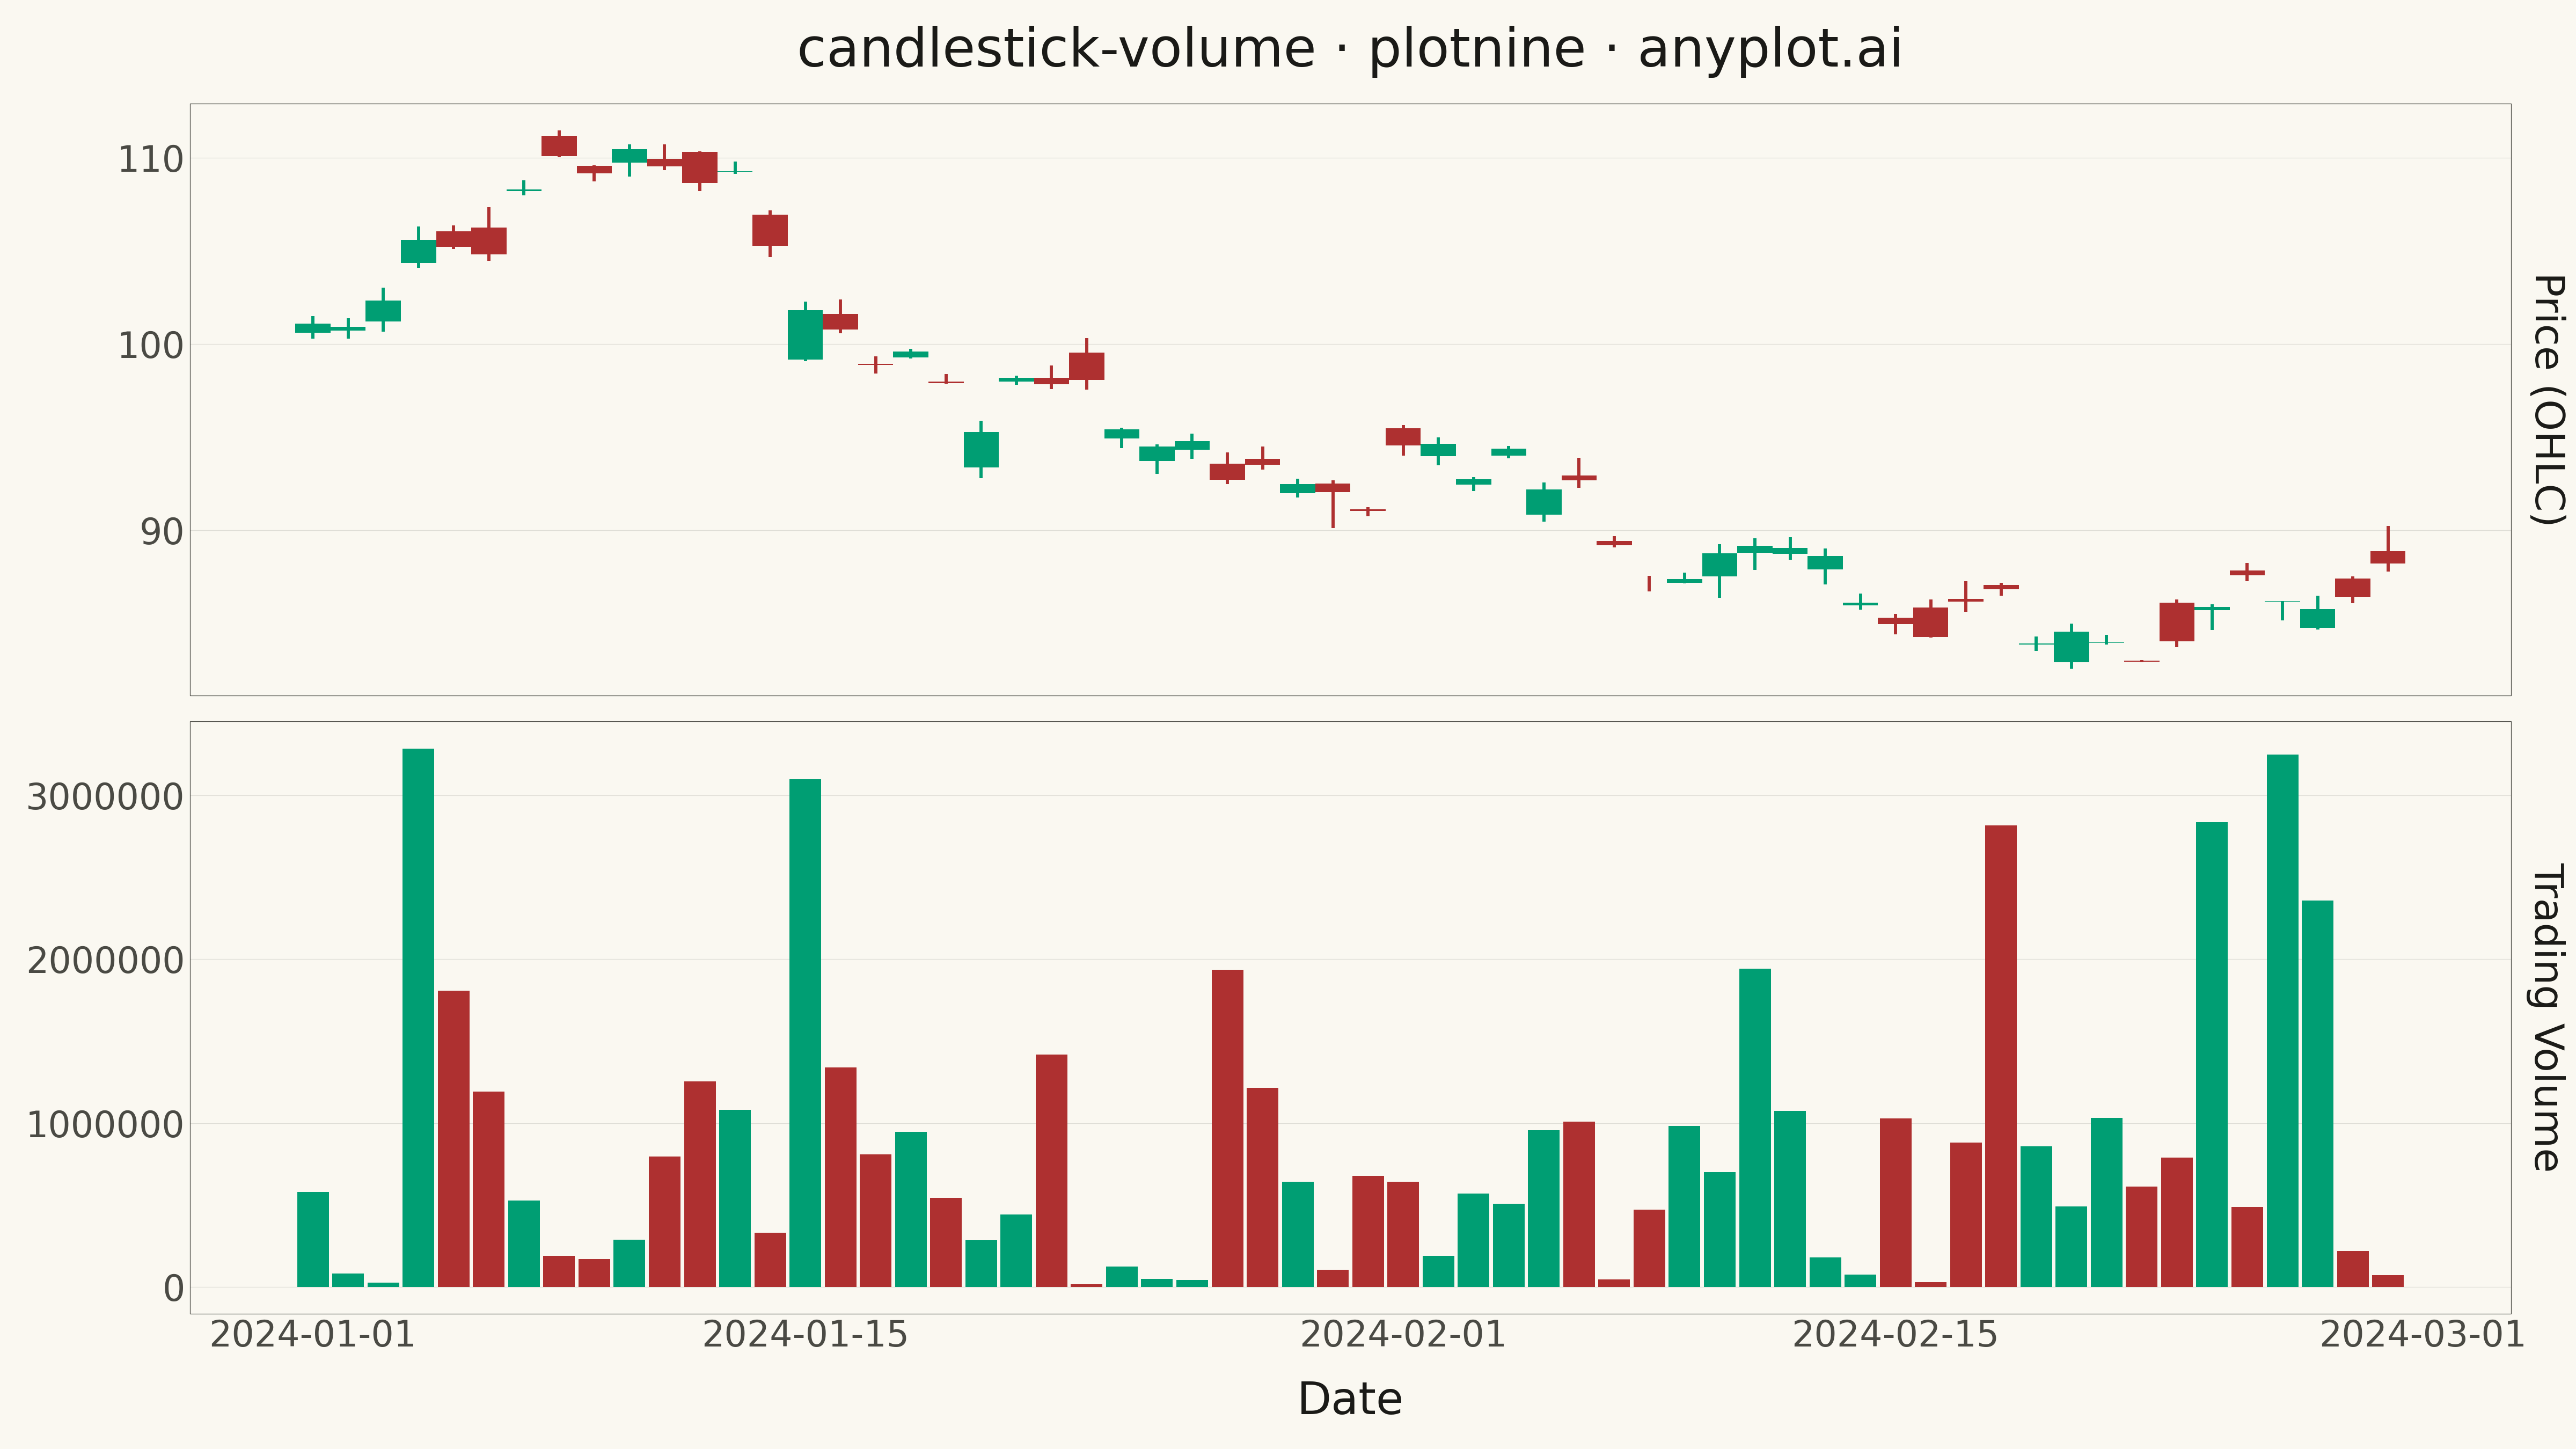
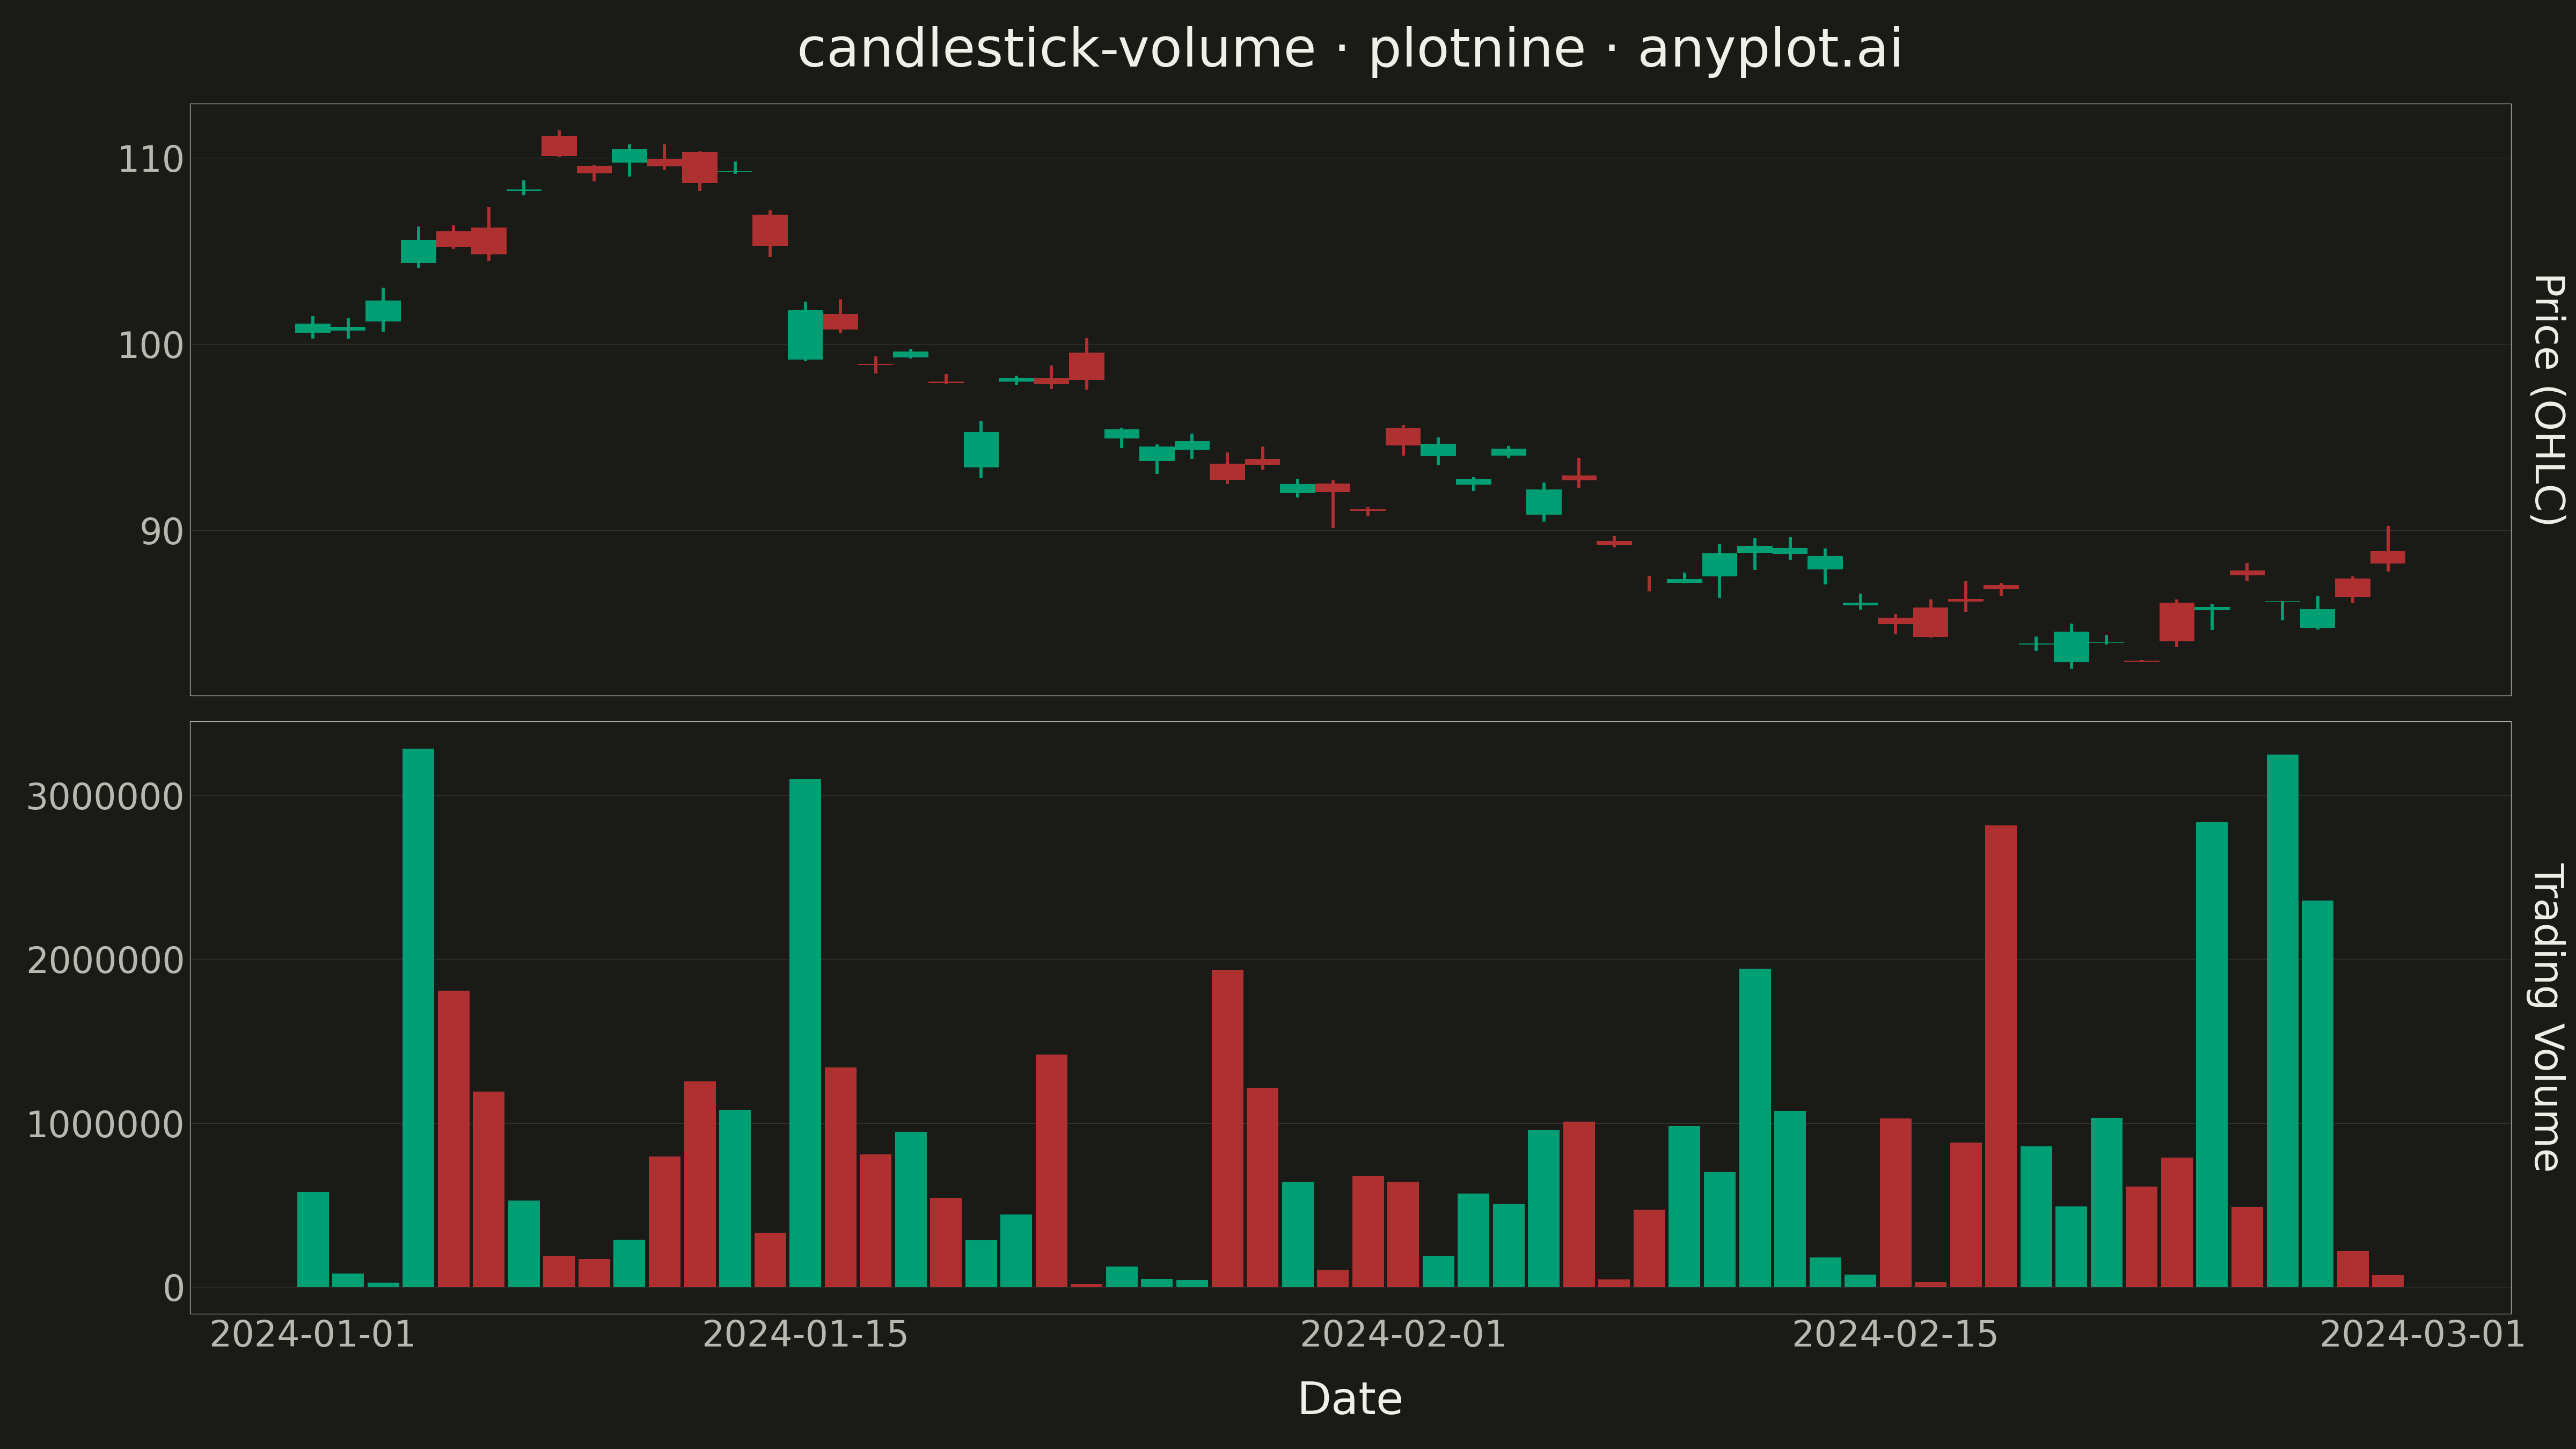
A professional candlestick chart combining OHLC (open, high, low, close) price data with volume bars in a synchronized lower pane. The dual-pane layout presents price action in the main chart with corresponding trading volume below, sharing a common time axis. This format is the standard for technical analysis platforms, enabling traders to correlate price movements with trading activity and identify volume-confirmed trends or reversals.
""" anyplot.ai
candlestick-volume: Stock Candlestick Chart with Volume
Library: plotnine 0.15.4 | Python 3.13.13
Quality: 91/100 | Created: 2026-05-16
"""

import sys


# Remove the current directory from sys.path to avoid shadowing the installed plotnine package
while "" in sys.path:
    sys.path.remove("")
cwd = __file__[: __file__.rfind("/")]
while cwd in sys.path:
    sys.path.remove(cwd)

# Now import plotnine
import os

import numpy as np
import pandas as pd

from plotnine import (
    aes,
    element_blank,
    element_line,
    element_rect,
    element_text,
    facet_grid,
    geom_col,
    geom_rect,
    geom_segment,
    ggplot,
    ggsave,
    labs,
    scale_color_manual,
    scale_fill_manual,
    theme,
    theme_minimal,
)


# Theme tokens
THEME = os.getenv("ANYPLOT_THEME", "light")
PAGE_BG = "#FAF8F1" if THEME == "light" else "#1A1A17"
INK = "#1A1A17" if THEME == "light" else "#F0EFE8"
INK_SOFT = "#4A4A44" if THEME == "light" else "#B8B7B0"

# imprint semantic anchors: Up (green), Down (red)
UP_COLOR = "#009E73"
DOWN_COLOR = "#AE3030"

# Generate realistic OHLC data
np.random.seed(42)
n_periods = 60
dates = pd.date_range("2024-01-01", periods=n_periods, freq="D")

# Create price movement with realistic patterns
returns = np.random.normal(0.001, 0.02, n_periods)
close_prices = 100 * np.exp(np.cumsum(returns))
open_prices = close_prices * (1 + np.random.normal(0, 0.01, n_periods))
high_prices = np.maximum(open_prices, close_prices) + np.abs(np.random.normal(0, 0.5, n_periods))
low_prices = np.minimum(open_prices, close_prices) - np.abs(np.random.normal(0, 0.5, n_periods))
volumes = np.random.exponential(1e6, n_periods)

# Create main dataframe
df = pd.DataFrame(
    {
        "date": dates,
        "open": open_prices,
        "high": high_prices,
        "low": low_prices,
        "close": close_prices,
        "volume": volumes,
    }
)

# Add direction (up/down) and position columns for rectangles
df["direction"] = df["close"] >= df["open"]
df["direction_label"] = df["direction"].map({True: "Up", False: "Down"})
df["x_min"] = df["date"] - pd.Timedelta(hours=12)
df["x_max"] = df["date"] + pd.Timedelta(hours=12)

# Create separate dataframes for faceting
df_price = df.copy()
df_price["pane"] = "Price (OHLC)"

df_volume = df.copy()
df_volume["pane"] = "Trading Volume"

# Create the faceted plot
plot = (
    ggplot()
    # Candlestick wicks (high-low lines)
    + geom_segment(
        aes(x="date", y="low", xend="date", yend="high", color="direction_label"),
        data=df_price,
        size=0.8,
        show_legend=False,
    )
    # Candlestick bodies (open-close rectangles)
    + geom_rect(
        aes(xmin="x_min", xmax="x_max", ymin="open", ymax="close", fill="direction_label"),
        data=df_price,
        show_legend=False,
    )
    # Volume bars
    + geom_col(aes(x="date", y="volume", fill="direction_label"), data=df_volume, show_legend=False)
    # Facet with free y-scales for price and volume
    + facet_grid("pane ~ .", scales="free_y")
    # Color scales
    + scale_color_manual(values=[DOWN_COLOR, UP_COLOR])
    + scale_fill_manual(values=[DOWN_COLOR, UP_COLOR])
    # Labels and title
    + labs(title="candlestick-volume · plotnine · anyplot.ai", x="Date", y="")
    # Theme
    + theme_minimal()
    + theme(
        figure_size=(16, 9),
        plot_background=element_rect(fill=PAGE_BG, color=PAGE_BG),
        panel_background=element_rect(fill=PAGE_BG),
        panel_border=element_rect(color=INK_SOFT, fill=None, size=0.3),
        axis_title=element_text(size=20, color=INK),
        axis_text=element_text(size=16, color=INK_SOFT),
        plot_title=element_text(size=24, color=INK, weight="medium"),
        strip_text_y=element_text(size=18, color=INK),
        panel_grid_major_y=element_line(color=INK_SOFT, size=0.3, alpha=0.15),
        panel_grid_major_x=element_blank(),
        panel_grid_minor=element_blank(),
    )
)

# Save with theme-suffixed filename to script directory
script_dir = __file__[: __file__.rfind("/")]
ggsave(plot, f"{script_dir}/plot-{THEME}.png", dpi=300)
Runnable source as JSON, for any HTTP client: https://api.anyplot.ai/specs/candlestick-volume/plotnine/code. Any spec id and library id listed in llms-full.txt fit the same URL shape; every URL below is complete and callable.
{
  "spec_id": "candlestick-volume",
  "language": "python",
  "library": "plotnine",
  "page": "https://anyplot.ai/candlestick-volume/python/plotnine",
  "hub": "https://anyplot.ai/candlestick-volume",
  "code_json": "https://api.anyplot.ai/specs/candlestick-volume/plotnine/code",
  "spec_json": "https://api.anyplot.ai/specs/candlestick-volume",
  "render_light_png": "https://storage.googleapis.com/anyplot-images/plots/candlestick-volume/python/plotnine/plot-light.png",
  "render_dark_png": "https://storage.googleapis.com/anyplot-images/plots/candlestick-volume/python/plotnine/plot-dark.png",
  "quality_score": 91.0,
  "license": "MIT",
  "guide": "https://anyplot.ai/llms.txt"
}
Part of Stock Candlestick Chart with Volume on anyplot.ai.