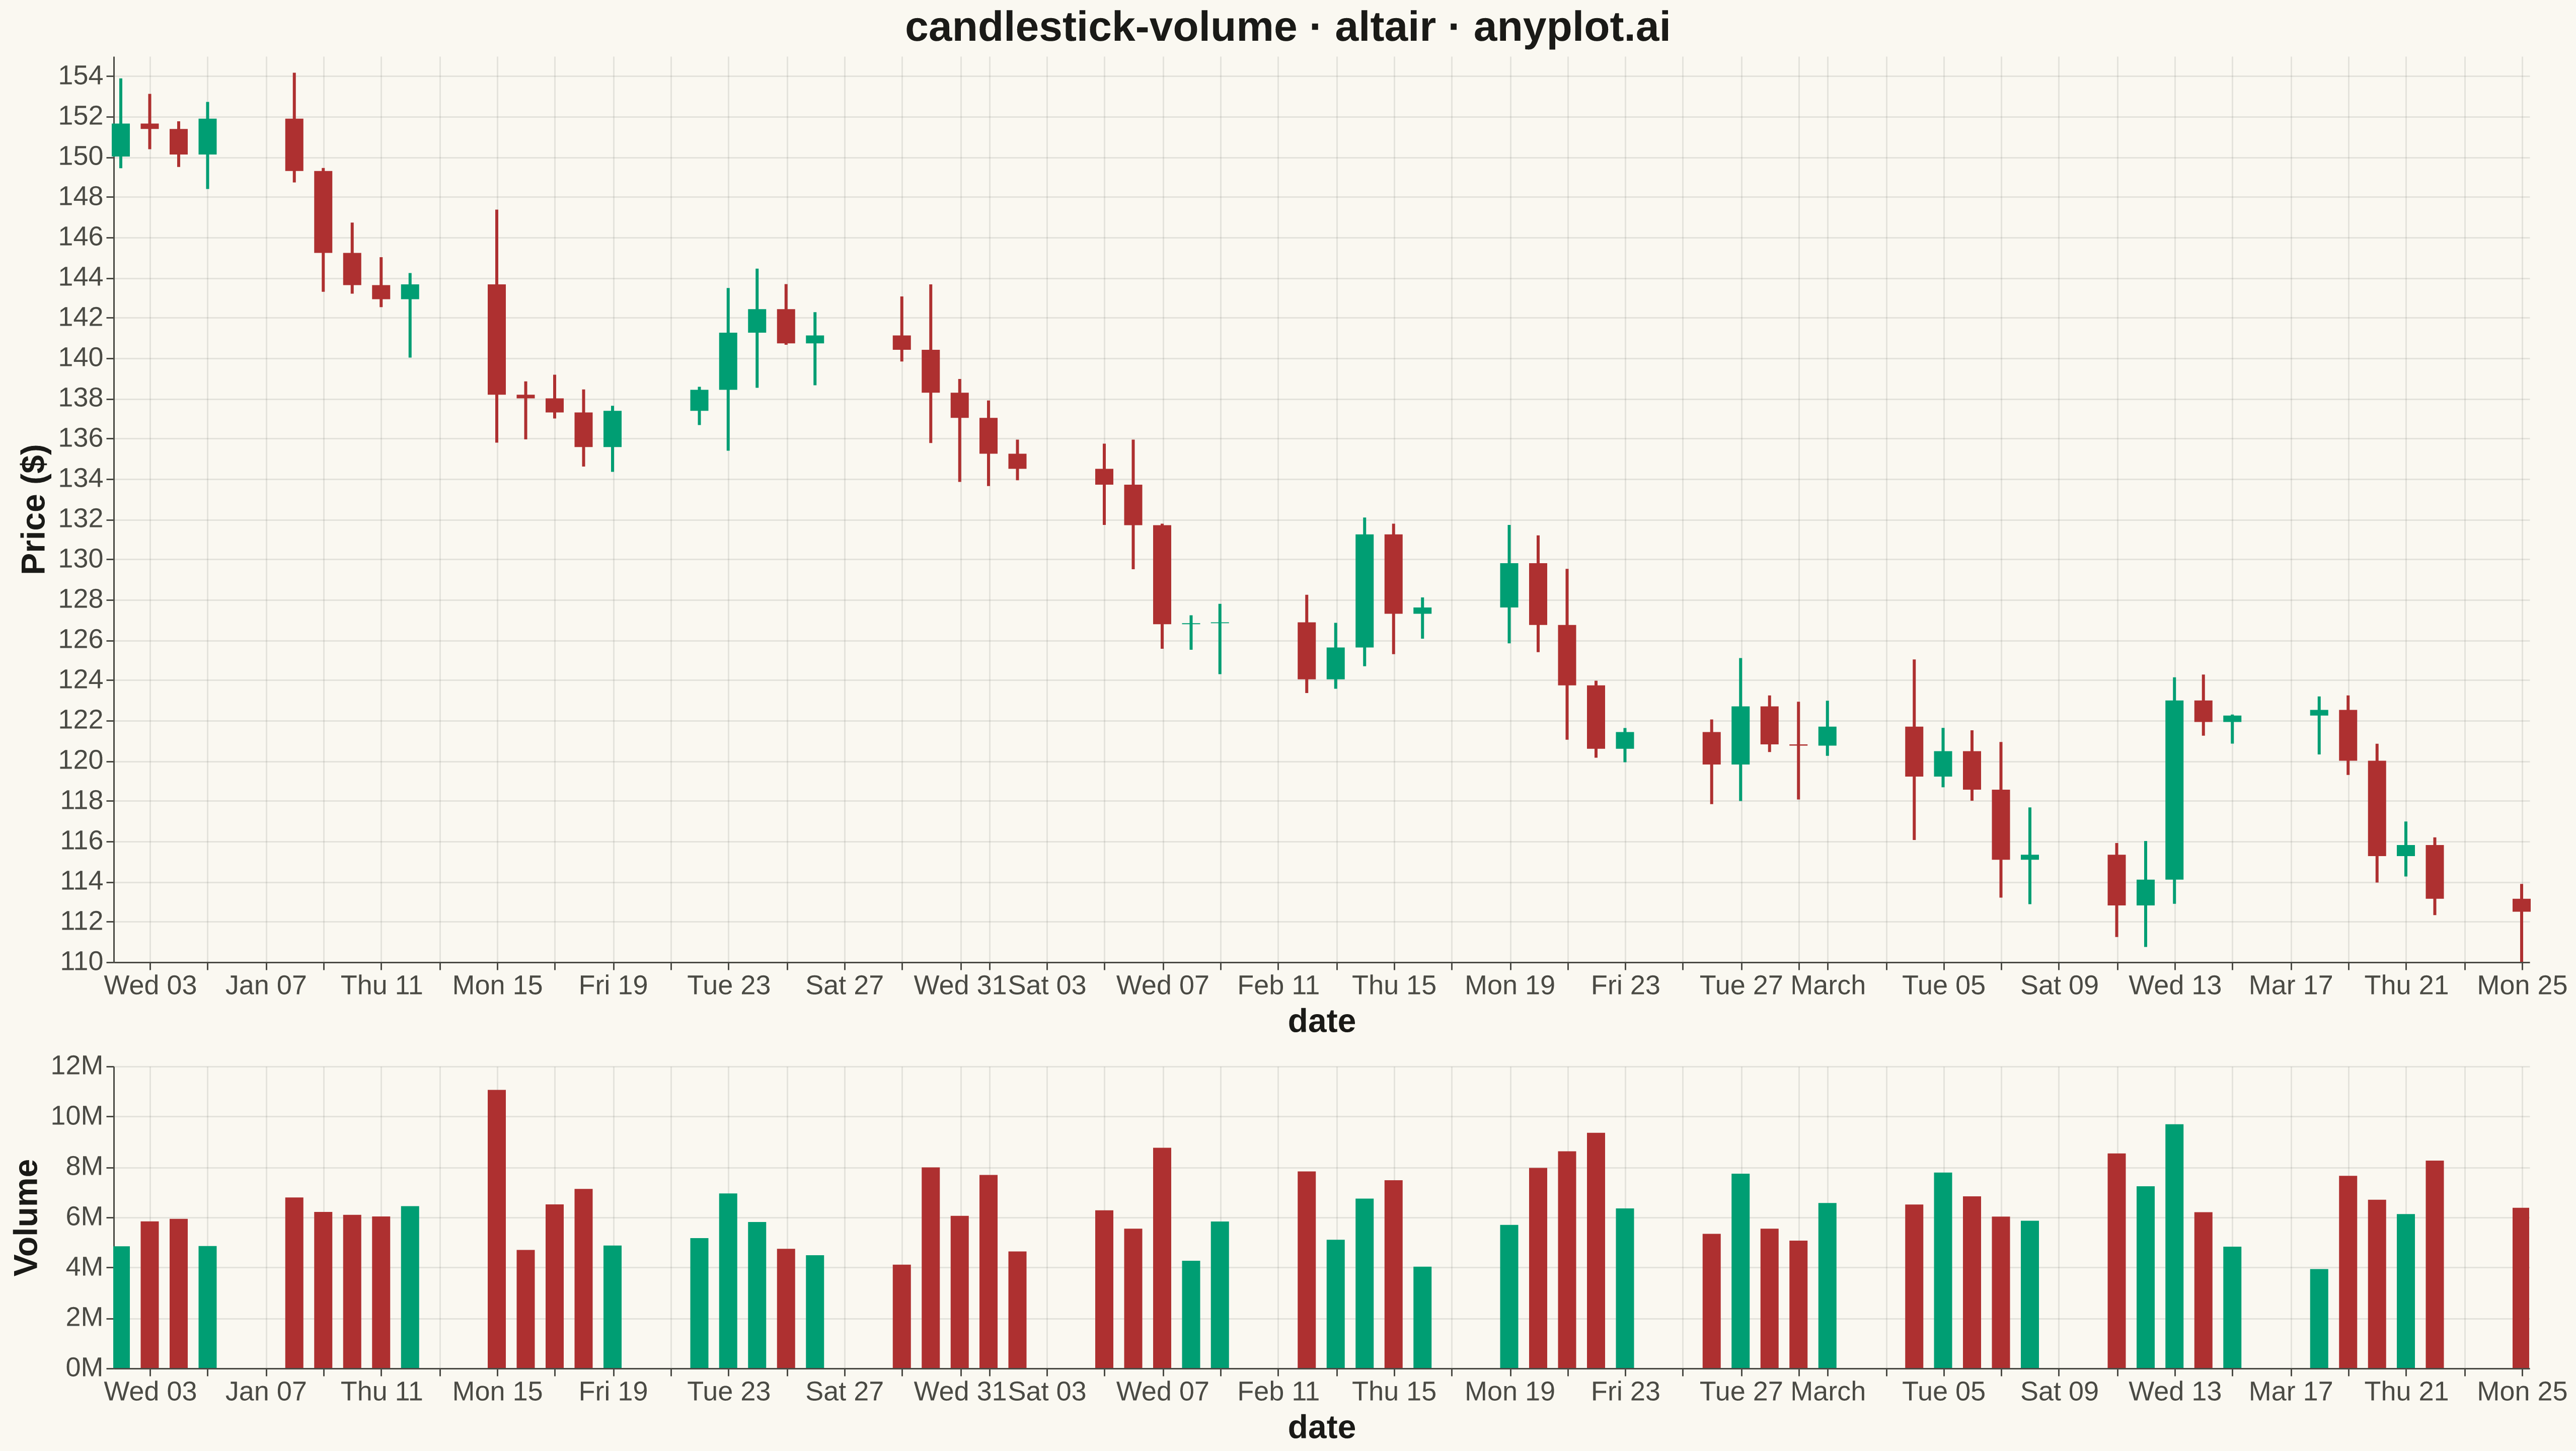
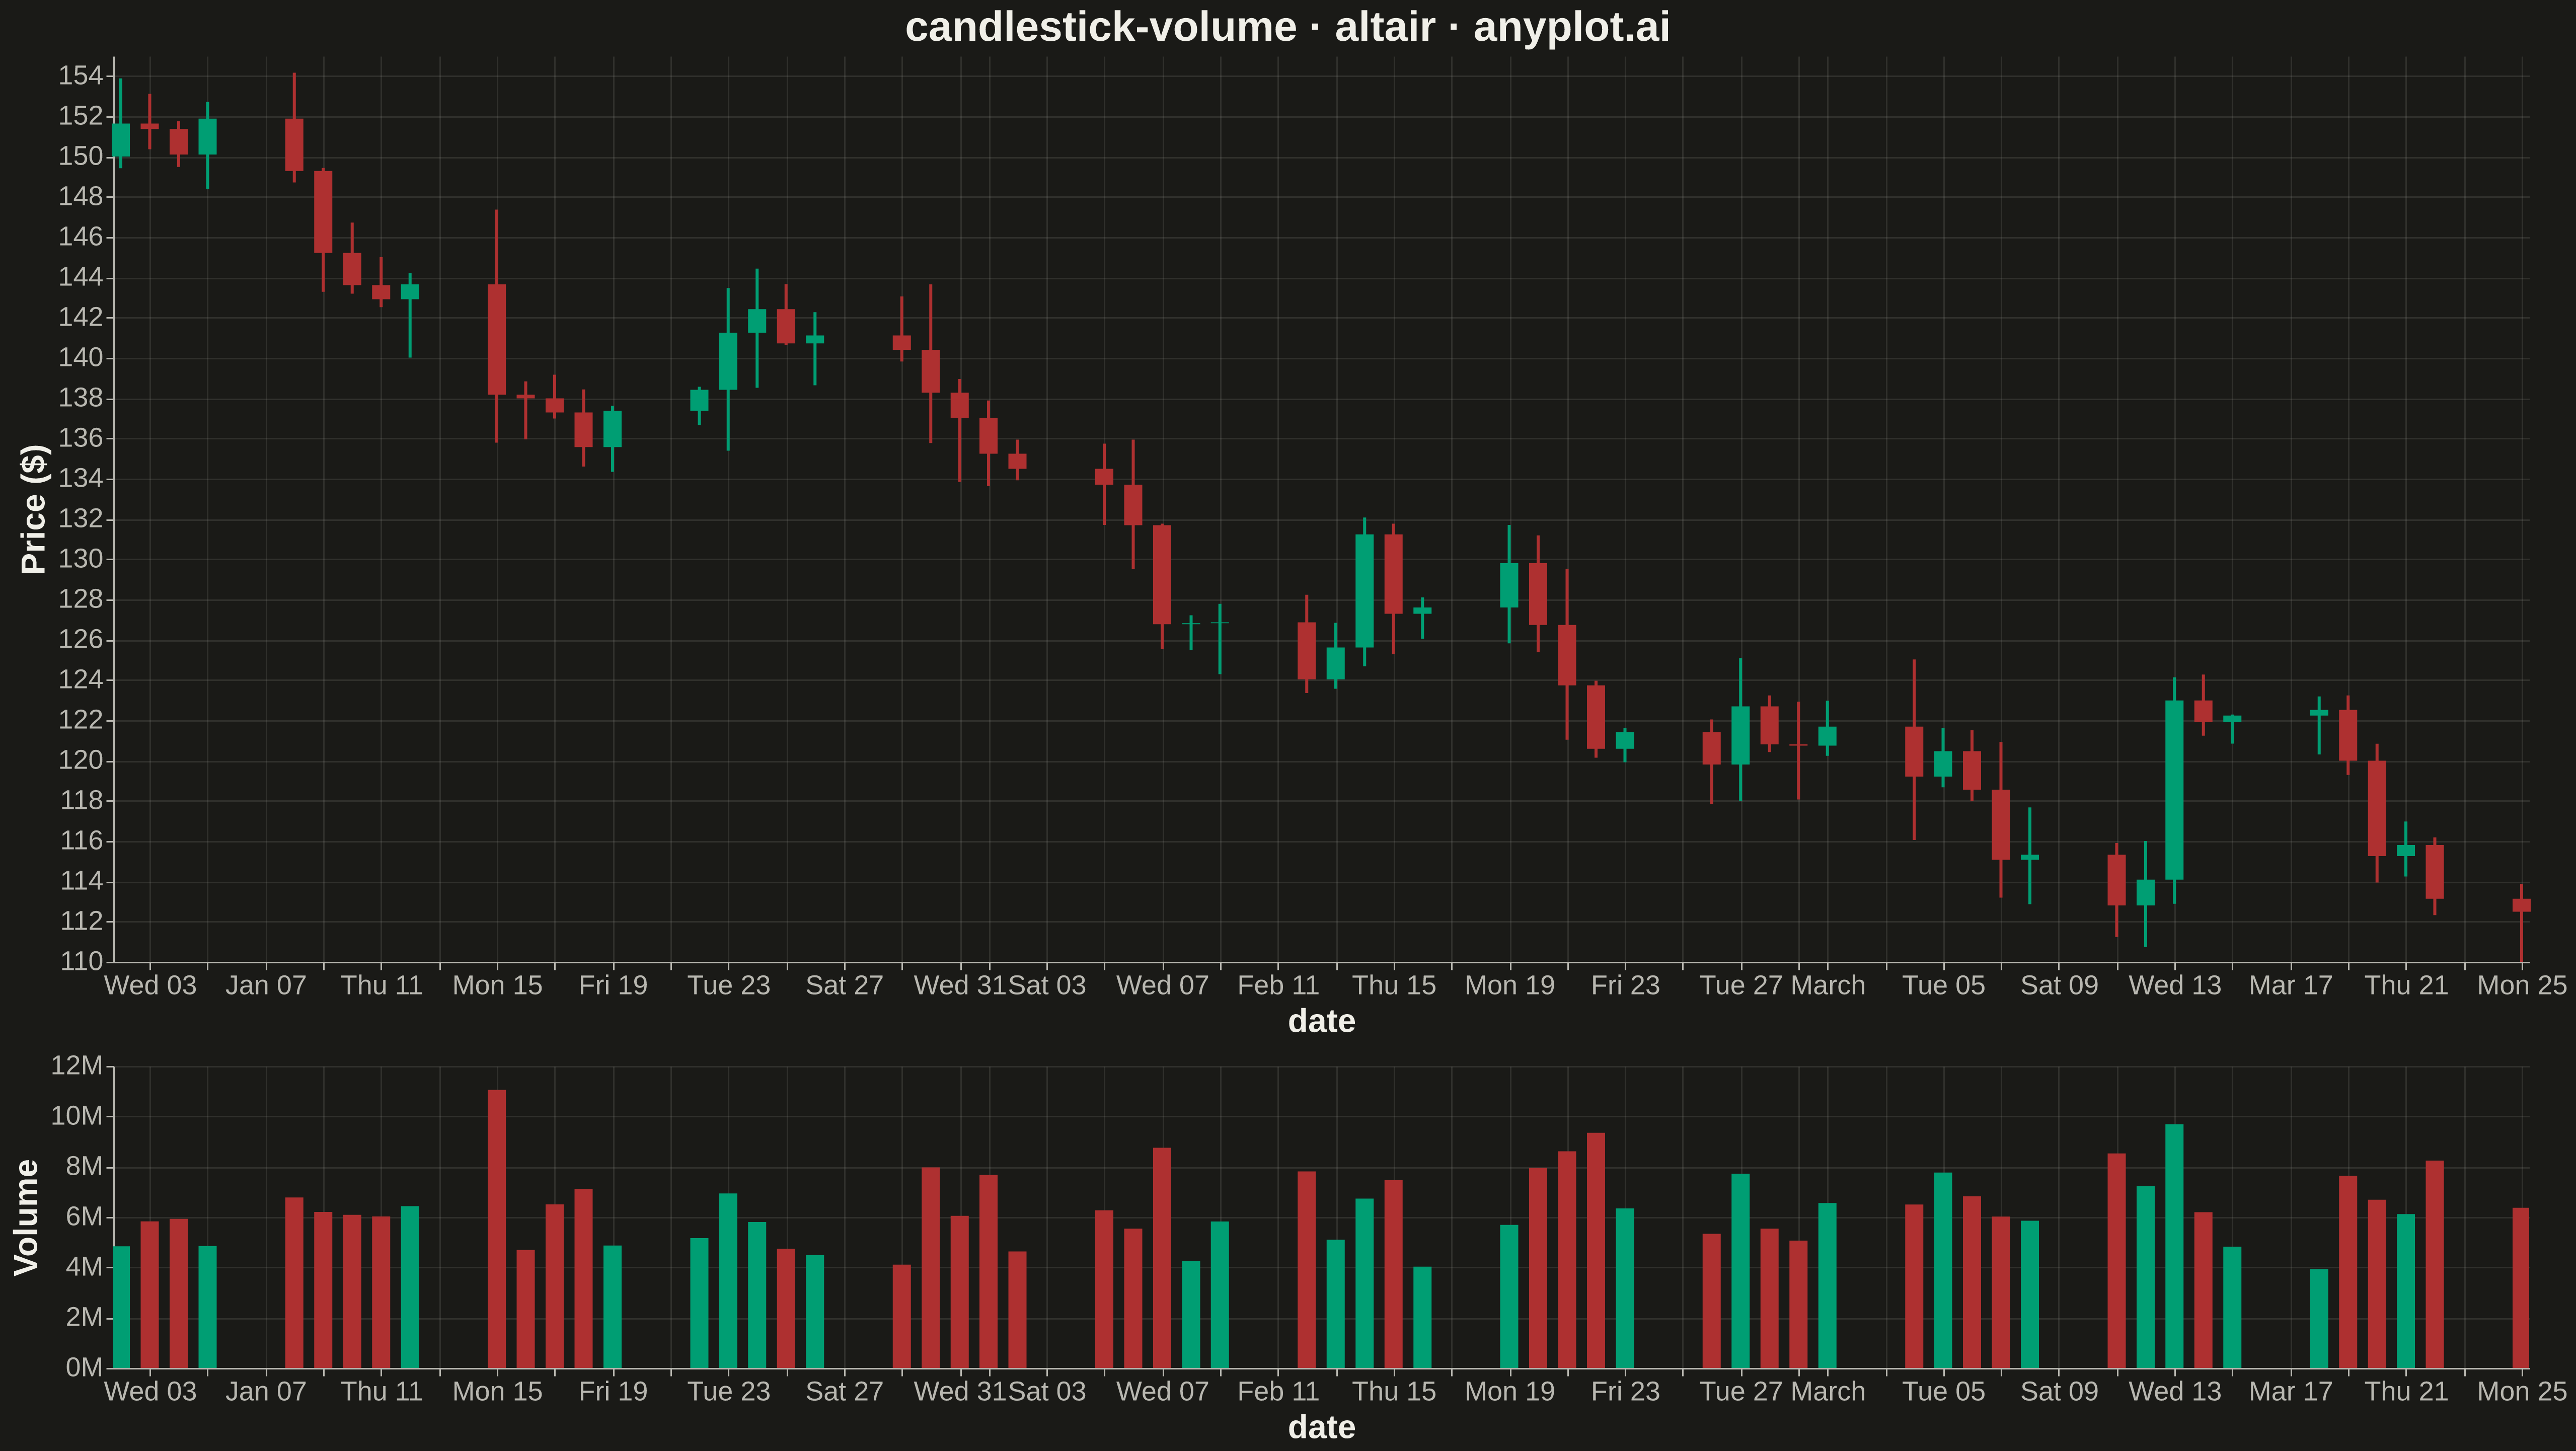
A professional candlestick chart combining OHLC (open, high, low, close) price data with volume bars in a synchronized lower pane. The dual-pane layout presents price action in the main chart with corresponding trading volume below, sharing a common time axis. This format is the standard for technical analysis platforms, enabling traders to correlate price movements with trading activity and identify volume-confirmed trends or reversals.
""" anyplot.ai
candlestick-volume: Stock Candlestick Chart with Volume
Library: altair 6.1.0 | Python 3.13.13
Quality: 86/100 | Updated: 2026-05-16
"""

import os

import altair as alt
import numpy as np
import pandas as pd


# Theme tokens
THEME = os.getenv("ANYPLOT_THEME", "light")
PAGE_BG = "#FAF8F1" if THEME == "light" else "#1A1A17"
ELEVATED_BG = "#FFFDF6" if THEME == "light" else "#242420"
INK = "#1A1A17" if THEME == "light" else "#F0EFE8"
INK_SOFT = "#4A4A44" if THEME == "light" else "#B8B7B0"
INK_MUTED = "#6B6A63" if THEME == "light" else "#A8A79F"

# Okabe-Ito palette
BULLISH = "#009E73"  # Okabe-Ito position 1 (bluish green)
BEARISH = "#AE3030"  # imprint red — bearish

# Data: Generate 60 days of realistic stock OHLC data with volume
np.random.seed(42)
n_days = 60
dates = pd.date_range("2024-01-02", periods=n_days, freq="B")  # Business days

# Generate price data with realistic movements
price = 150.0  # Starting price
opens, highs, lows, closes, volumes = [], [], [], [], []

for _ in range(n_days):
    # Daily return with slight upward drift
    daily_return = np.random.normal(0.001, 0.02)
    volatility = np.random.uniform(0.01, 0.03)

    open_price = price
    close_price = price * (1 + daily_return)

    # High and low based on volatility
    intraday_high = max(open_price, close_price) * (1 + np.random.uniform(0, volatility))
    intraday_low = min(open_price, close_price) * (1 - np.random.uniform(0, volatility))

    opens.append(round(open_price, 2))
    highs.append(round(intraday_high, 2))
    lows.append(round(intraday_low, 2))
    closes.append(round(close_price, 2))

    # Volume with some variation (higher on volatile days)
    base_volume = 5000000
    vol_multiplier = 1 + abs(daily_return) * 20
    volumes.append(int(base_volume * vol_multiplier * np.random.uniform(0.7, 1.3)))

    price = close_price

df = pd.DataFrame({"date": dates, "open": opens, "high": highs, "low": lows, "close": closes, "volume": volumes})

# Determine if day is bullish (close >= open) or bearish
df["direction"] = np.where(df["close"] >= df["open"], "bullish", "bearish")

# Color scheme for candlesticks and volume (Okabe-Ito palette)
color_scale = alt.Scale(domain=["bullish", "bearish"], range=[BULLISH, BEARISH])

# Candlestick wicks (high-low lines)
wicks = (
    alt.Chart(df)
    .mark_rule(strokeWidth=2)
    .encode(
        x=alt.X(
            "date:T",
            axis=alt.Axis(
                labelFontSize=18,
                titleFontSize=22,
                labelColor=INK_SOFT,
                titleColor=INK,
                domainColor=INK_SOFT,
                tickColor=INK_SOFT,
                gridColor=INK_MUTED,
                gridOpacity=0.15,
            ),
        ),
        y=alt.Y(
            "low:Q",
            scale=alt.Scale(zero=False),
            axis=alt.Axis(
                title="Price ($)",
                labelFontSize=18,
                titleFontSize=22,
                labelColor=INK_SOFT,
                titleColor=INK,
                domainColor=INK_SOFT,
                tickColor=INK_SOFT,
                gridColor=INK_MUTED,
                gridOpacity=0.15,
            ),
        ),
        y2="high:Q",
        color=alt.Color("direction:N", scale=color_scale, legend=None),
    )
)

# Candlestick bodies (open-close bars)
bodies = (
    alt.Chart(df)
    .mark_bar(size=12)
    .encode(
        x=alt.X("date:T"),
        y=alt.Y("open:Q", scale=alt.Scale(zero=False)),
        y2="close:Q",
        color=alt.Color("direction:N", scale=color_scale, legend=None),
        tooltip=[
            alt.Tooltip("date:T", title="Date", format="%Y-%m-%d"),
            alt.Tooltip("open:Q", title="Open", format="$.2f"),
            alt.Tooltip("high:Q", title="High", format="$.2f"),
            alt.Tooltip("low:Q", title="Low", format="$.2f"),
            alt.Tooltip("close:Q", title="Close", format="$.2f"),
            alt.Tooltip("volume:Q", title="Volume", format=","),
        ],
    )
)

# Combine wicks and bodies for candlestick chart
candlestick = (wicks + bodies).properties(width=1600, height=600, title="")

# Volume chart
volume = (
    alt.Chart(df)
    .mark_bar(size=12)
    .encode(
        x=alt.X(
            "date:T",
            axis=alt.Axis(
                labelFontSize=18,
                titleFontSize=22,
                labelColor=INK_SOFT,
                titleColor=INK,
                domainColor=INK_SOFT,
                tickColor=INK_SOFT,
                gridColor=INK_MUTED,
                gridOpacity=0.15,
            ),
        ),
        y=alt.Y(
            "volume:Q",
            axis=alt.Axis(
                title="Volume",
                labelFontSize=18,
                titleFontSize=22,
                labelColor=INK_SOFT,
                titleColor=INK,
                domainColor=INK_SOFT,
                tickColor=INK_SOFT,
                gridColor=INK_MUTED,
                gridOpacity=0.15,
                format="~s",
            ),
        ),
        color=alt.Color("direction:N", scale=color_scale, legend=None),
        tooltip=[
            alt.Tooltip("date:T", title="Date", format="%Y-%m-%d"),
            alt.Tooltip("volume:Q", title="Volume", format=","),
        ],
    )
    .properties(width=1600, height=200)
)

# Combine candlestick and volume vertically with interactive features
combined = (
    alt.vconcat(candlestick, volume, spacing=10)
    .properties(
        title=alt.Title("candlestick-volume · altair · anyplot.ai", fontSize=28, anchor="middle", color=INK),
        background=PAGE_BG,
    )
    .interactive()
)

# Configure chart with theme-adaptive styling
chart = (
    combined.configure_axis(
        labelFontSize=18,
        titleFontSize=22,
        labelColor=INK_SOFT,
        titleColor=INK,
        domainColor=INK_SOFT,
        tickColor=INK_SOFT,
        gridColor=INK_MUTED,
        gridOpacity=0.15,
    )
    .configure_view(fill=PAGE_BG, strokeWidth=0)
    .configure_title(color=INK, fontSize=28)
)

# Save as PNG with theme suffix (scale_factor=3 for 4800x2700)
chart.save(f"plot-{THEME}.png", scale_factor=3.0)

# Save interactive HTML version with theme suffix
chart.save(f"plot-{THEME}.html")
Runnable source as JSON, for any HTTP client: https://api.anyplot.ai/specs/candlestick-volume/altair/code. Any spec id and library id listed in llms-full.txt fit the same URL shape; every URL below is complete and callable.
{
  "spec_id": "candlestick-volume",
  "language": "python",
  "library": "altair",
  "page": "https://anyplot.ai/candlestick-volume/python/altair",
  "hub": "https://anyplot.ai/candlestick-volume",
  "code_json": "https://api.anyplot.ai/specs/candlestick-volume/altair/code",
  "spec_json": "https://api.anyplot.ai/specs/candlestick-volume",
  "render_light_png": "https://storage.googleapis.com/anyplot-images/plots/candlestick-volume/python/altair/plot-light.png",
  "render_dark_png": "https://storage.googleapis.com/anyplot-images/plots/candlestick-volume/python/altair/plot-dark.png",
  "interactive_light_html": "https://storage.googleapis.com/anyplot-images/plots/candlestick-volume/python/altair/plot-light.html",
  "interactive_dark_html": "https://storage.googleapis.com/anyplot-images/plots/candlestick-volume/python/altair/plot-dark.html",
  "quality_score": 86.0,
  "license": "MIT",
  "guide": "https://anyplot.ai/llms.txt"
}
Part of Stock Candlestick Chart with Volume on anyplot.ai.