The same plot in 14 other libraries — Python: Altair, Bokeh, lets-plot, Matplotlib, Plotly, plotnine, Pygal, Seaborn; R: ggplot2; JavaScript: Chart.js, D3.js, Apache ECharts, Highcharts, MUI X Charts. Compare all 15 side by side: Stock Candlestick Chart with Volume in Python, R, Julia and JavaScript.
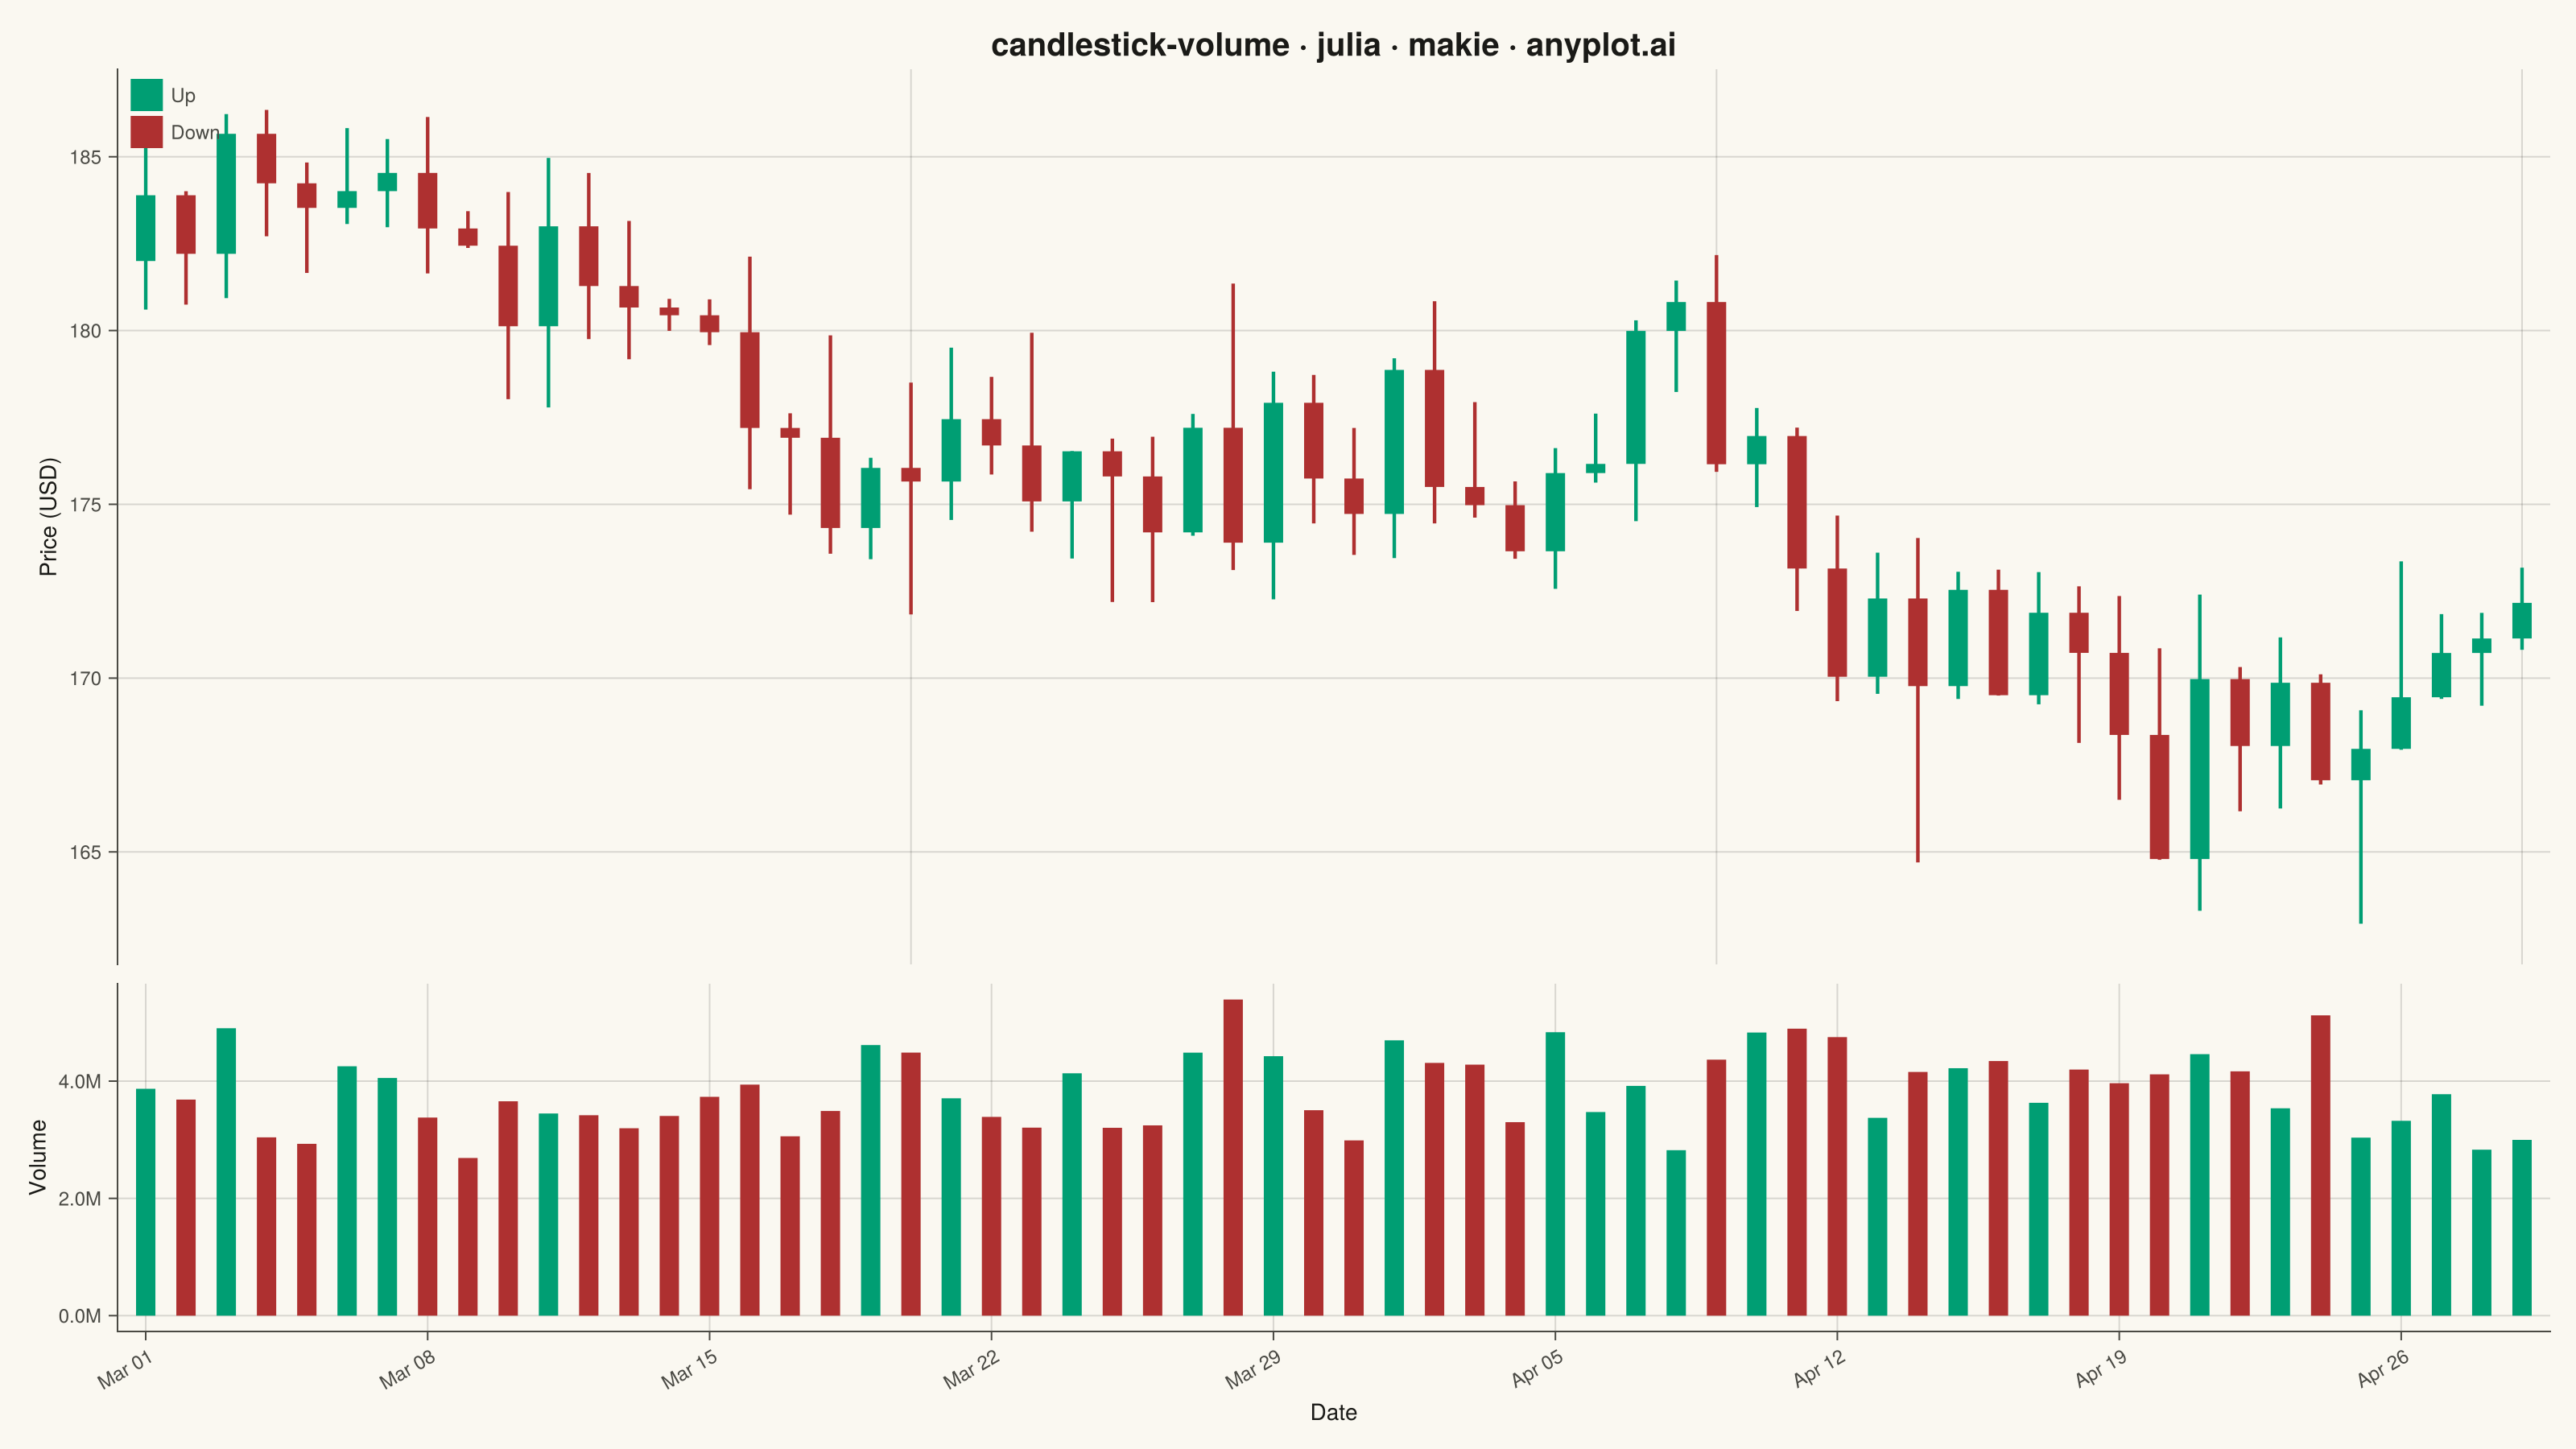
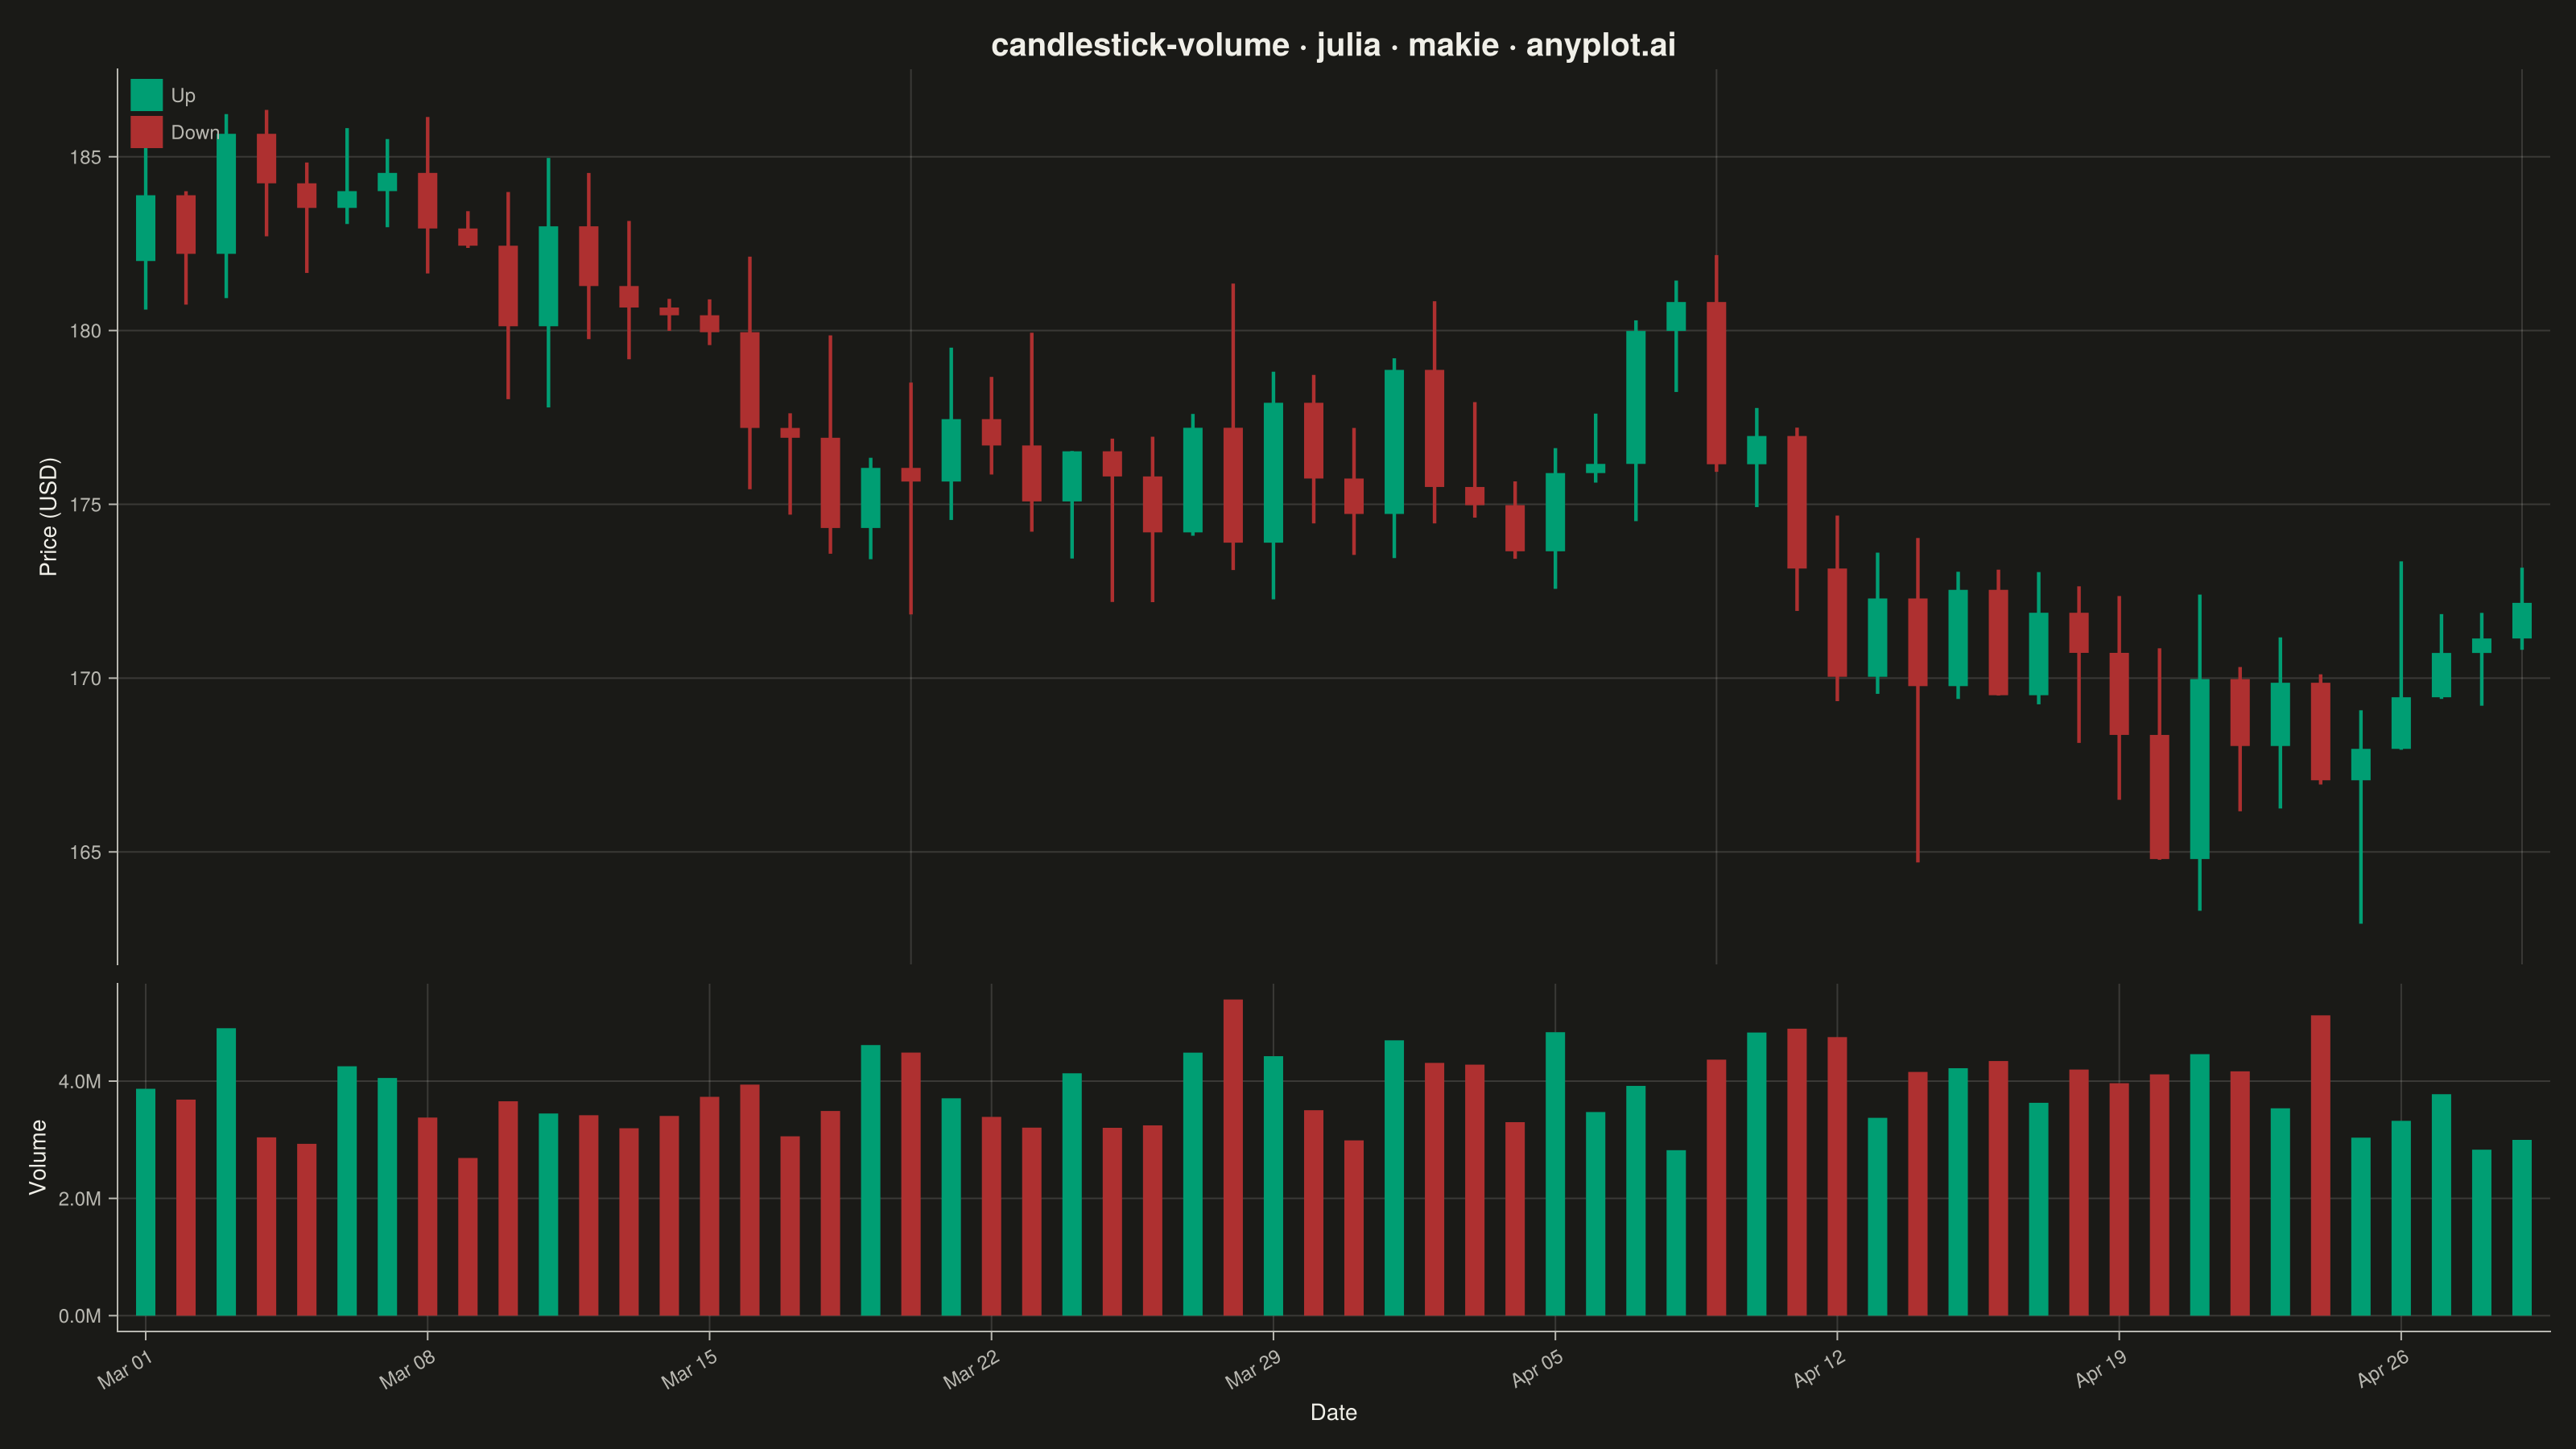
A professional candlestick chart combining OHLC (open, high, low, close) price data with volume bars in a synchronized lower pane. The dual-pane layout presents price action in the main chart with corresponding trading volume below, sharing a common time axis. This format is the standard for technical analysis platforms, enabling traders to correlate price movements with trading activity and identify volume-confirmed trends or reversals.
# anyplot.ai
# candlestick-volume: Stock Candlestick Chart with Volume
# Library: makie 0.21.9 | Julia 1.11.9
# Quality: 93/100 | Created: 2026-09-02

using CairoMakie
using Colors
using Random
using Dates

Random.seed!(42)

# --- Theme tokens -------------------------------------------------------
THEME    = get(ENV, "ANYPLOT_THEME", "light")
PAGE_BG  = THEME == "light" ? colorant"#FAF8F1" : colorant"#1A1A17"
ELEVATED_BG = THEME == "light" ? colorant"#FFFDF6" : colorant"#242420"
INK      = THEME == "light" ? colorant"#1A1A17" : colorant"#F0EFE8"
INK_SOFT = THEME == "light" ? colorant"#4A4A44" : colorant"#B8B7B0"
UP_COLOR   = colorant"#009E73"  # Imprint position 1 — bullish/up (finance semantic exception)
DOWN_COLOR = colorant"#AE3030"  # Imprint position 5 — bearish/down (semantic anchor for loss)

# --- Data: simulated daily OHLCV for a technology stock ------------------
n_days = 60
trade_dates = Date(2024, 3, 1) .+ Day.(0:(n_days - 1))

open_prices  = Vector{Float64}(undef, n_days)
close_prices = Vector{Float64}(undef, n_days)
high_prices  = Vector{Float64}(undef, n_days)
low_prices   = Vector{Float64}(undef, n_days)
volumes      = Vector{Float64}(undef, n_days)

price = 182.0
for i in 1:n_days
    o = price
    c = max(o + randn() * 2.4, 5.0)
    h = max(o, c) + abs(randn()) * 1.6
    l = min(o, c) - abs(randn()) * 1.6
    open_prices[i]  = o
    close_prices[i] = c
    high_prices[i]  = h
    low_prices[i]   = l
    volumes[i] = 2.4e6 + abs(randn()) * 1.1e6 + abs(c - o) * 3.5e5
    global price = c
end

is_up = close_prices .>= open_prices
bar_colors = [up ? UP_COLOR : DOWN_COLOR for up in is_up]
# Hollow-vs-filled body convention: up candles are hollow (outline only), down
# candles are solid-filled. This gives CVD readers a shape cue independent of
# the green/red hue, on top of the semantic finance color convention.
body_fill_colors = [up ? PAGE_BG : DOWN_COLOR for up in is_up]
x = collect(1:n_days)

wick_points = Vector{Point2f}(undef, 2 * n_days)
for i in 1:n_days
    wick_points[2i - 1] = Point2f(x[i], low_prices[i])
    wick_points[2i]     = Point2f(x[i], high_prices[i])
end
wick_colors = repeat(bar_colors, inner = 2)

grid_rgba = RGBAf(INK.r, INK.g, INK.b, 0.15)

# --- Plot -----------------------------------------------------------------
fig = Figure(
    resolution      = (1600, 900),
    fontsize        = 14,
    backgroundcolor = PAGE_BG,
)

ax_price = Axis(
    fig[1, 1];
    title               = "candlestick-volume · julia · makie · anyplot.ai",
    titlesize           = 20,
    titlecolor          = INK,
    ylabel              = "Price (USD)",
    ylabelsize          = 14,
    ylabelcolor         = INK,
    yticklabelsize      = 12,
    yticklabelcolor     = INK_SOFT,
    ytickcolor          = INK_SOFT,
    backgroundcolor     = PAGE_BG,
    topspinevisible     = false,
    rightspinevisible   = false,
    bottomspinevisible  = false,
    leftspinecolor      = INK_SOFT,
    xticksvisible       = false,
    xticklabelsvisible  = false,
    xgridcolor          = grid_rgba,
    ygridcolor          = grid_rgba,
    xminorgridvisible   = false,
    yminorgridvisible   = false,
)

ax_volume = Axis(
    fig[2, 1];
    xlabel              = "Date",
    xlabelsize          = 14,
    xlabelcolor         = INK,
    ylabel              = "Volume (millions)",
    ylabelsize          = 14,
    ylabelcolor         = INK,
    xticklabelsize      = 12,
    yticklabelsize      = 12,
    xticklabelcolor     = INK_SOFT,
    yticklabelcolor     = INK_SOFT,
    xtickcolor          = INK_SOFT,
    ytickcolor          = INK_SOFT,
    backgroundcolor     = PAGE_BG,
    topspinevisible     = false,
    rightspinevisible   = false,
    leftspinecolor      = INK_SOFT,
    bottomspinecolor    = INK_SOFT,
    xgridcolor          = grid_rgba,
    ygridcolor          = grid_rgba,
    xminorgridvisible   = false,
    yminorgridvisible   = false,
    xticks              = (x[1:7:end], Dates.format.(trade_dates[1:7:end], "u dd")),
    xticklabelrotation  = pi / 6,
    ytickformat         = vals -> [string(round(v / 1e6, digits = 1), "M") for v in vals],
)

linkxaxes!(ax_price, ax_volume)
xlims!(ax_price, 0.3, n_days + 0.7)
xlims!(ax_volume, 0.3, n_days + 0.7)

# Extra headroom above the highest wick keeps the top-left legend clear of
# the earliest candles regardless of where the price series peaks.
price_span = maximum(high_prices) - minimum(low_prices)
ylims!(ax_price, minimum(low_prices) - 0.05 * price_span, maximum(high_prices) + 0.18 * price_span)

linesegments!(ax_price, wick_points; color = wick_colors, linewidth = 2.2)
barplot!(
    ax_price, x, close_prices;
    fillto = open_prices, color = body_fill_colors,
    strokecolor = bar_colors, strokewidth = 2.2, width = 0.6,
)
barplot!(ax_volume, x, volumes; color = bar_colors, width = 0.6)

rowsize!(fig.layout, 1, Relative(0.72))
rowsize!(fig.layout, 2, Relative(0.28))
rowgap!(fig.layout, 12)

legend_elements = [
    PolyElement(color = PAGE_BG, strokecolor = UP_COLOR, strokewidth = 2.2),
    PolyElement(color = DOWN_COLOR, strokecolor = DOWN_COLOR, strokewidth = 2.2),
]
Legend(
    fig[1, 1], legend_elements, ["Up", "Down"];
    tellwidth = false, tellheight = false,
    halign = :left, valign = :top,
    labelcolor = INK_SOFT, labelsize = 12,
    backgroundcolor = (ELEVATED_BG, 0.85),
    framevisible = false,
    padding = (8, 8, 6, 6),
)

# --- Save -------------------------------------------------------------------
save("plot-$(THEME).png", fig; px_per_unit = 2)
Runnable source as JSON, for any HTTP client: https://api.anyplot.ai/specs/candlestick-volume/makie/code. Any spec id and library id listed in llms-full.txt fit the same URL shape; every URL below is complete and callable.
{
  "spec_id": "candlestick-volume",
  "language": "julia",
  "library": "makie",
  "page": "https://anyplot.ai/candlestick-volume/julia/makie",
  "hub": "https://anyplot.ai/candlestick-volume",
  "code_json": "https://api.anyplot.ai/specs/candlestick-volume/makie/code",
  "spec_json": "https://api.anyplot.ai/specs/candlestick-volume",
  "render_light_png": "https://storage.googleapis.com/anyplot-images/plots/candlestick-volume/julia/makie/plot-light.png",
  "render_dark_png": "https://storage.googleapis.com/anyplot-images/plots/candlestick-volume/julia/makie/plot-dark.png",
  "quality_score": 93.0,
  "license": "MIT",
  "guide": "https://anyplot.ai/llms.txt"
}
Part of Stock Candlestick Chart with Volume on anyplot.ai.