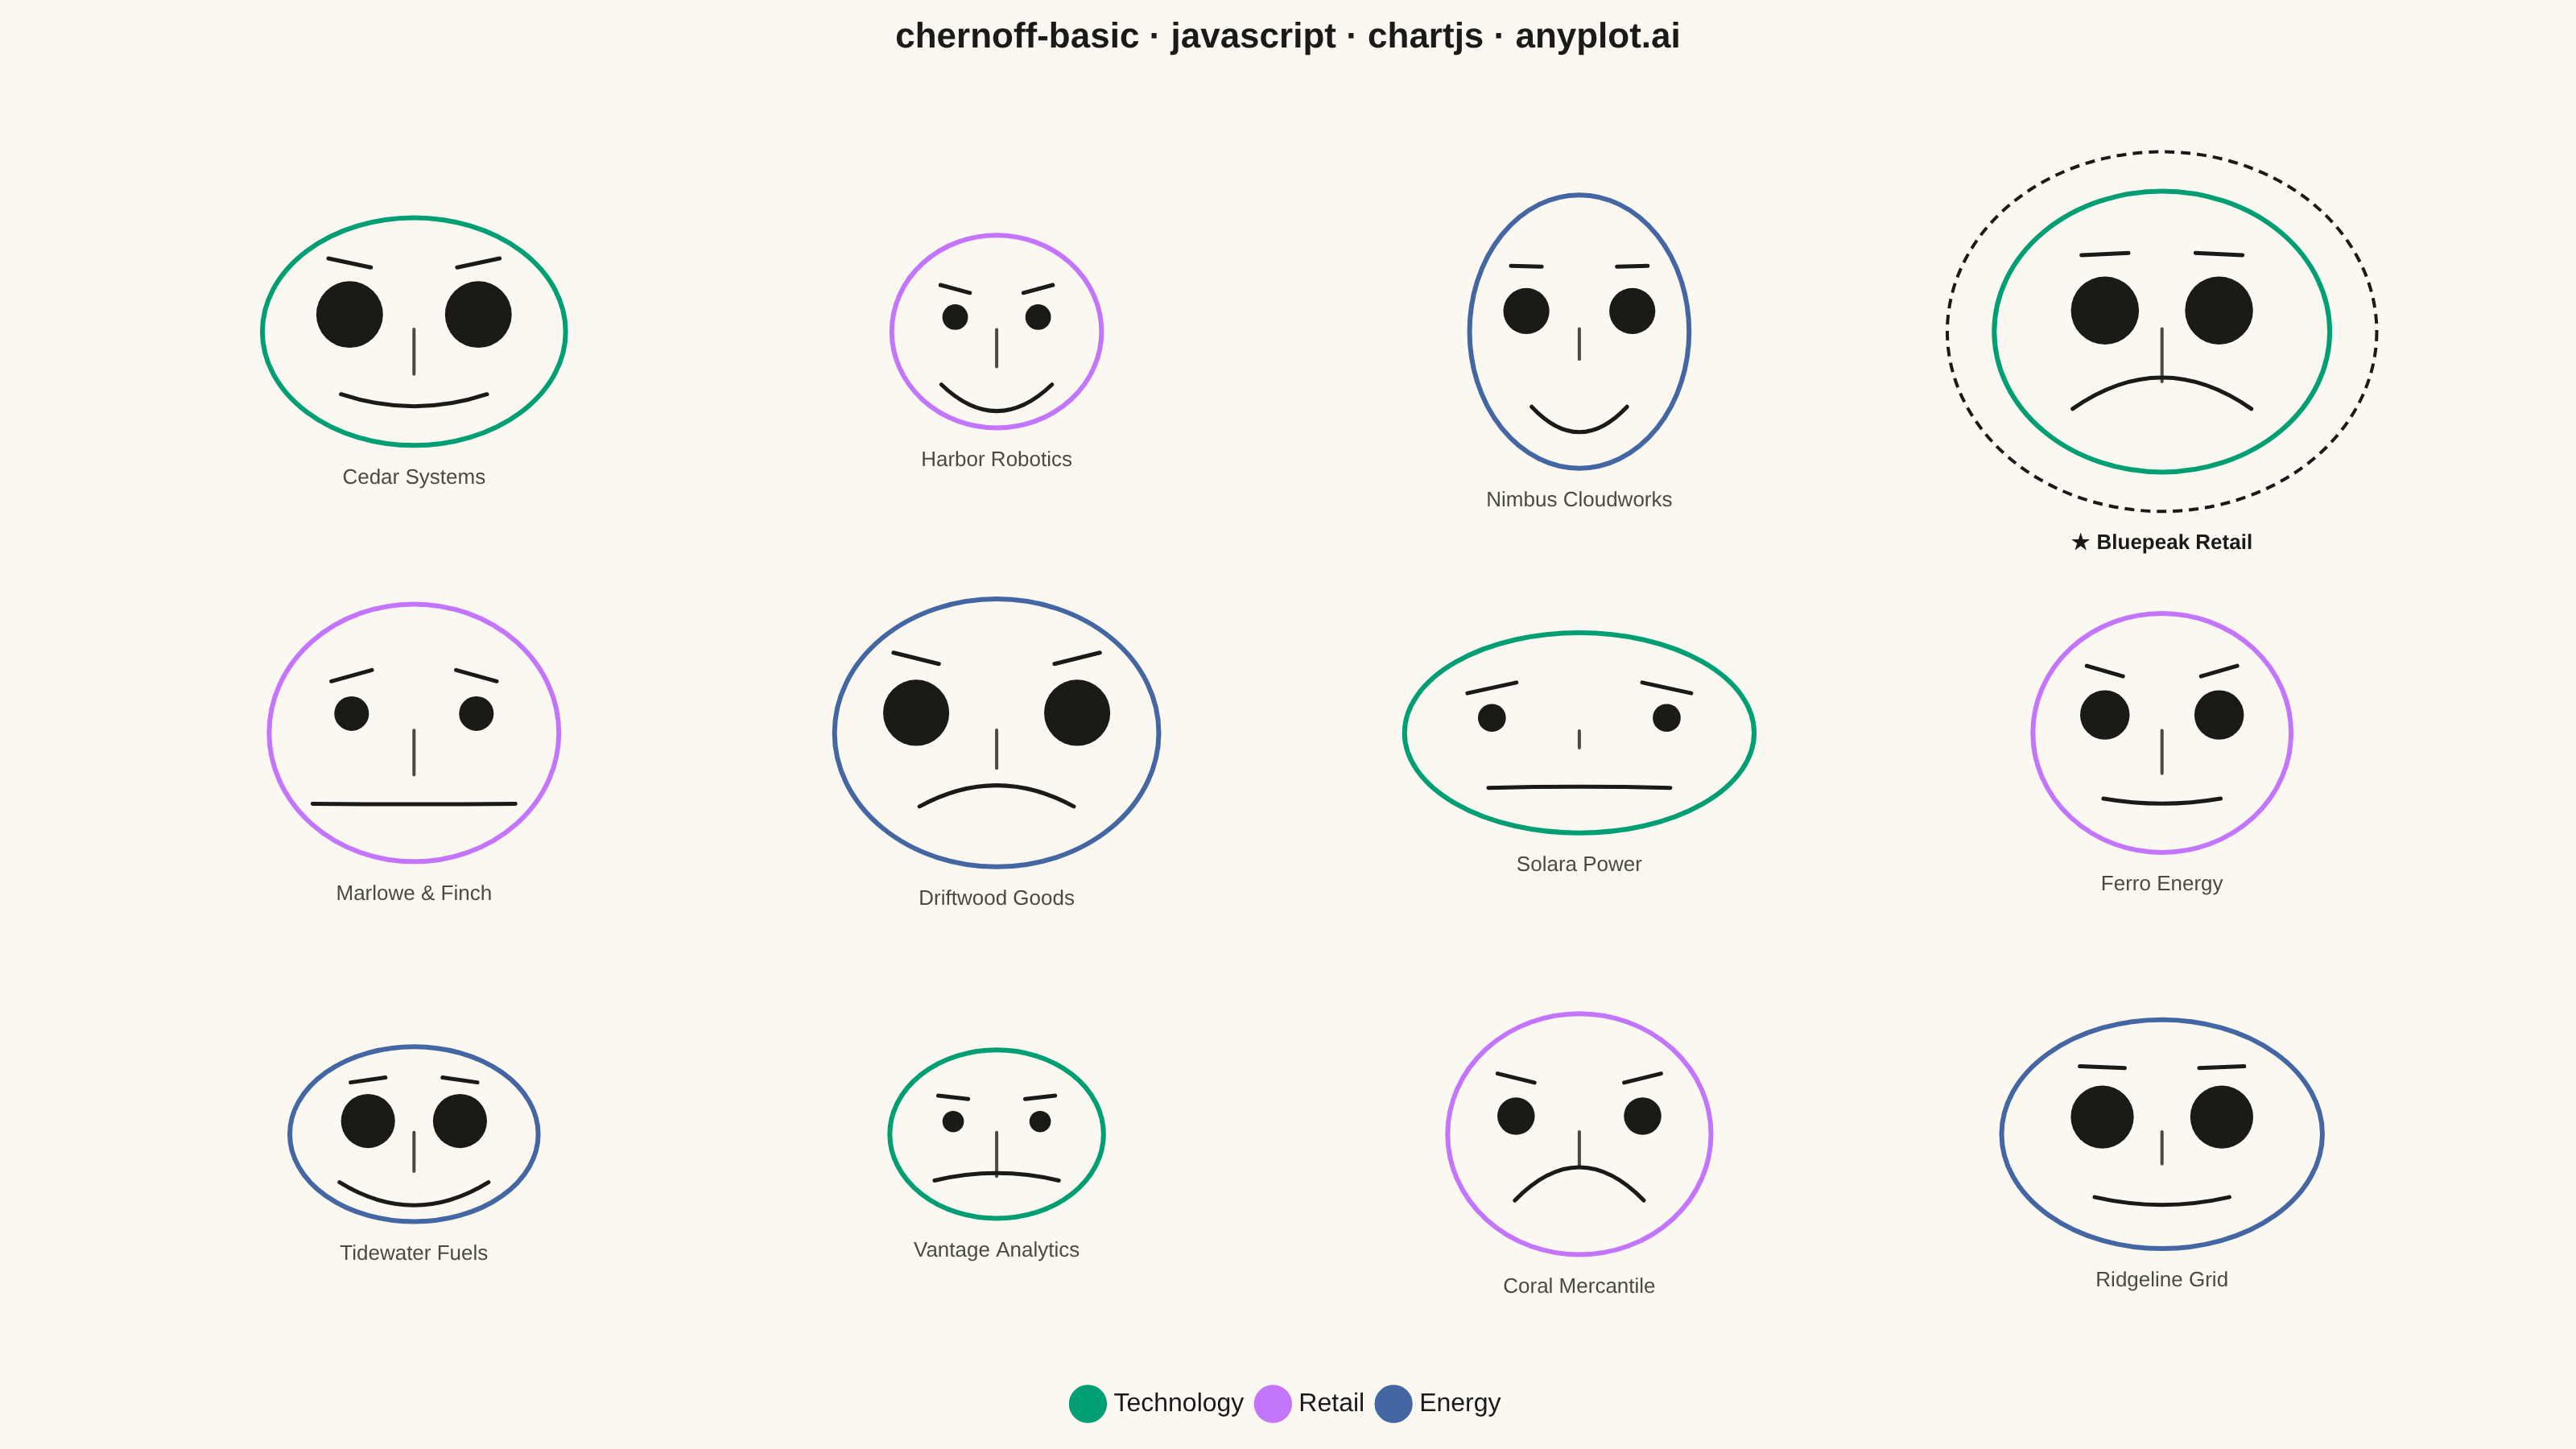
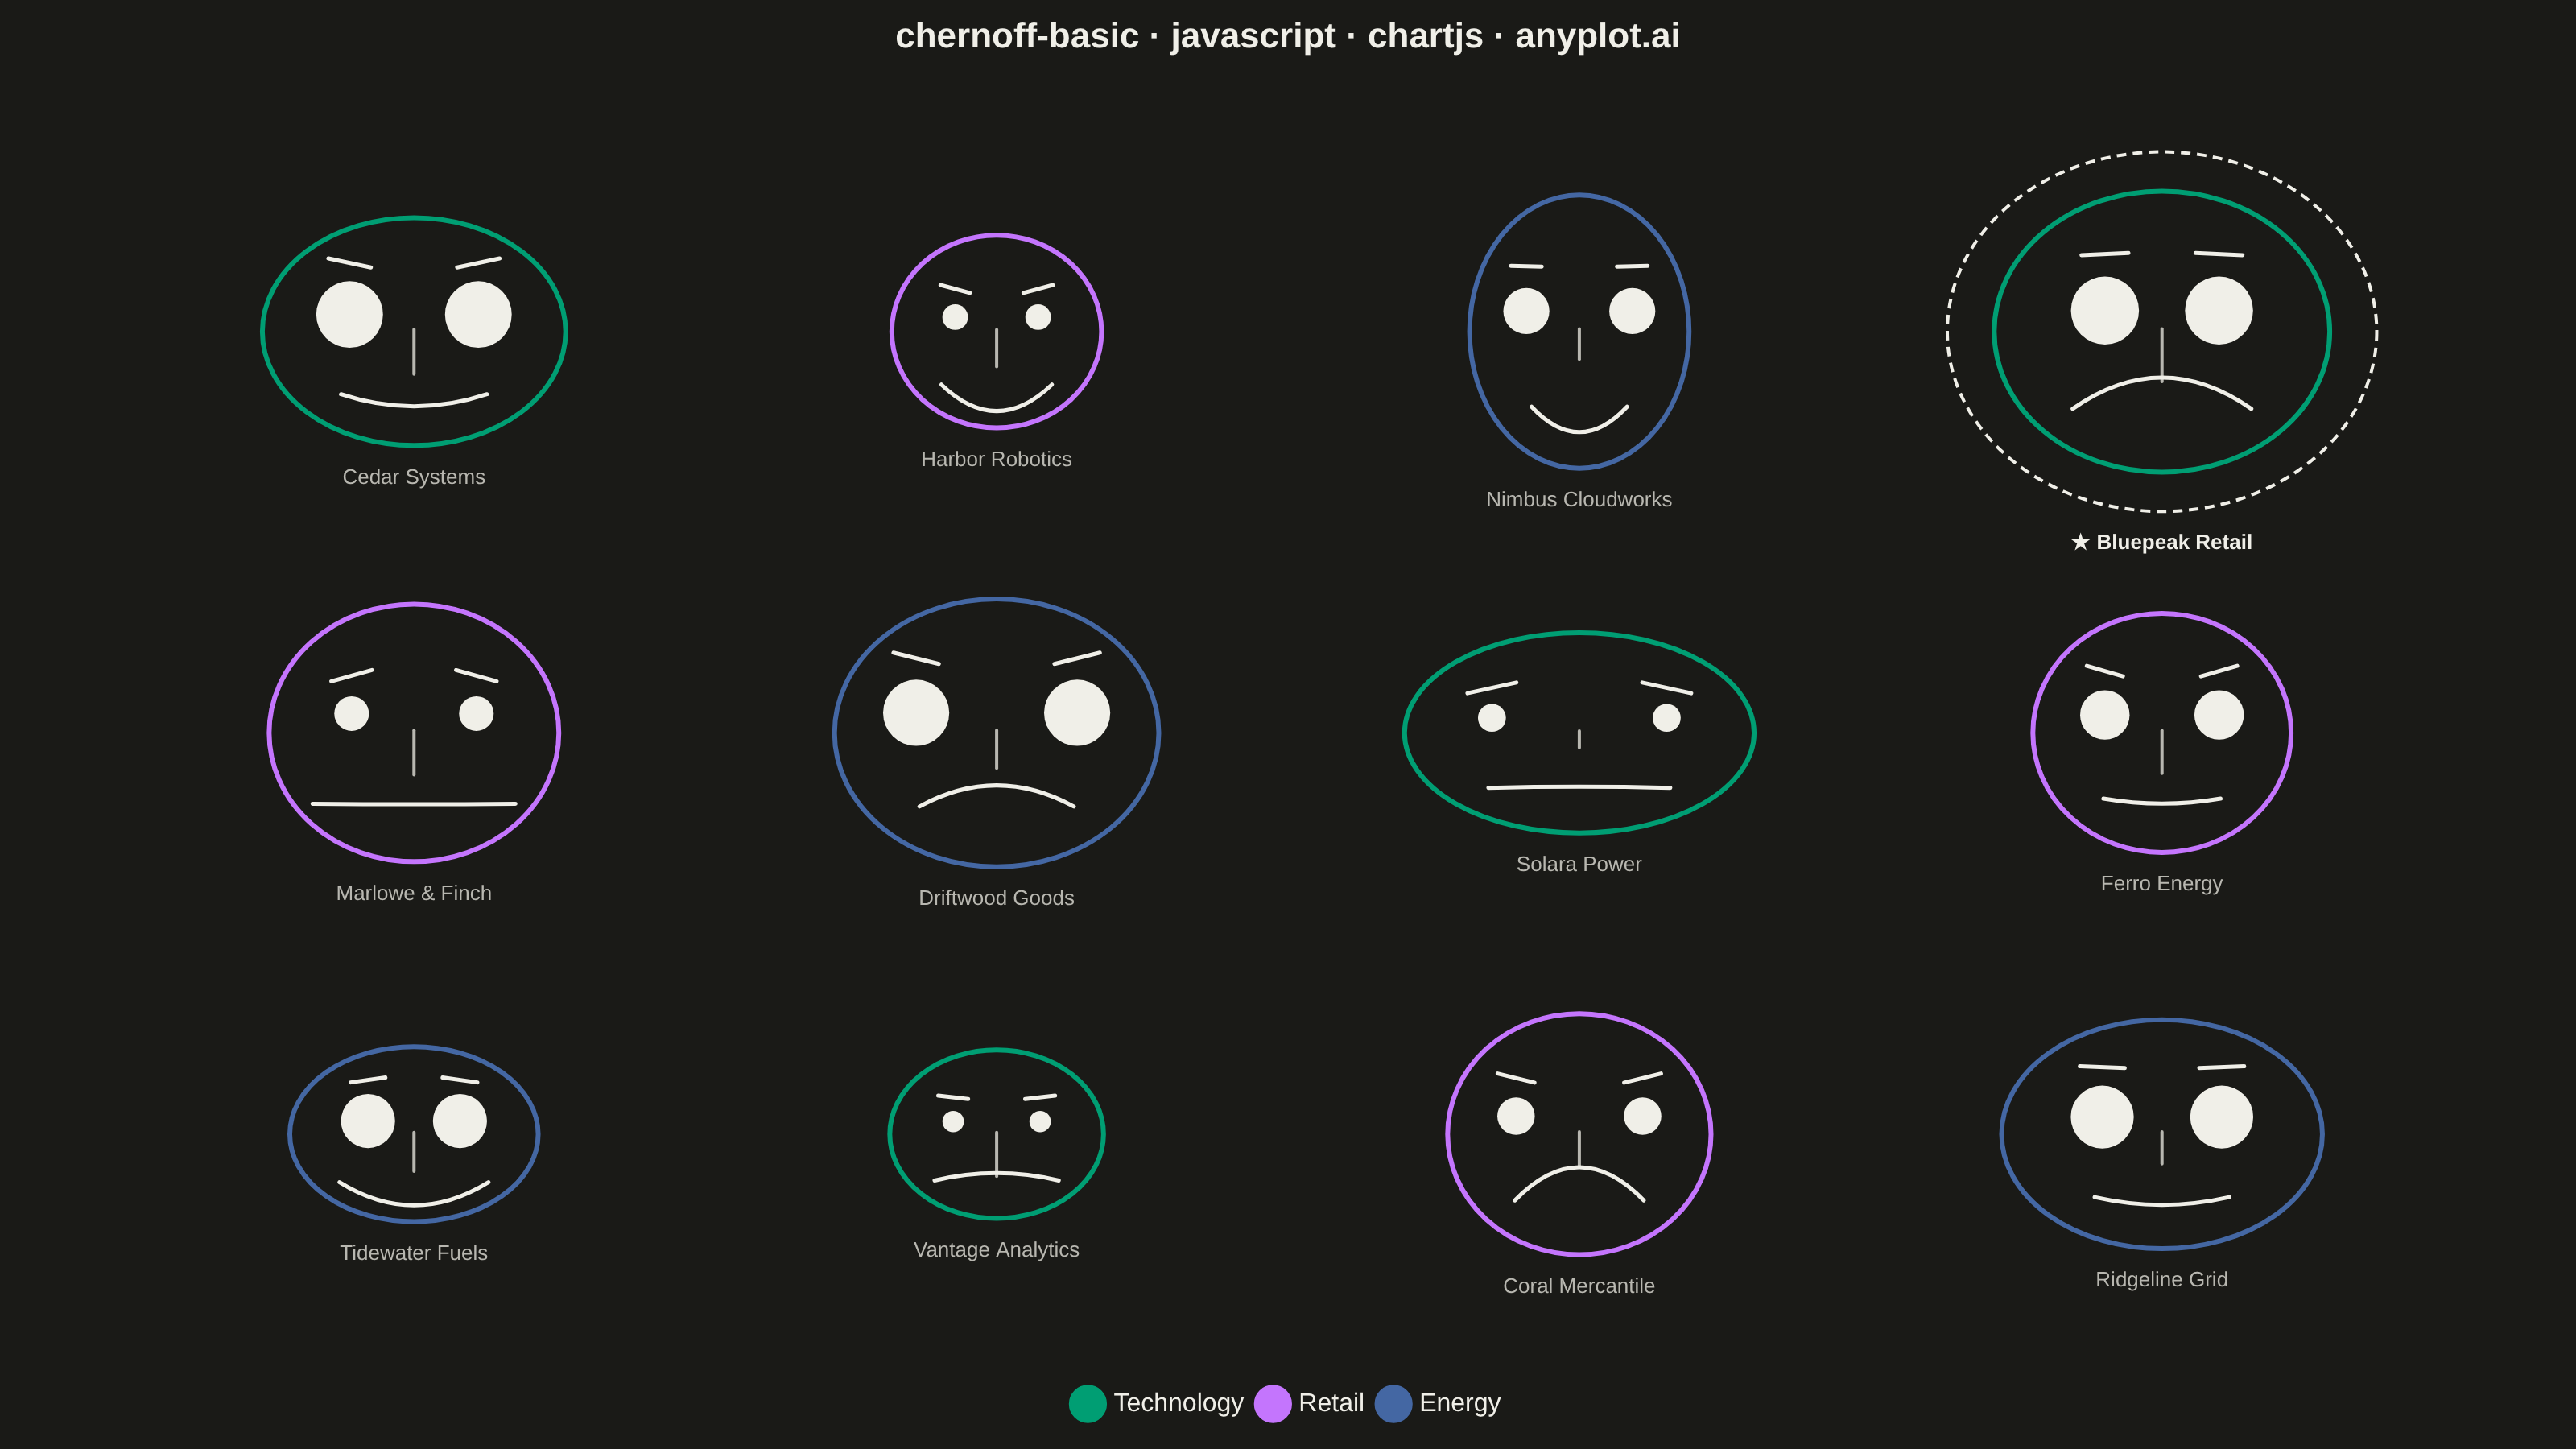
The same plot in 14 other libraries — JavaScript: D3.js, Apache ECharts, Highcharts, MUI X Charts; Python: Altair, Bokeh, lets-plot, Matplotlib, Plotly, plotnine, Pygal, Seaborn; R: ggplot2; Julia: Makie.jl. Compare all 15 side by side: Chernoff Faces for Multivariate Data in Python, R, Julia and JavaScript.
Chernoff faces visualize multivariate data by mapping each variable to a facial feature (eye size, mouth curvature, face width, nose length, etc.), transforming each observation into a unique cartoon face. This technique leverages humans' innate ability to recognize and distinguish faces, making it easier to identify patterns, clusters, and outliers across multiple dimensions simultaneously.
// anyplot.ai
// chernoff-basic: Chernoff Faces for Multivariate Data
// Library: chartjs 4.4.7 | JavaScript 22.23.2
// Quality: 93/100 | Created: 2026-09-02

const t = window.ANYPLOT_TOKENS;

// --- Data (in-memory, deterministic) ----------------------------------------
// Eight financial-health metrics per company, each mapped to a distinct
// facial feature. A tiny LCG stands in for a seeded RNG (the browser has
// none).
let lcgState = 42;
function lcg() {
  lcgState = (lcgState * 1103515245 + 12345) % 2147483648;
  return lcgState / 2147483648;
}
// Stretches a 0-1 LCG draw into a realistic domain range for metrics whose
// natural units aren't a 0-100% figure (e.g. a liquidity ratio or a
// debt-to-equity multiple).
function scaleRange(v, min, max) {
  return min + v * (max - min);
}

const sectors = [
  { name: "Technology", color: t.palette[0] },
  { name: "Retail", color: t.palette[1] },
  { name: "Energy", color: t.palette[2] },
];

const companyNames = [
  "Cedar Systems",
  "Harbor Robotics",
  "Nimbus Cloudworks",
  "Bluepeak Retail",
  "Marlowe & Finch",
  "Driftwood Goods",
  "Solara Power",
  "Ferro Energy",
  "Tidewater Fuels",
  "Vantage Analytics",
  "Coral Mercantile",
  "Ridgeline Grid",
];

const companies = companyNames.map((name, i) => {
  const sector = sectors[i % sectors.length];
  return {
    company: name,
    sector: sector.name,
    color: sector.color,
    gx: i % 4,
    gy: Math.floor(i / 4),
    revenue_growth: lcg(),
    employee_growth: lcg(),
    profit_margin: lcg(),
    liquidity_ratio: scaleRange(lcg(), 0.8, 3.2), // current-ratio style multiple
    market_share: lcg(),
    rd_intensity: scaleRange(lcg(), 1, 22), // % of revenue, realistic ceiling
    debt_to_equity: scaleRange(lcg(), 0.1, 2.5), // multiple
    customer_retention: scaleRange(lcg(), 60, 98), // %
  };
});

// Min-max normalize each metric across all companies to [0, 1].
const metrics = [
  "revenue_growth",
  "employee_growth",
  "profit_margin",
  "liquidity_ratio",
  "market_share",
  "rd_intensity",
  "debt_to_equity",
  "customer_retention",
];
const ranges = {};
metrics.forEach((m) => {
  const values = companies.map((c) => c[m]);
  ranges[m] = { min: Math.min(...values), max: Math.max(...values) };
});
function normalize(m, v) {
  const { min, max } = ranges[m];
  return max > min ? (v - min) / (max - min) : 0.5;
}

// Composite overall-profile score (simple average of growth/margin/share/
// retention, offset by leverage) drives the single "strongest profile"
// highlight drawn on the grid.
companies.forEach((c) => {
  c.compositeScore =
    (normalize("revenue_growth", c.revenue_growth) +
      normalize("profit_margin", c.profit_margin) +
      normalize("market_share", c.market_share) +
      normalize("customer_retention", c.customer_retention) +
      (1 - normalize("debt_to_equity", c.debt_to_equity))) /
    5;
});
const topPerformer = companies.reduce((best, c) =>
  c.compositeScore > best.compositeScore ? c : best,
);

// --- Mount -------------------------------------------------------------------
const canvas = document.createElement("canvas");
document.getElementById("container").appendChild(canvas);

// --- Chernoff-face drawing plugin --------------------------------------------
// Chart.js positions each observation on an invisible scatter grid; this
// plugin draws the actual face at each point's pixel location once the
// dataset elements have been laid out.
const chernoffFacesPlugin = {
  id: "chernoffFaces",
  afterDatasetsDraw(chart) {
    const { ctx, scales } = chart;
    const cellW = Math.abs(
      scales.x.getPixelForValue(1) - scales.x.getPixelForValue(0),
    );
    const cellH = Math.abs(
      scales.y.getPixelForValue(1) - scales.y.getPixelForValue(0),
    );

    chart.data.datasets.forEach((dataset, di) => {
      if (!chart.isDatasetVisible(di)) return;
      const meta = chart.getDatasetMeta(di);
      dataset.data.forEach((raw, i) => {
        const el = meta.data[i];
        if (!el) return;
        drawFace(
          ctx,
          el.x,
          el.y,
          cellW,
          cellH,
          raw,
          raw.company === topPerformer.company,
        );
      });
    });
  },
};

function drawFace(ctx, cx, cy, cellW, cellH, r, isTopPerformer) {
  const headRx =
    cellW * 0.24 * (0.75 + 0.5 * normalize("revenue_growth", r.revenue_growth));
  const headRy =
    cellH *
    0.28 *
    (0.75 + 0.5 * normalize("employee_growth", r.employee_growth));
  const eyeR =
    headRx * (0.08 + 0.14 * normalize("profit_margin", r.profit_margin));
  const mouthCurve =
    headRy * 0.55 * (2 * normalize("liquidity_ratio", r.liquidity_ratio) - 1);
  const browSlant = 10 * (2 * normalize("market_share", r.market_share) - 1);
  const noseLen =
    headRy * (0.15 + 0.35 * normalize("rd_intensity", r.rd_intensity));
  const eyeSpacing =
    headRx * (0.34 + 0.16 * normalize("debt_to_equity", r.debt_to_equity));
  const mouthWidth =
    headRx *
    (0.42 + 0.28 * normalize("customer_retention", r.customer_retention));

  ctx.save();

  // Highlight ring: marks the company with the strongest overall profile
  // (composite of growth, margin, market share, retention, and leverage).
  if (isTopPerformer) {
    ctx.beginPath();
    ctx.ellipse(cx, cy, headRx * 1.28, headRy * 1.28, 0, 0, Math.PI * 2);
    ctx.setLineDash([6, 4]);
    ctx.lineWidth = 2;
    ctx.strokeStyle = t.ink;
    ctx.stroke();
    ctx.setLineDash([]);
  }

  // Head
  ctx.beginPath();
  ctx.ellipse(cx, cy, headRx, headRy, 0, 0, Math.PI * 2);
  ctx.fillStyle = t.pageBg;
  ctx.fill();
  ctx.lineWidth = 3;
  ctx.strokeStyle = r.color;
  ctx.stroke();

  // Eyebrows (slant encodes market share)
  const eyeOffsetX = eyeSpacing;
  const eyeY = cy - headRy * 0.15;
  ctx.strokeStyle = t.ink;
  ctx.lineWidth = 2.5;
  ctx.lineCap = "round";
  [-1, 1].forEach((sign) => {
    const bx = cx + sign * eyeOffsetX;
    const by = eyeY - eyeR - headRy * 0.16;
    ctx.beginPath();
    ctx.moveTo(bx - headRx * 0.14, by + sign * browSlant * 0.35);
    ctx.lineTo(bx + headRx * 0.14, by - sign * browSlant * 0.35);
    ctx.stroke();
  });

  // Eyes (size encodes profit margin)
  ctx.fillStyle = t.ink;
  [-1, 1].forEach((sign) => {
    ctx.beginPath();
    ctx.arc(cx + sign * eyeOffsetX, eyeY, eyeR, 0, Math.PI * 2);
    ctx.fill();
  });

  // Nose (length encodes R&D intensity)
  ctx.beginPath();
  ctx.moveTo(cx, cy - headRy * 0.02);
  ctx.lineTo(cx, cy + noseLen);
  ctx.strokeStyle = t.inkSoft;
  ctx.lineWidth = 2;
  ctx.stroke();

  // Mouth (curvature encodes liquidity ratio, width encodes customer retention)
  const mouthY = cy + headRy * 0.55;
  const mouthW = mouthWidth;
  ctx.beginPath();
  ctx.moveTo(cx - mouthW, mouthY);
  ctx.quadraticCurveTo(cx, mouthY + mouthCurve, cx + mouthW, mouthY);
  ctx.strokeStyle = t.ink;
  ctx.lineWidth = 2.5;
  ctx.stroke();

  ctx.restore();

  // Label — the top-performer's name gets a bold "★" prefix to flag it as
  // the standout face on the grid. Its baseline drops below the highlight
  // ring (not just the head) so the dashed stroke never crosses the text.
  ctx.save();
  ctx.textAlign = "center";
  if (isTopPerformer) {
    ctx.fillStyle = t.ink;
    ctx.font = "bold 13px sans-serif";
    ctx.fillText(`★ ${r.company}`, cx, cy + headRy * 1.28 + 20);
  } else {
    ctx.fillStyle = t.inkSoft;
    ctx.font = "13px sans-serif";
    ctx.fillText(r.company, cx, cy + headRy + 20);
  }
  ctx.restore();
}

// --- Chart ---------------------------------------------------------------
new Chart(canvas, {
  type: "scatter",
  data: {
    datasets: sectors.map((sector) => ({
      label: sector.name,
      data: companies
        .filter((c) => c.sector === sector.name)
        .map((c) => ({ x: c.gx, y: c.gy, ...c })),
      backgroundColor: sector.color,
      borderColor: sector.color,
      pointStyle: "circle",
      pointRadius: 0,
      pointHitRadius: 55,
      pointHoverRadius: 0,
    })),
  },
  options: {
    responsive: true,
    maintainAspectRatio: false,
    animation: false,
    layout: { padding: { top: 10, bottom: 10, left: 40, right: 40 } },
    plugins: {
      title: {
        display: true,
        text: "chernoff-basic · javascript · chartjs · anyplot.ai",
        color: t.ink,
        font: { size: 22 },
        padding: { bottom: 20 },
      },
      legend: {
        position: "bottom",
        labels: { color: t.ink, font: { size: 16 }, usePointStyle: true },
      },
      tooltip: {
        callbacks: {
          title: (items) => items[0].raw.company,
          label: (item) => {
            const r = item.raw;
            return [
              `Sector: ${r.sector}`,
              `Revenue growth: ${(r.revenue_growth * 100).toFixed(0)}%`,
              `Employee growth: ${(r.employee_growth * 100).toFixed(0)}%`,
              `Profit margin: ${(r.profit_margin * 100).toFixed(0)}%`,
              `Liquidity ratio: ${r.liquidity_ratio.toFixed(2)}x`,
              `Market share: ${(r.market_share * 100).toFixed(0)}%`,
              `R&D intensity: ${r.rd_intensity.toFixed(1)}% of revenue`,
              `Debt-to-equity: ${r.debt_to_equity.toFixed(2)}x`,
              `Customer retention: ${r.customer_retention.toFixed(0)}%`,
            ];
          },
        },
      },
    },
    scales: {
      x: { display: false, min: -0.6, max: 3.6 },
      y: { display: false, min: -0.6, max: 2.6, reverse: true },
    },
  },
  plugins: [chernoffFacesPlugin],
});
Runnable source as JSON, for any HTTP client: https://api.anyplot.ai/specs/chernoff-basic/chartjs/code. Any spec id and library id listed in llms-full.txt fit the same URL shape; every URL below is complete and callable.
{
  "spec_id": "chernoff-basic",
  "language": "javascript",
  "library": "chartjs",
  "page": "https://anyplot.ai/chernoff-basic/javascript/chartjs",
  "hub": "https://anyplot.ai/chernoff-basic",
  "code_json": "https://api.anyplot.ai/specs/chernoff-basic/chartjs/code",
  "spec_json": "https://api.anyplot.ai/specs/chernoff-basic",
  "render_light_png": "https://storage.googleapis.com/anyplot-images/plots/chernoff-basic/javascript/chartjs/plot-light.png",
  "render_dark_png": "https://storage.googleapis.com/anyplot-images/plots/chernoff-basic/javascript/chartjs/plot-dark.png",
  "interactive_light_html": "https://storage.googleapis.com/anyplot-images/plots/chernoff-basic/javascript/chartjs/plot-light.html",
  "interactive_dark_html": "https://storage.googleapis.com/anyplot-images/plots/chernoff-basic/javascript/chartjs/plot-dark.html",
  "quality_score": 93.0,
  "license": "MIT",
  "guide": "https://anyplot.ai/llms.txt"
}
Part of Chernoff Faces for Multivariate Data on anyplot.ai.