The same plot in 14 other libraries — JavaScript: Chart.js, Apache ECharts, Highcharts, MUI X Charts; Python: Altair, Bokeh, lets-plot, Matplotlib, Plotly, plotnine, Pygal, Seaborn; R: ggplot2; Julia: Makie.jl. Compare all 15 side by side: Chernoff Faces for Multivariate Data in Python, R, Julia and JavaScript.
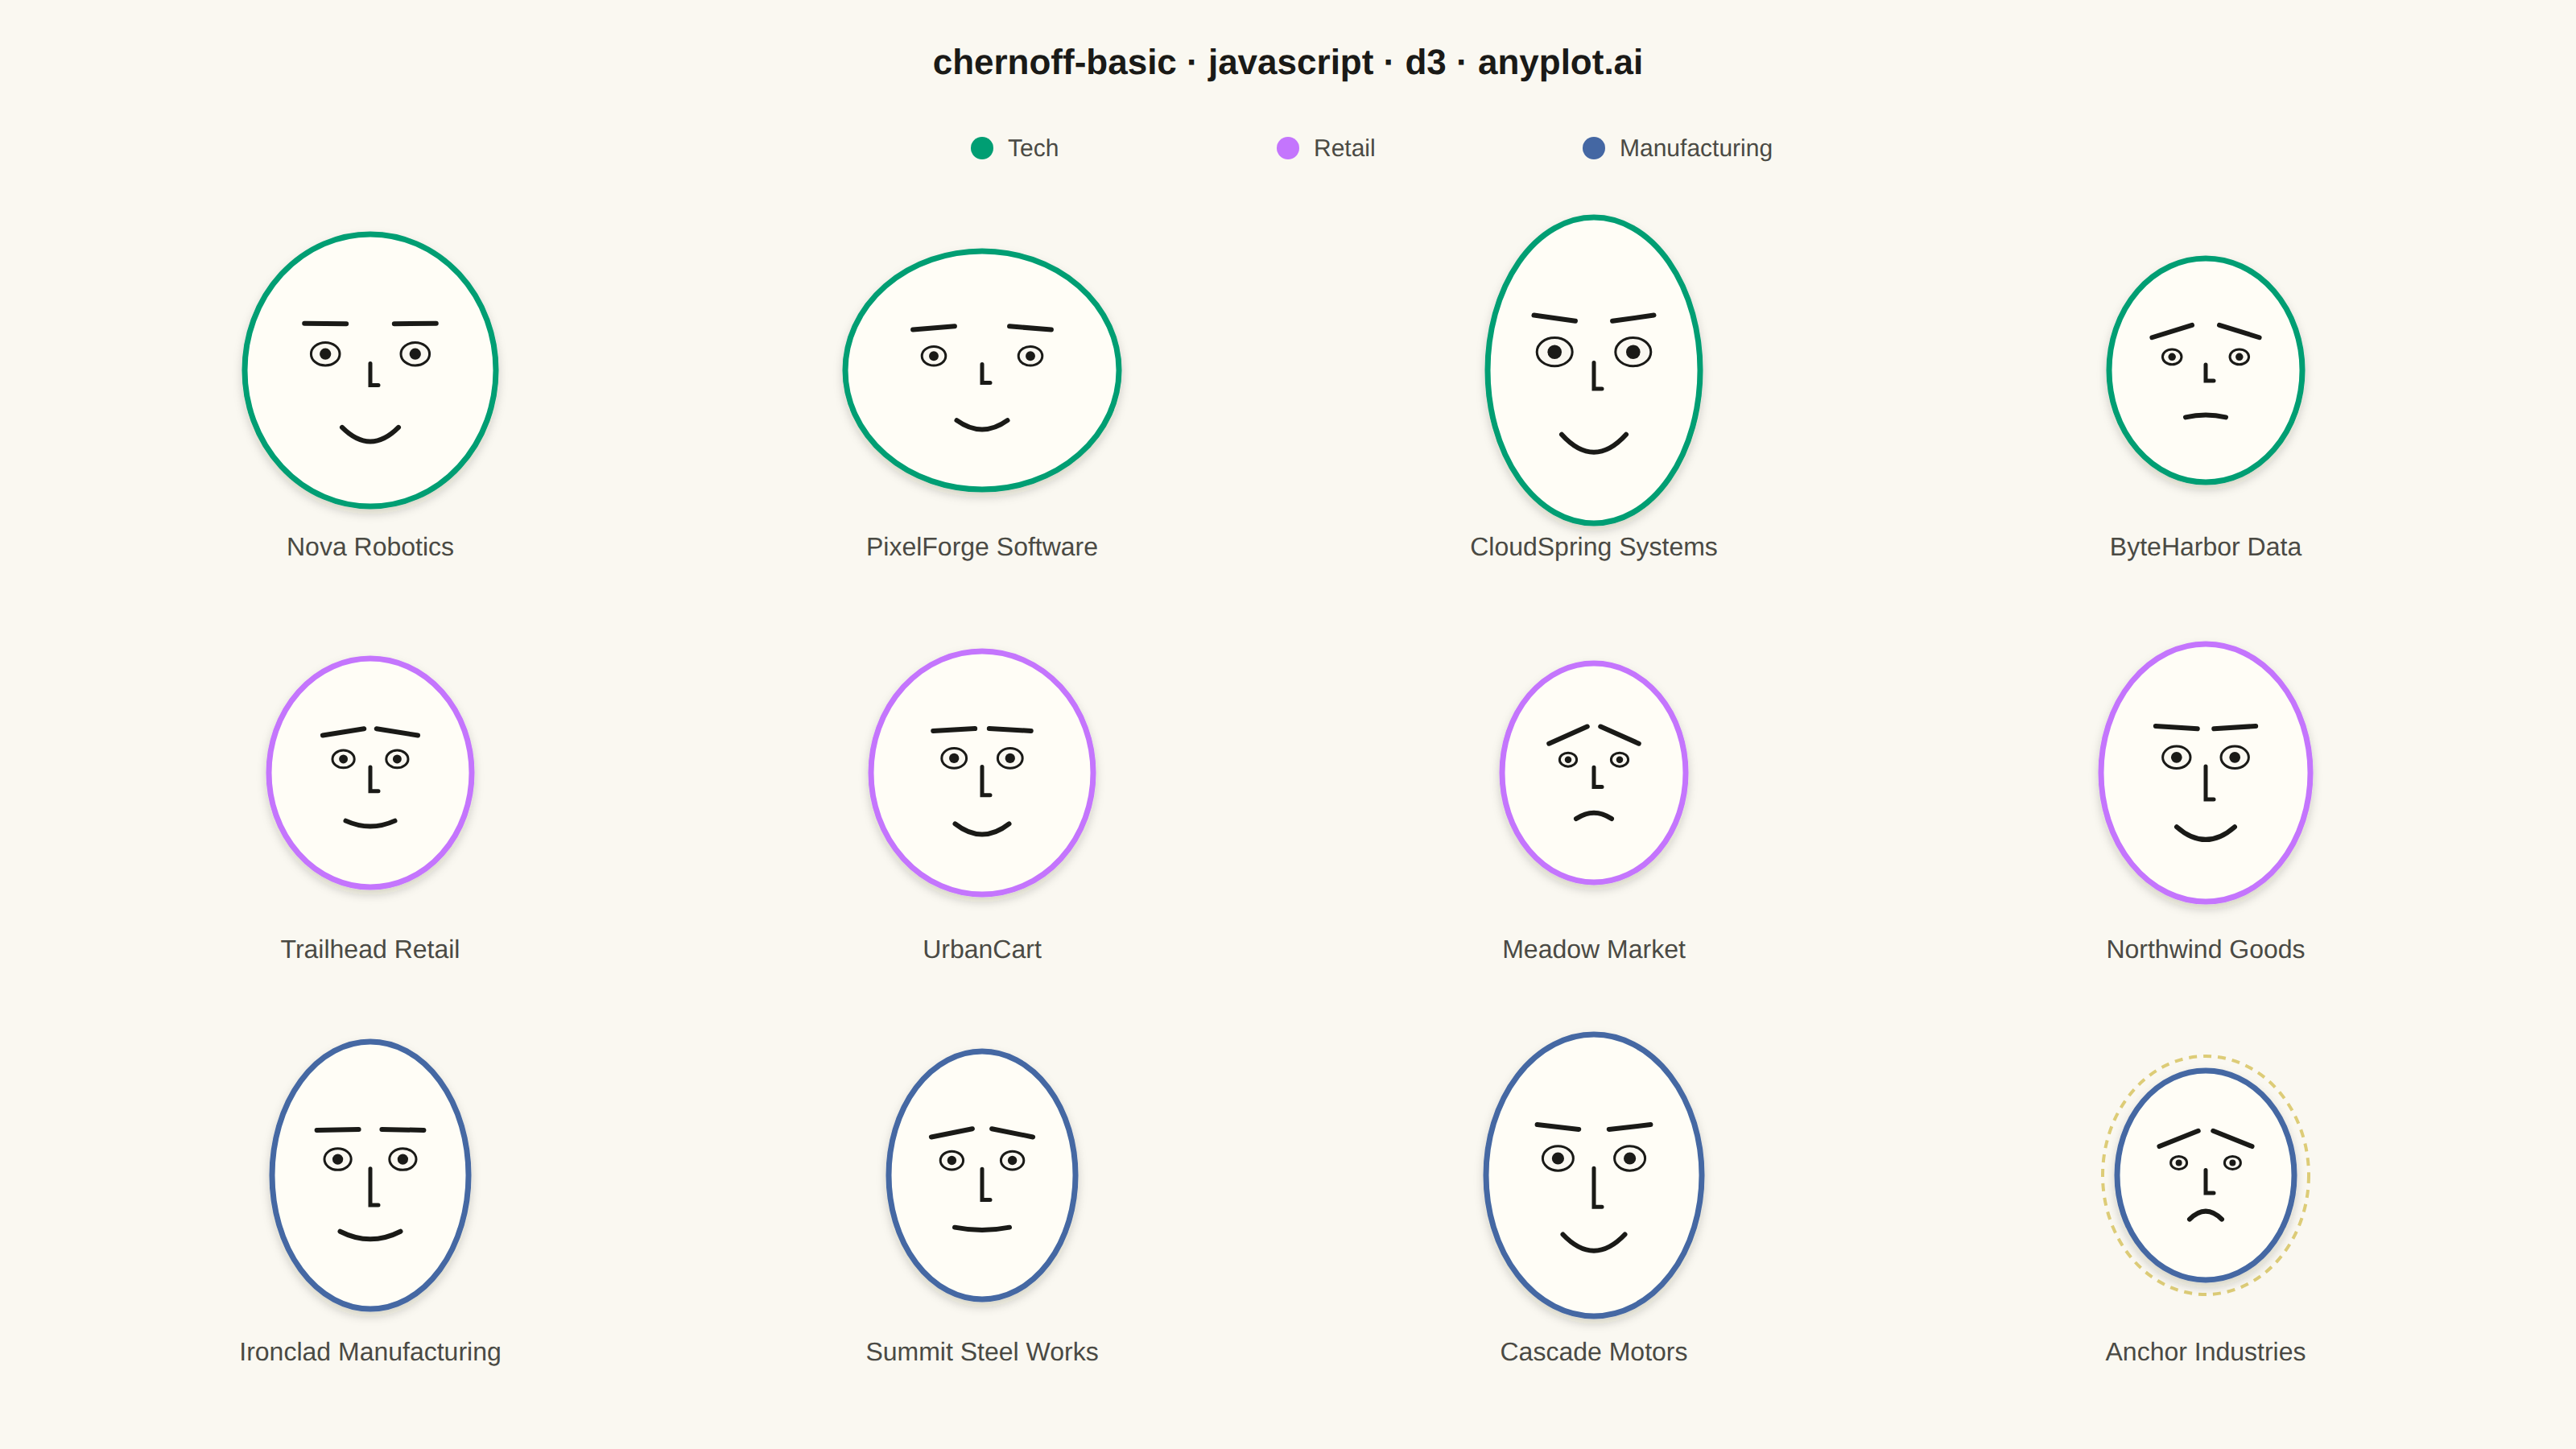
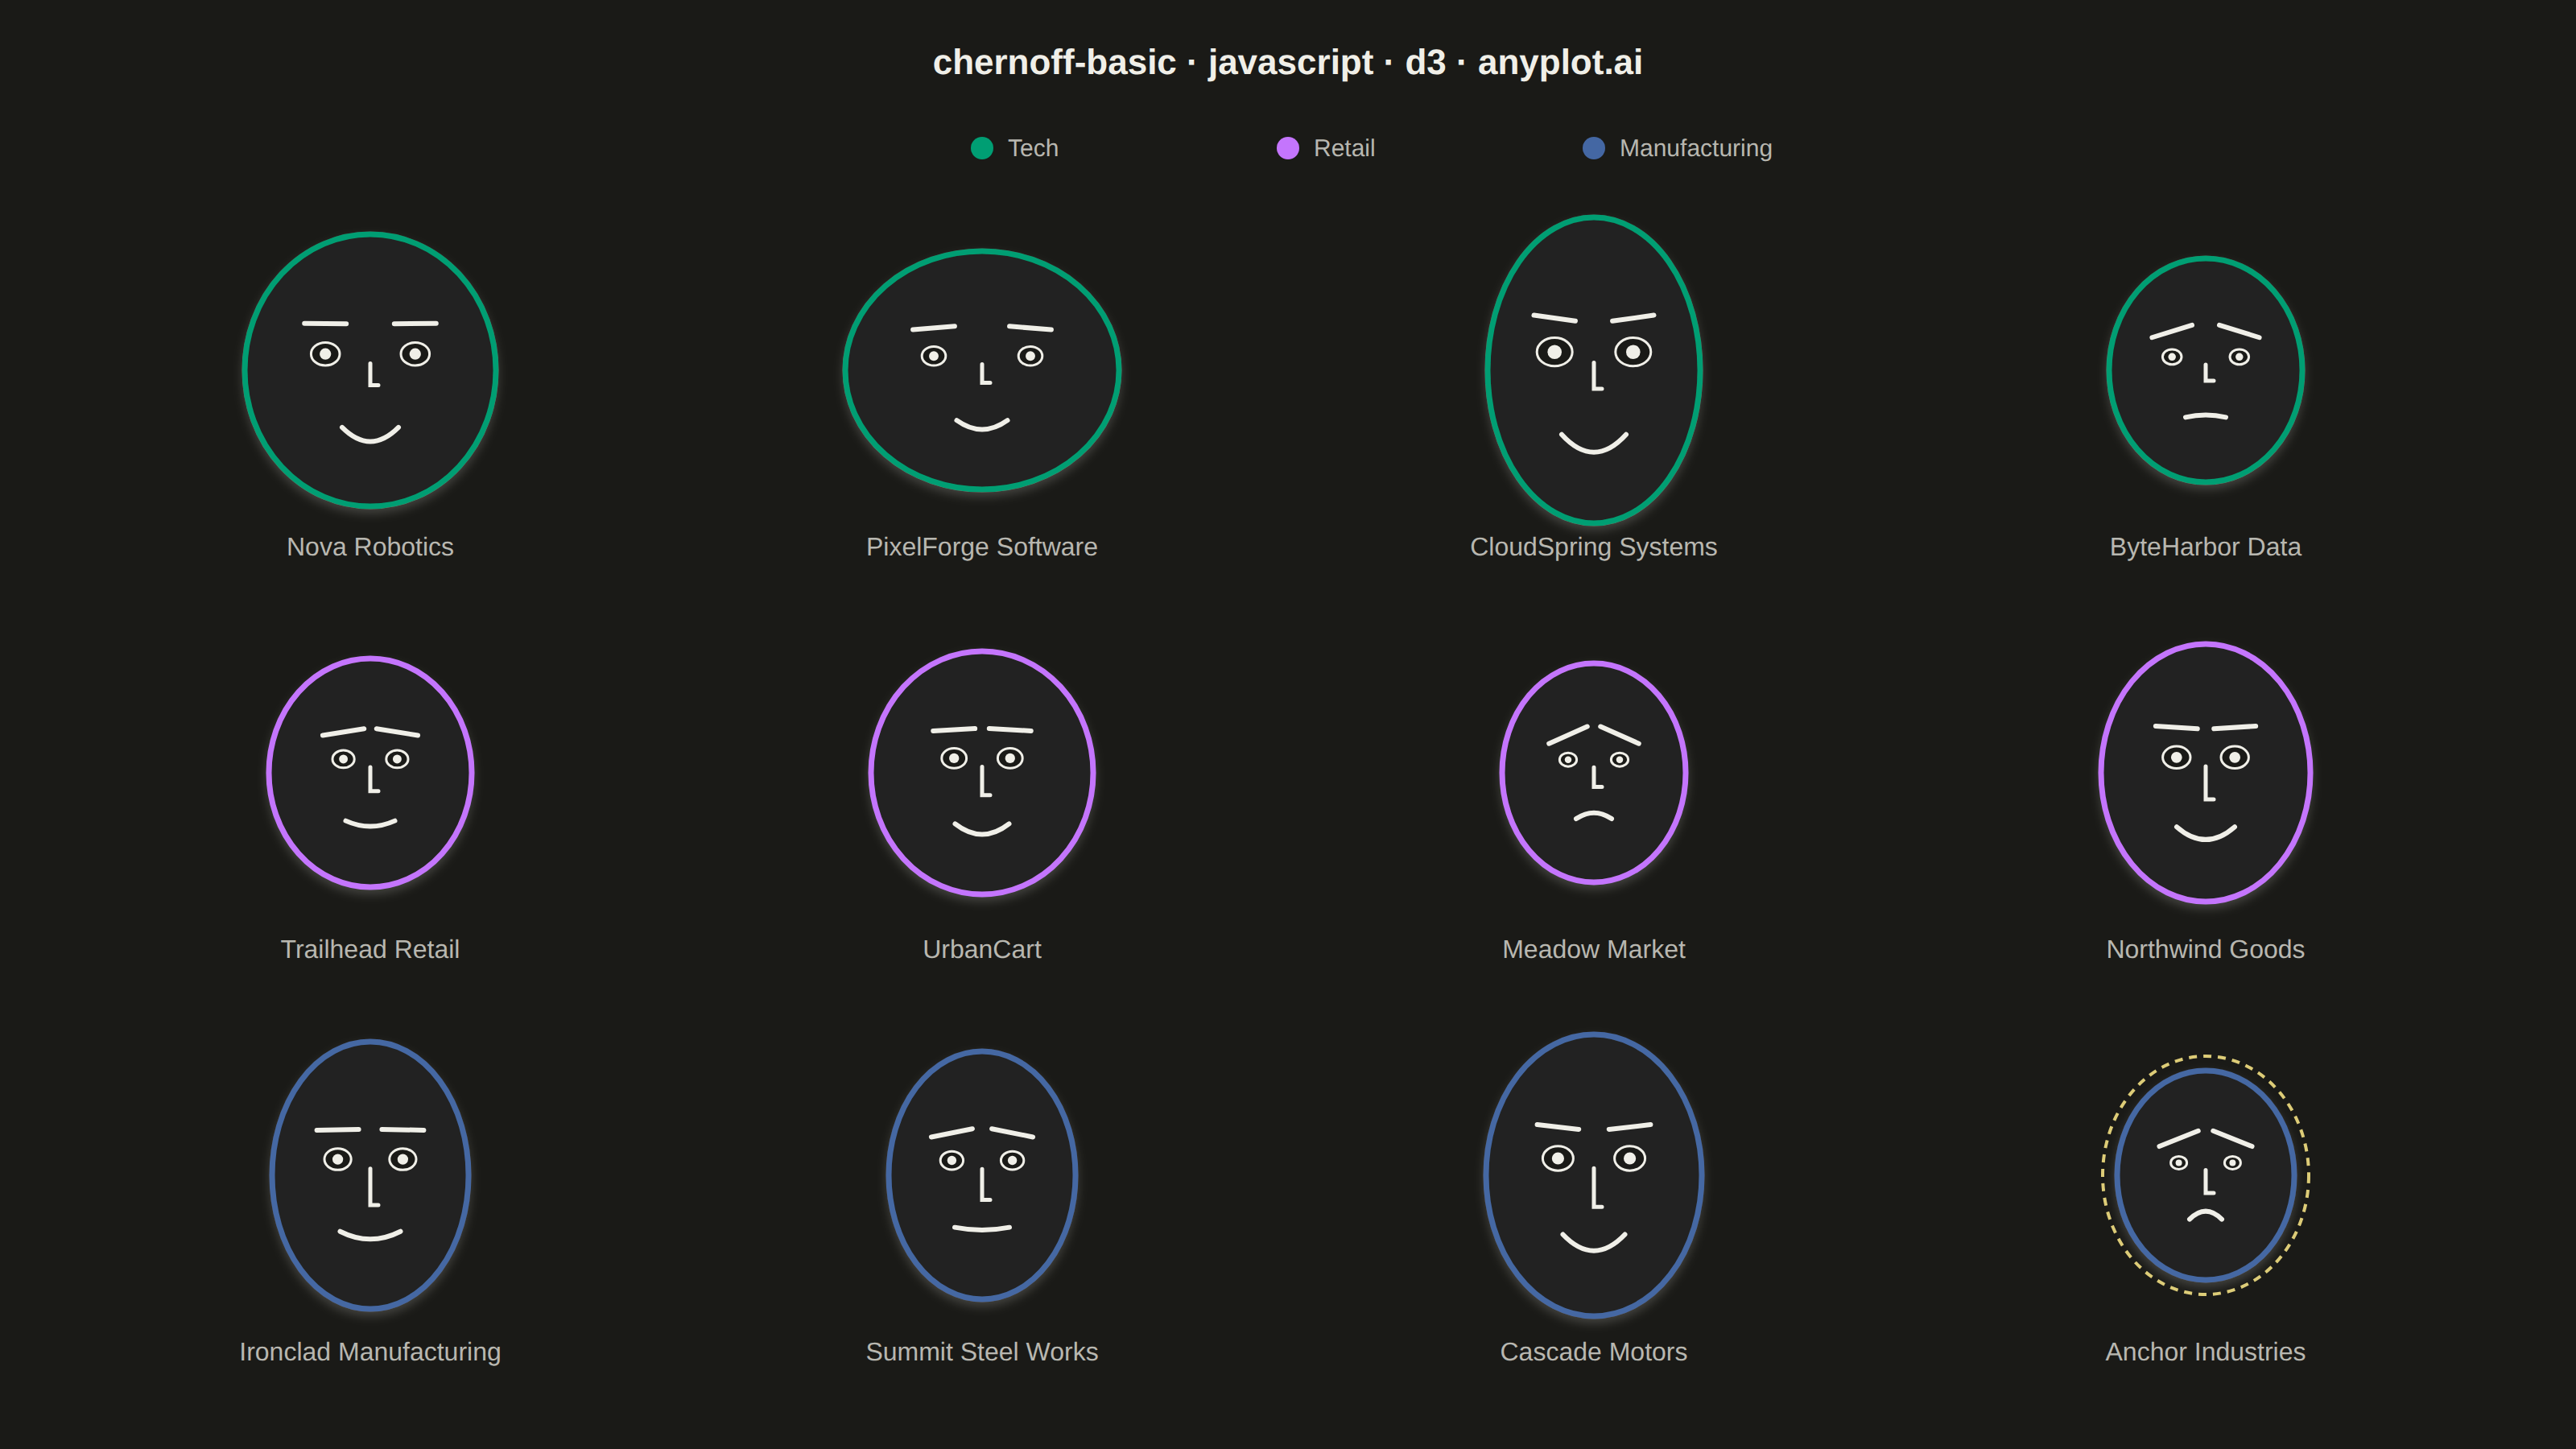
Chernoff faces visualize multivariate data by mapping each variable to a facial feature (eye size, mouth curvature, face width, nose length, etc.), transforming each observation into a unique cartoon face. This technique leverages humans' innate ability to recognize and distinguish faces, making it easier to identify patterns, clusters, and outliers across multiple dimensions simultaneously.
// anyplot.ai
// chernoff-basic: Chernoff Faces for Multivariate Data
// Library: d3 7.9.0 | JavaScript 22.23.2
// Quality: 92/100 | Created: 2026-09-02

const t = window.ANYPLOT_TOKENS;
const { width, height } = window.ANYPLOT_SIZE;

// --- Data: 12 companies x 8 financial/operational metrics, 3 industries ----
// Each metric is later normalized to [0, 1] (via d3.extent) before being
// mapped onto a facial feature's pixel range, per the spec's 0-1 rule.
const companies = [
  { name: "Nova Robotics", industry: "Tech", revenueGrowth: 24, profitMargin: 15, liquidityRatio: 2.1, rdInvestment: 19, debtRatio: 0.28, marketShare: 9, customerSat: 86, opEfficiency: 78 },
  { name: "PixelForge Software", industry: "Tech", revenueGrowth: 31, profitMargin: 8, liquidityRatio: 1.6, rdInvestment: 22, debtRatio: 0.35, marketShare: 6, customerSat: 79, opEfficiency: 71 },
  { name: "CloudSpring Systems", industry: "Tech", revenueGrowth: 12, profitMargin: 22, liquidityRatio: 2.8, rdInvestment: 14, debtRatio: 0.18, marketShare: 13, customerSat: 91, opEfficiency: 88 },
  { name: "ByteHarbor Data", industry: "Tech", revenueGrowth: 6, profitMargin: 5, liquidityRatio: 1.1, rdInvestment: 9, debtRatio: 0.52, marketShare: 4, customerSat: 63, opEfficiency: 58 },
  { name: "Trailhead Retail", industry: "Retail", revenueGrowth: 9, profitMargin: 6, liquidityRatio: 1.4, rdInvestment: 3, debtRatio: 0.41, marketShare: 11, customerSat: 74, opEfficiency: 69 },
  { name: "UrbanCart", industry: "Retail", revenueGrowth: 15, profitMargin: 9, liquidityRatio: 1.7, rdInvestment: 4, debtRatio: 0.33, marketShare: 15, customerSat: 81, opEfficiency: 75 },
  { name: "Meadow Market", industry: "Retail", revenueGrowth: 3, profitMargin: 4, liquidityRatio: 0.9, rdInvestment: 2, debtRatio: 0.61, marketShare: 7, customerSat: 58, opEfficiency: 52 },
  { name: "Northwind Goods", industry: "Retail", revenueGrowth: 11, profitMargin: 12, liquidityRatio: 2.0, rdInvestment: 5, debtRatio: 0.24, marketShare: 19, customerSat: 84, opEfficiency: 80 },
  { name: "Ironclad Manufacturing", industry: "Manufacturing", revenueGrowth: 7, profitMargin: 14, liquidityRatio: 1.9, rdInvestment: 8, debtRatio: 0.3, marketShare: 22, customerSat: 77, opEfficiency: 83 },
  { name: "Summit Steel Works", industry: "Manufacturing", revenueGrowth: 4, profitMargin: 10, liquidityRatio: 1.5, rdInvestment: 6, debtRatio: 0.44, marketShare: 17, customerSat: 70, opEfficiency: 76 },
  { name: "Cascade Motors", industry: "Manufacturing", revenueGrowth: 13, profitMargin: 17, liquidityRatio: 2.3, rdInvestment: 11, debtRatio: 0.2, marketShare: 24, customerSat: 89, opEfficiency: 85 },
  { name: "Anchor Industries", industry: "Manufacturing", revenueGrowth: 1, profitMargin: 2, liquidityRatio: 0.8, rdInvestment: 3, debtRatio: 0.58, marketShare: 10, customerSat: 55, opEfficiency: 48 },
];

const industries = ["Tech", "Retail", "Manufacturing"];
const industryColor = d3.scaleOrdinal().domain(industries).range(t.palette.slice(0, 3));

// --- Explicit 0-1 normalization, then mapped onto a facial-feature pixel range --
const normalize = (accessor) => {
  const [lo, hi] = d3.extent(companies, accessor);
  return (d) => (accessor(d) - lo) / (hi - lo);
};
const toRange = (norm, range) => (d) => range[0] + norm(d) * (range[1] - range[0]);

const faceWidthScale = toRange(normalize((d) => d.revenueGrowth), [55, 85]);
const faceHeightScale = toRange(normalize((d) => d.profitMargin), [65, 95]);
const eyeSizeScale = toRange(normalize((d) => d.liquidityRatio), [5, 11]);
const eyeSpacingScale = toRange(normalize((d) => d.rdInvestment), [16, 30]);
const browSlantScale = toRange(normalize((d) => d.debtRatio), [-8, 24]);
const noseLengthScale = toRange(normalize((d) => d.marketShare), [10, 24]);
const mouthCurveScale = toRange(normalize((d) => d.customerSat), [-10, 22]);
const mouthWidthScale = toRange(normalize((d) => d.opEfficiency), [20, 40]);

// composite risk score (high debt, weak everything else) — flags the one
// outlier face to receive a dashed amber emphasis ring below
const riskScore = (d) =>
  normalize((c) => c.debtRatio)(d) -
  (normalize((c) => c.revenueGrowth)(d) +
    normalize((c) => c.profitMargin)(d) +
    normalize((c) => c.liquidityRatio)(d) +
    normalize((c) => c.customerSat)(d) +
    normalize((c) => c.opEfficiency)(d)) /
    5;
const weakestCompany = companies.reduce((worst, d) => (riskScore(d) > riskScore(worst) ? d : worst));

// --- Grid layout --------------------------------------------------------------
const margin = { top: 130, right: 40, bottom: 20, left: 40 };
const cols = 4;
const rows = 3;
const cellW = (width - margin.left - margin.right) / cols;
const cellH = (height - margin.top - margin.bottom) / rows;

// --- SVG mount ----------------------------------------------------------------
const svg = d3.select("#container").append("svg").attr("width", width).attr("height", height);

// --- Subtle drop-shadow for face outlines (visual refinement) ---------------
svg
  .append("defs")
  .append("filter")
  .attr("id", "face-shadow")
  .attr("x", "-50%")
  .attr("y", "-50%")
  .attr("width", "200%")
  .attr("height", "200%")
  .append("feDropShadow")
  .attr("dx", 0)
  .attr("dy", 3)
  .attr("stdDeviation", 3)
  .attr("flood-color", t.ink)
  .attr("flood-opacity", 0.18);

// --- Title ----------------------------------------------------------------
svg
  .append("text")
  .attr("x", width / 2)
  .attr("y", 46)
  .attr("text-anchor", "middle")
  .attr("fill", t.ink)
  .style("font-size", "22px")
  .style("font-weight", "600")
  .text("chernoff-basic · javascript · d3 · anyplot.ai");

// --- Industry legend --------------------------------------------------------
const legendItemW = 190;
const legend = svg
  .append("g")
  .attr("transform", `translate(${width / 2 - ((industries.length - 1) * legendItemW) / 2}, 92)`);

const legendItems = legend
  .selectAll("g.legend-item")
  .data(industries)
  .join("g")
  .attr("class", "legend-item")
  .attr("transform", (d, i) => `translate(${i * legendItemW}, 0)`);

legendItems.append("circle").attr("r", 7).attr("fill", (d) => industryColor(d));
legendItems
  .append("text")
  .attr("x", 16)
  .attr("y", 5)
  .attr("fill", t.inkSoft)
  .style("font-size", "15px")
  .text((d) => d);

// --- Faces: one <g> per company, positioned by grid index -------------------
const faceG = svg
  .selectAll("g.face")
  .data(companies)
  .join("g")
  .attr("class", "face")
  .attr("transform", (d, i) => {
    const col = i % cols;
    const row = Math.floor(i / cols);
    const cx = margin.left + col * cellW + cellW / 2;
    const cy = margin.top + row * cellH + cellH * 0.4;
    return `translate(${cx},${cy})`;
  });

faceG.each(function (d) {
  const g = d3.select(this);
  const color = industryColor(d.industry);

  const faceW = faceWidthScale(d);
  const faceH = faceHeightScale(d);
  const eyeSize = eyeSizeScale(d);
  const eyeSpacing = eyeSpacingScale(d);
  const browSlant = browSlantScale(d);
  const noseLen = noseLengthScale(d);
  const mouthCurve = mouthCurveScale(d);
  const mouthWidth = mouthWidthScale(d);

  const eyeY = -faceH * 0.12;
  const noseTopY = -faceH * 0.05;
  const mouthY = faceH * 0.42;

  // dashed amber ring flags the single weakest-fundamentals company (high debt,
  // low growth/margin/liquidity/satisfaction/efficiency) — an emphasis outlier
  if (d === weakestCompany) {
    g.append("ellipse")
      .attr("cx", 0)
      .attr("cy", 0)
      .attr("rx", faceW + 9)
      .attr("ry", faceH + 9)
      .attr("fill", "none")
      .attr("stroke", t.amber)
      .attr("stroke-width", 2)
      .attr("stroke-dasharray", "5 4");
  }

  // face outline — industry color carries the group encoding
  g.append("ellipse")
    .attr("cx", 0)
    .attr("cy", 0)
    .attr("rx", faceW)
    .attr("ry", faceH)
    .attr("fill", t.elevatedBg)
    .attr("stroke", color)
    .attr("stroke-width", 3.5)
    .attr("filter", "url(#face-shadow)");

  // eyes: white + pupil, mirrored around center
  for (const side of [-1, 1]) {
    const ex = side * eyeSpacing;
    g.append("ellipse").attr("cx", ex).attr("cy", eyeY).attr("rx", eyeSize).attr("ry", eyeSize * 0.8).attr("fill", t.pageBg).attr("stroke", t.ink).attr("stroke-width", 1.5);
    g.append("circle").attr("cx", ex).attr("cy", eyeY).attr("r", eyeSize * 0.4).attr("fill", t.ink);

    // eyebrow, rotated by debt-driven slant (mirrored across the two sides)
    const browY = eyeY - eyeSize - 10;
    g.append("line")
      .attr("x1", ex - 13)
      .attr("x2", ex + 13)
      .attr("y1", browY)
      .attr("y2", browY)
      .attr("stroke", t.ink)
      .attr("stroke-width", 3)
      .attr("stroke-linecap", "round")
      .attr("transform", `rotate(${side * browSlant} ${ex} ${browY})`);
  }

  // nose
  g.append("path")
    .attr("d", `M0,${noseTopY} L0,${noseTopY + noseLen} L5,${noseTopY + noseLen}`)
    .attr("fill", "none")
    .attr("stroke", t.ink)
    .attr("stroke-width", 2.5)
    .attr("stroke-linecap", "round");

  // mouth: quadratic curve, control point below/above the corners for smile/frown
  g.append("path")
    .attr("d", `M${-mouthWidth / 2},${mouthY} Q0,${mouthY + mouthCurve} ${mouthWidth / 2},${mouthY}`)
    .attr("fill", "none")
    .attr("stroke", t.ink)
    .attr("stroke-width", 3)
    .attr("stroke-linecap", "round");

  // company label
  g.append("text")
    .attr("x", 0)
    .attr("y", cellH * 0.46)
    .attr("text-anchor", "middle")
    .attr("fill", t.inkSoft)
    .style("font-size", "16px")
    .text(d.name);
});
Runnable source as JSON, for any HTTP client: https://api.anyplot.ai/specs/chernoff-basic/d3/code. Any spec id and library id listed in llms-full.txt fit the same URL shape; every URL below is complete and callable.
{
  "spec_id": "chernoff-basic",
  "language": "javascript",
  "library": "d3",
  "page": "https://anyplot.ai/chernoff-basic/javascript/d3",
  "hub": "https://anyplot.ai/chernoff-basic",
  "code_json": "https://api.anyplot.ai/specs/chernoff-basic/d3/code",
  "spec_json": "https://api.anyplot.ai/specs/chernoff-basic",
  "render_light_png": "https://storage.googleapis.com/anyplot-images/plots/chernoff-basic/javascript/d3/plot-light.png",
  "render_dark_png": "https://storage.googleapis.com/anyplot-images/plots/chernoff-basic/javascript/d3/plot-dark.png",
  "interactive_light_html": "https://storage.googleapis.com/anyplot-images/plots/chernoff-basic/javascript/d3/plot-light.html",
  "interactive_dark_html": "https://storage.googleapis.com/anyplot-images/plots/chernoff-basic/javascript/d3/plot-dark.html",
  "quality_score": 92.0,
  "license": "MIT",
  "guide": "https://anyplot.ai/llms.txt"
}
Part of Chernoff Faces for Multivariate Data on anyplot.ai.