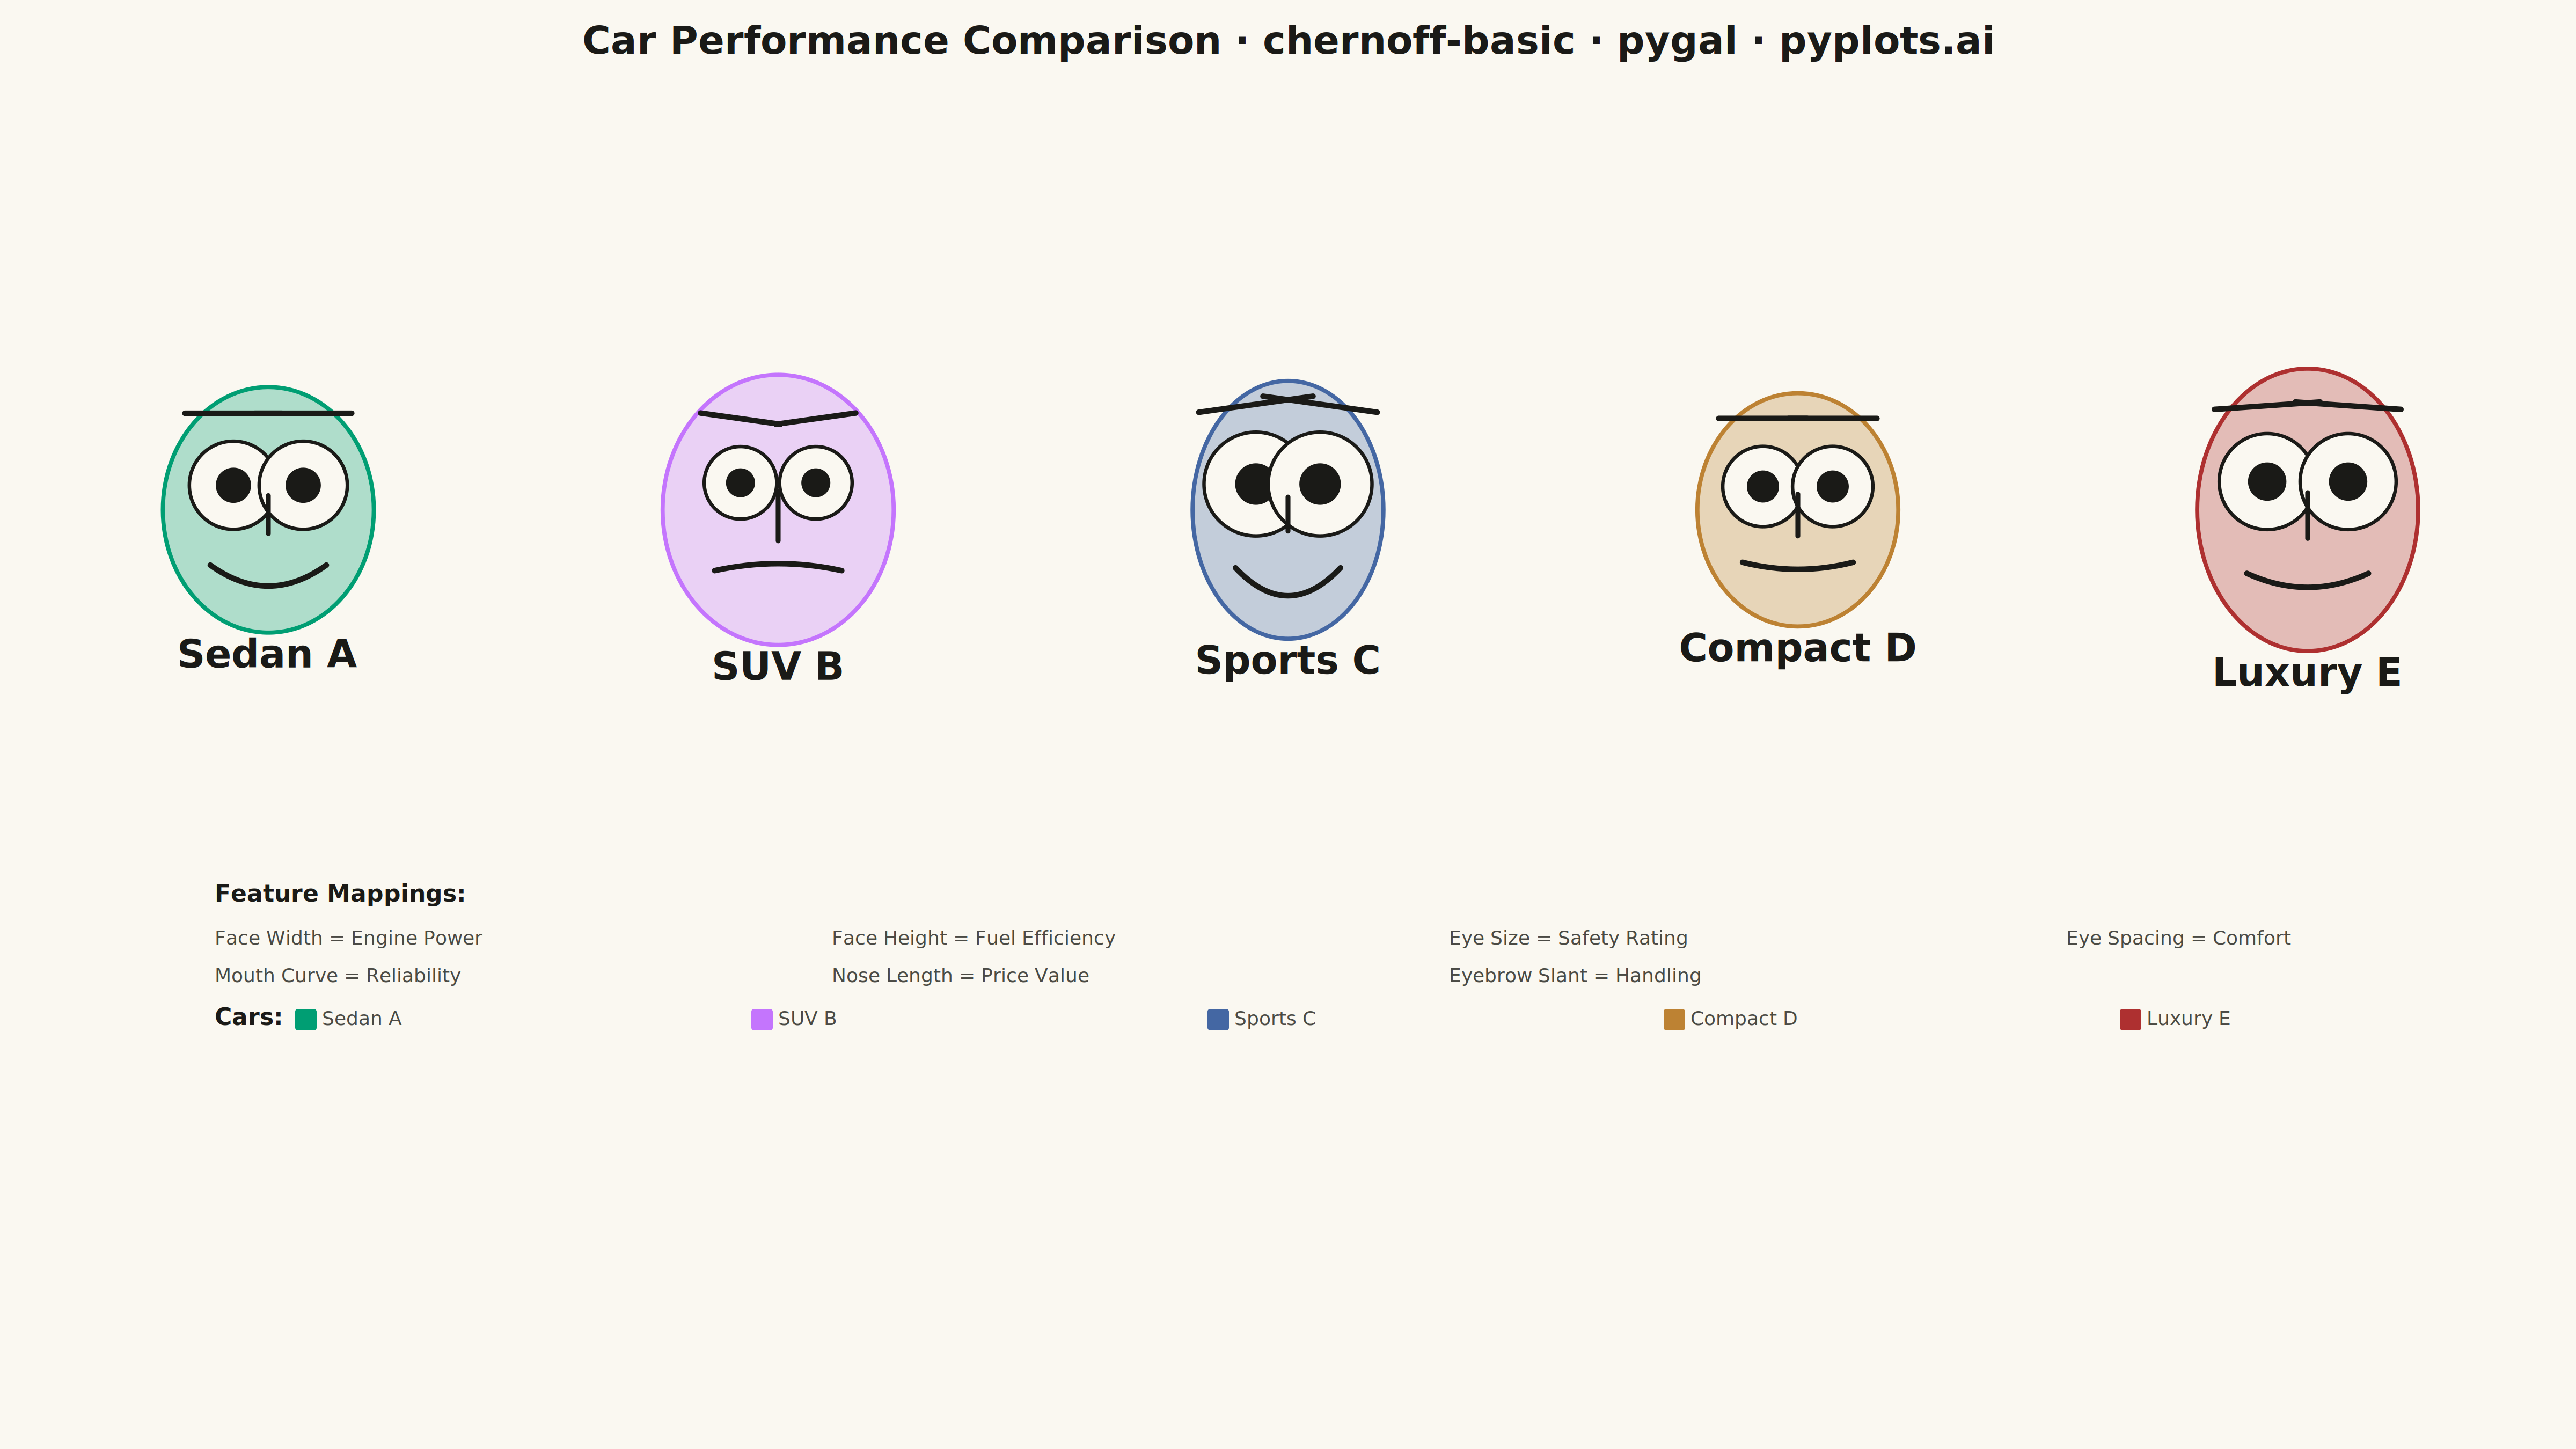
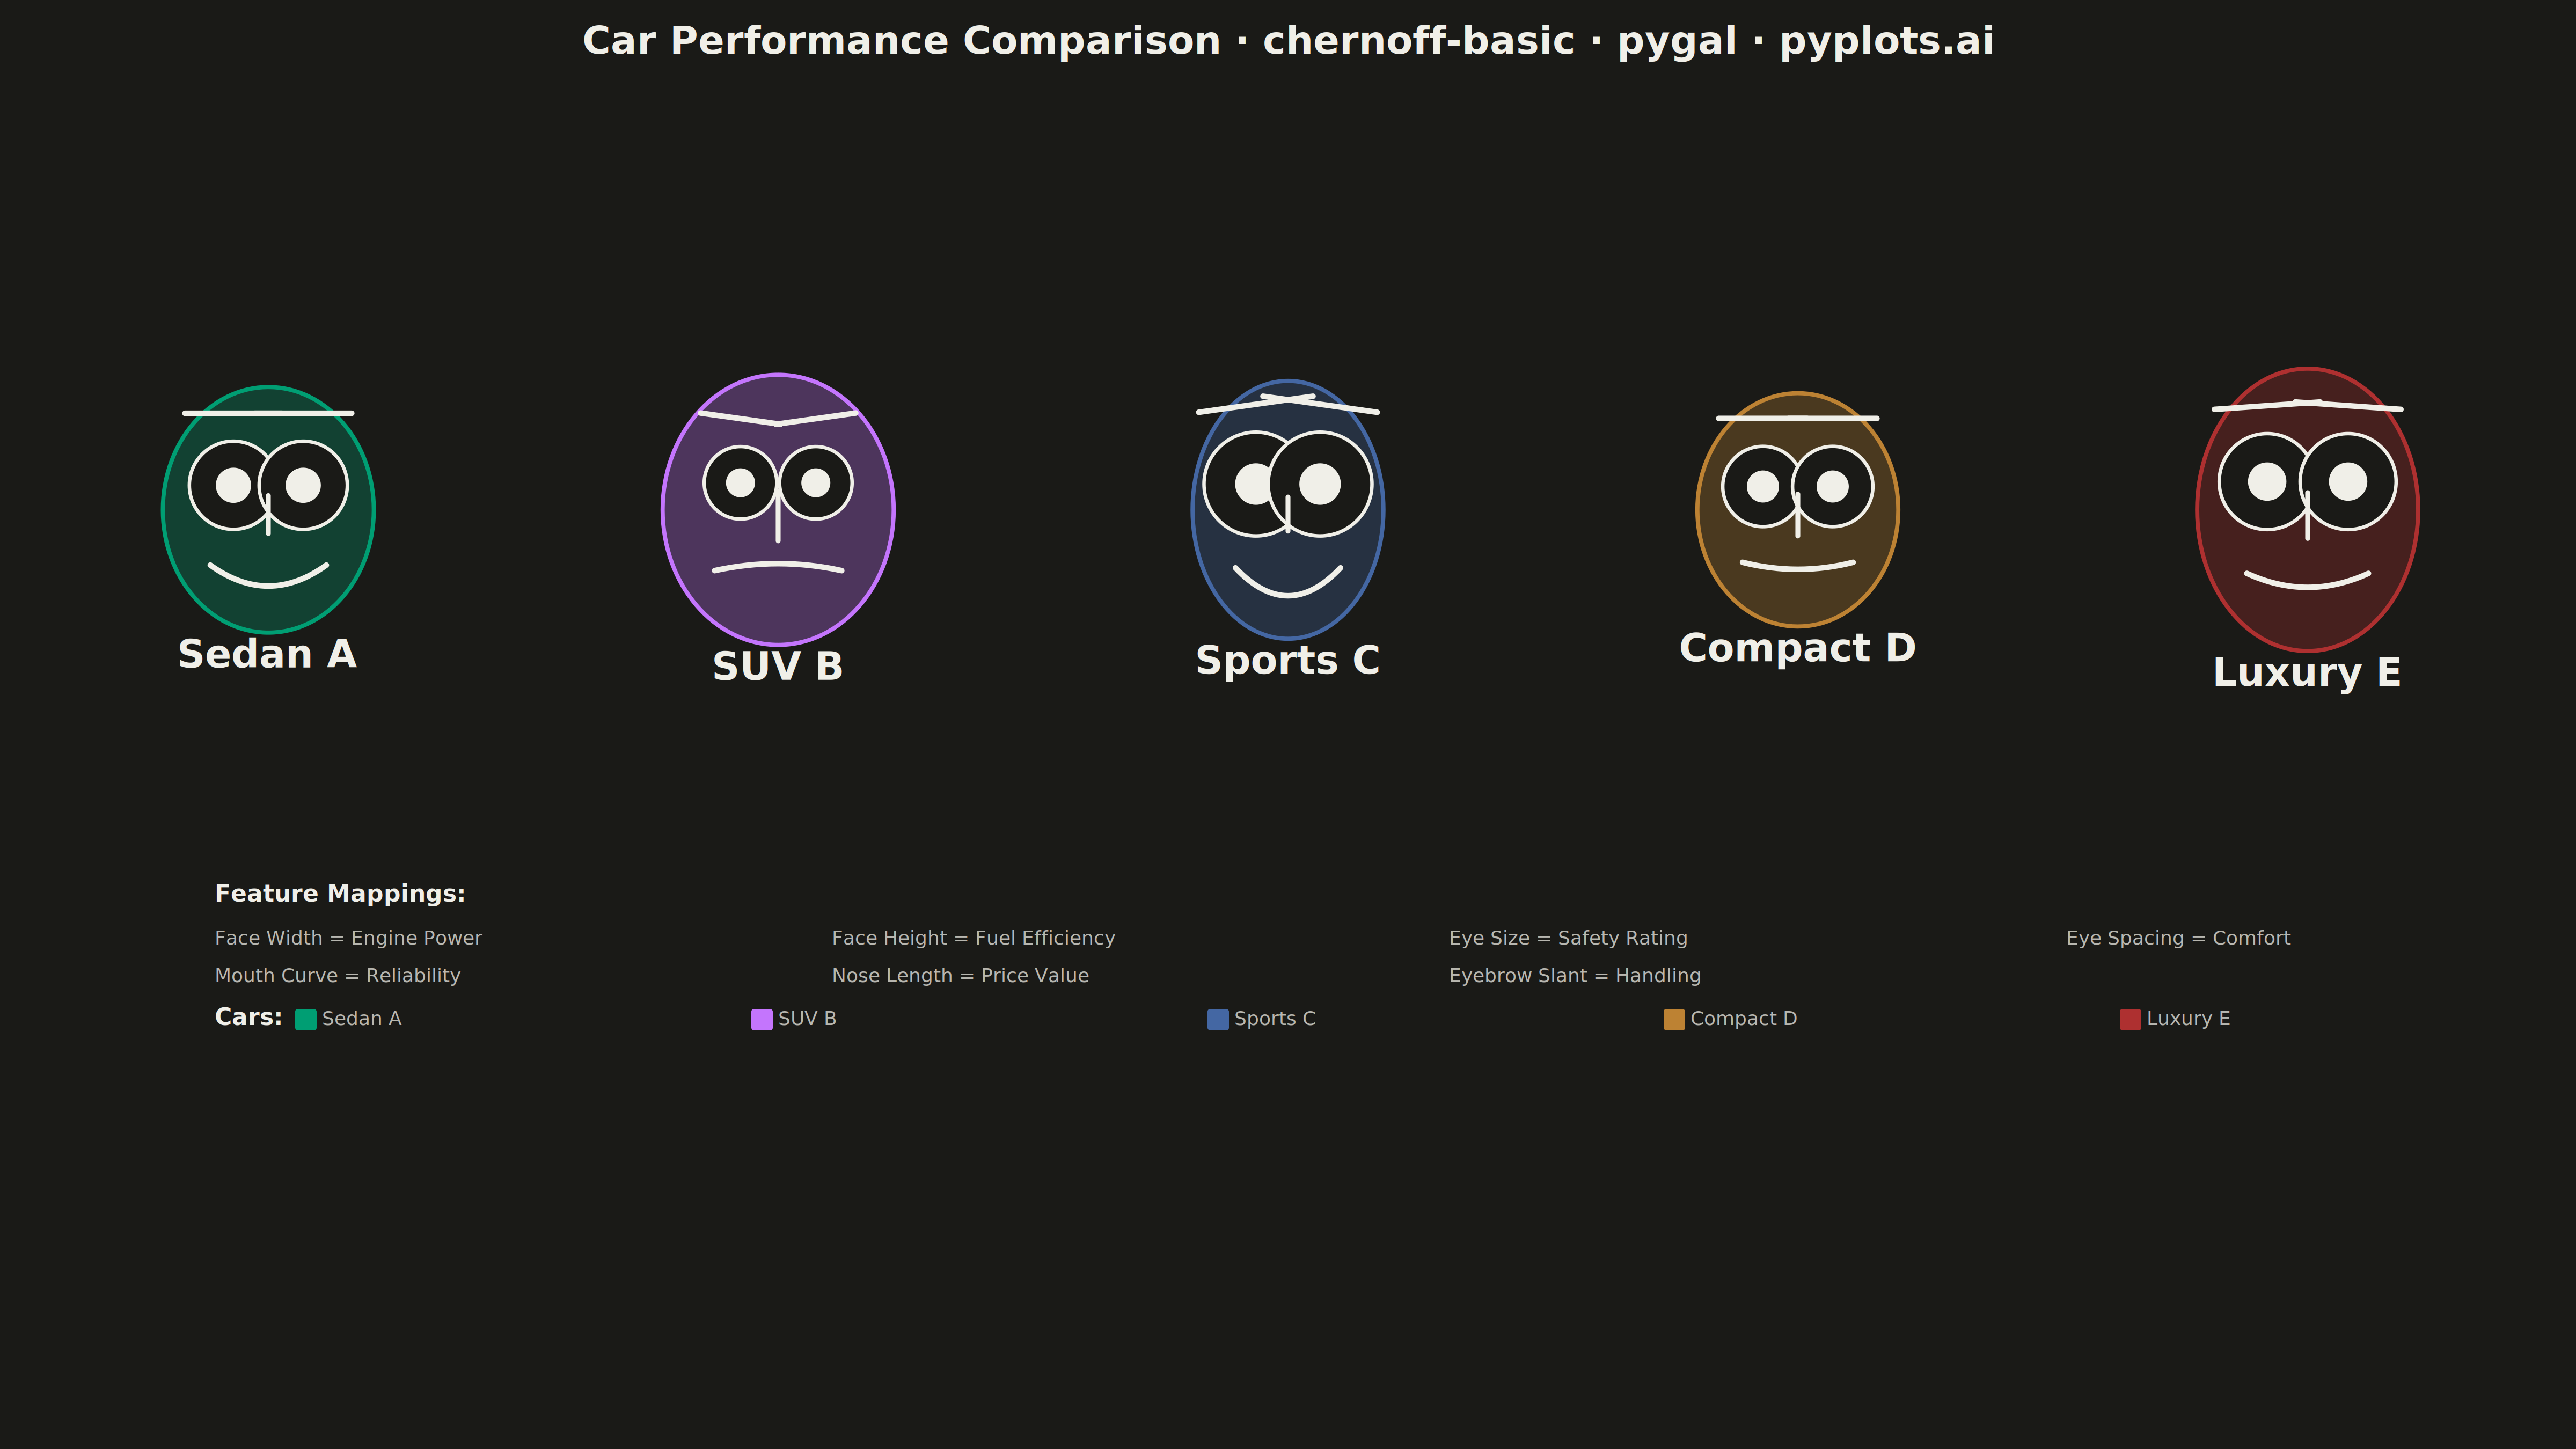
Chernoff faces visualize multivariate data by mapping each variable to a facial feature (eye size, mouth curvature, face width, nose length, etc.), transforming each observation into a unique cartoon face. This technique leverages humans' innate ability to recognize and distinguish faces, making it easier to identify patterns, clusters, and outliers across multiple dimensions simultaneously.
""" anyplot.ai
chernoff-basic: Chernoff Faces for Multivariate Data
Library: pygal 3.1.0 | Python 3.13.13
Quality: 86/100 | Updated: 2026-05-15
"""

import os
import sys
import xml.etree.ElementTree as ET


# Add site-packages to the beginning of sys.path to avoid local pygal.py conflict
site_packages = None
for path in sys.path:
    if "site-packages" in path:
        site_packages = path
        break

if site_packages:
    sys.path.insert(0, site_packages)

import cairosvg
import numpy as np
import pygal
from pygal.style import Style


# Theme-adaptive colors
THEME = os.getenv("ANYPLOT_THEME", "light")
PAGE_BG = "#FAF8F1" if THEME == "light" else "#1A1A17"
INK = "#1A1A17" if THEME == "light" else "#F0EFE8"
INK_SOFT = "#4A4A44" if THEME == "light" else "#B8B7B0"
INK_MUTED = "#6B6A63" if THEME == "light" else "#A8A79F"

# Okabe-Ito palette (first series is brand green #009E73)
IMPRINT = ("#009E73", "#C475FD", "#4467A3", "#BD8233", "#AE3030")

# Set seed for reproducibility
np.random.seed(42)

# Data - Car performance metrics (5 cars, 7 attributes each)
# Attributes: Engine Power, Fuel Efficiency, Safety Rating, Comfort, Reliability, Price Value, Handling
car_names = ["Sedan A", "SUV B", "Sports C", "Compact D", "Luxury E"]

# Normalized data (0-1 scale) for each car's attributes
# Each row: [face_width, face_height, eye_size, eye_spacing, mouth_curve, nose_length, eyebrow_slant]
car_data = np.array(
    [
        [0.6, 0.5, 0.7, 0.5, 0.8, 0.4, 0.5],  # Sedan A - balanced, happy
        [0.8, 0.7, 0.5, 0.6, 0.4, 0.7, 0.3],  # SUV B - large, serious
        [0.4, 0.6, 0.9, 0.4, 0.9, 0.3, 0.7],  # Sports C - narrow, excited
        [0.5, 0.4, 0.6, 0.5, 0.6, 0.5, 0.5],  # Compact D - small, neutral
        [0.7, 0.8, 0.8, 0.7, 0.7, 0.6, 0.6],  # Luxury E - large, pleasant
    ]
)

# Okabe-Ito palette for face colors
face_colors = IMPRINT

# SVG namespace
SVG_NS = "http://www.w3.org/2000/svg"
ET.register_namespace("", SVG_NS)

# Custom style for pygal
custom_style = Style(
    background=PAGE_BG,
    plot_background=PAGE_BG,
    foreground=INK,
    foreground_strong=INK,
    foreground_subtle=INK_SOFT,
    colors=IMPRINT,
    title_font_size=72,
    label_font_size=36,
    major_label_font_size=32,
    legend_font_size=36,
    value_font_size=28,
)

# Create a base pygal XY chart to leverage its SVG rendering infrastructure
chart = pygal.XY(
    width=4800,
    height=2700,
    style=custom_style,
    show_legend=False,
    show_x_guides=False,
    show_y_guides=False,
    show_x_labels=False,
    show_y_labels=False,
    show_dots=False,
    margin=50,
    no_data_text="",
)

# Add dummy data to create valid chart structure (hidden)
chart.add("", [])

# Render to SVG string
svg_string = chart.render().decode("utf-8")

# Parse SVG and add custom Chernoff faces
svg_tree = ET.fromstring(svg_string)

# Create faces group
faces_group = ET.SubElement(svg_tree, f"{{{SVG_NS}}}g")
faces_group.set("id", "chernoff-faces")

# Calculate face positions in a grid (5 faces in a row)
cols = 5
face_size = 520
margin_x = 500
spacing_x = (4800 - 2 * margin_x) / (cols - 1) if cols > 1 else 0
base_cy = 950  # Center faces vertically for better canvas utilization

# Draw each Chernoff face inline (KISS structure - no functions)
for i, (name, data, color) in enumerate(zip(car_names, car_data, face_colors, strict=True)):
    col = i % cols
    cx = margin_x + col * spacing_x
    cy = base_cy

    # Calculate facial feature parameters from data
    scale = face_size / 200
    face_width_factor = 0.6 + data[0] * 0.4
    face_height_factor = 0.6 + data[1] * 0.4
    eye_size = (12 + data[2] * 28) * scale
    eye_spacing = (30 + data[3] * 40) * scale
    mouth_curve = (-50 + data[4] * 100) * scale
    nose_length = (20 + data[5] * 35) * scale
    eyebrow_slant = -20 + data[6] * 40

    face_width = face_size * face_width_factor * 0.45
    face_height = face_size * face_height_factor * 0.55

    # Create group for this face
    face_group = ET.SubElement(faces_group, f"{{{SVG_NS}}}g")
    face_group.set("id", f"face-{name.replace(' ', '-')}")

    # Face outline (ellipse)
    face_ellipse = ET.SubElement(face_group, f"{{{SVG_NS}}}ellipse")
    face_ellipse.set("cx", str(cx))
    face_ellipse.set("cy", str(cy))
    face_ellipse.set("rx", str(face_width))
    face_ellipse.set("ry", str(face_height))
    face_ellipse.set("fill", color)
    face_ellipse.set("fill-opacity", "0.3")
    face_ellipse.set("stroke", color)
    face_ellipse.set("stroke-width", str(max(4, 3 * scale)))

    # Left eye
    left_eye_x = cx - eye_spacing * 0.5
    left_eye_y = cy - face_height * 0.2
    left_eye = ET.SubElement(face_group, f"{{{SVG_NS}}}circle")
    left_eye.set("cx", str(left_eye_x))
    left_eye.set("cy", str(left_eye_y))
    left_eye.set("r", str(eye_size))
    left_eye.set("fill", PAGE_BG)
    left_eye.set("stroke", INK)
    left_eye.set("stroke-width", str(max(3, 2.5 * scale)))

    # Left pupil
    left_pupil = ET.SubElement(face_group, f"{{{SVG_NS}}}circle")
    left_pupil.set("cx", str(left_eye_x))
    left_pupil.set("cy", str(left_eye_y))
    left_pupil.set("r", str(eye_size * 0.4))
    left_pupil.set("fill", INK)

    # Right eye
    right_eye_x = cx + eye_spacing * 0.5
    right_eye_y = cy - face_height * 0.2
    right_eye = ET.SubElement(face_group, f"{{{SVG_NS}}}circle")
    right_eye.set("cx", str(right_eye_x))
    right_eye.set("cy", str(right_eye_y))
    right_eye.set("r", str(eye_size))
    right_eye.set("fill", PAGE_BG)
    right_eye.set("stroke", INK)
    right_eye.set("stroke-width", str(max(3, 2.5 * scale)))

    # Right pupil
    right_pupil = ET.SubElement(face_group, f"{{{SVG_NS}}}circle")
    right_pupil.set("cx", str(right_eye_x))
    right_pupil.set("cy", str(right_eye_y))
    right_pupil.set("r", str(eye_size * 0.4))
    right_pupil.set("fill", INK)

    # Eyebrows
    brow_length = eye_size * 2.2
    brow_y_offset = eye_size + 20 * scale
    slant_offset = np.tan(np.radians(eyebrow_slant)) * brow_length * 0.5

    # Left eyebrow
    left_brow = ET.SubElement(face_group, f"{{{SVG_NS}}}line")
    left_brow.set("x1", str(left_eye_x - brow_length * 0.5))
    left_brow.set("y1", str(left_eye_y - brow_y_offset + slant_offset))
    left_brow.set("x2", str(left_eye_x + brow_length * 0.5))
    left_brow.set("y2", str(left_eye_y - brow_y_offset - slant_offset))
    left_brow.set("stroke", INK)
    left_brow.set("stroke-width", str(max(5, 4 * scale)))
    left_brow.set("stroke-linecap", "round")

    # Right eyebrow (mirrored slant)
    right_brow = ET.SubElement(face_group, f"{{{SVG_NS}}}line")
    right_brow.set("x1", str(right_eye_x - brow_length * 0.5))
    right_brow.set("y1", str(right_eye_y - brow_y_offset - slant_offset))
    right_brow.set("x2", str(right_eye_x + brow_length * 0.5))
    right_brow.set("y2", str(right_eye_y - brow_y_offset + slant_offset))
    right_brow.set("stroke", INK)
    right_brow.set("stroke-width", str(max(5, 4 * scale)))
    right_brow.set("stroke-linecap", "round")

    # Nose (vertical line)
    nose = ET.SubElement(face_group, f"{{{SVG_NS}}}line")
    nose.set("x1", str(cx))
    nose.set("y1", str(cy - nose_length * 0.3))
    nose.set("x2", str(cx))
    nose.set("y2", str(cy + nose_length * 0.5))
    nose.set("stroke", INK)
    nose.set("stroke-width", str(max(4, 3.5 * scale)))
    nose.set("stroke-linecap", "round")

    # Mouth (quadratic bezier curve)
    mouth_y = cy + face_height * 0.45
    mouth_width = face_width * 0.55
    mouth_path = f"M {cx - mouth_width} {mouth_y} Q {cx} {mouth_y + mouth_curve} {cx + mouth_width} {mouth_y}"
    mouth = ET.SubElement(face_group, f"{{{SVG_NS}}}path")
    mouth.set("d", mouth_path)
    mouth.set("fill", "none")
    mouth.set("stroke", INK)
    mouth.set("stroke-width", str(max(5, 4 * scale)))
    mouth.set("stroke-linecap", "round")

    # Label below face
    label_elem = ET.SubElement(face_group, f"{{{SVG_NS}}}text")
    label_elem.set("x", str(cx))
    label_elem.set("y", str(cy + face_height + 65))
    label_elem.set("text-anchor", "middle")
    label_elem.set("font-family", "sans-serif")
    label_elem.set("font-size", str(max(36, 28 * scale)))
    label_elem.set("font-weight", "bold")
    label_elem.set("fill", INK)
    label_elem.text = name

# Add title
title_elem = ET.SubElement(svg_tree, f"{{{SVG_NS}}}text")
title_elem.set("x", "2400")
title_elem.set("y", "100")
title_elem.set("text-anchor", "middle")
title_elem.set("font-family", "sans-serif")
title_elem.set("font-size", "72")
title_elem.set("font-weight", "bold")
title_elem.set("fill", INK)
title_elem.text = "Car Performance Comparison · chernoff-basic · pygal · pyplots.ai"

# Add legend for attributes - positioned closer to faces
legend_y = 1680
legend_x_start = 400

legend_title = ET.SubElement(svg_tree, f"{{{SVG_NS}}}text")
legend_title.set("x", str(legend_x_start))
legend_title.set("y", str(legend_y))
legend_title.set("font-family", "sans-serif")
legend_title.set("font-size", "44")
legend_title.set("font-weight", "bold")
legend_title.set("fill", INK)
legend_title.text = "Feature Mappings:"

feature_mappings = [
    "Face Width = Engine Power",
    "Face Height = Fuel Efficiency",
    "Eye Size = Safety Rating",
    "Eye Spacing = Comfort",
    "Mouth Curve = Reliability",
    "Nose Length = Price Value",
    "Eyebrow Slant = Handling",
]

# Add feature mappings as legend items (two rows)
for i, mapping in enumerate(feature_mappings):
    row = i // 4
    col = i % 4
    text_elem = ET.SubElement(svg_tree, f"{{{SVG_NS}}}text")
    text_elem.set("x", str(legend_x_start + col * 1150))
    text_elem.set("y", str(legend_y + 80 + row * 70))
    text_elem.set("font-family", "sans-serif")
    text_elem.set("font-size", "36")
    text_elem.set("fill", INK_SOFT)
    text_elem.text = mapping

# Add color legend for car identification
color_legend_y = legend_y + 230
color_legend_x = 400

color_title = ET.SubElement(svg_tree, f"{{{SVG_NS}}}text")
color_title.set("x", str(color_legend_x))
color_title.set("y", str(color_legend_y))
color_title.set("font-family", "sans-serif")
color_title.set("font-size", "44")
color_title.set("font-weight", "bold")
color_title.set("fill", INK)
color_title.text = "Cars:"

for i, (name, color) in enumerate(zip(car_names, face_colors, strict=True)):
    # Color swatch
    swatch = ET.SubElement(svg_tree, f"{{{SVG_NS}}}rect")
    swatch.set("x", str(color_legend_x + 150 + i * 850))
    swatch.set("y", str(color_legend_y - 30))
    swatch.set("width", "40")
    swatch.set("height", "40")
    swatch.set("fill", color)
    swatch.set("rx", "5")

    # Car name
    name_elem = ET.SubElement(svg_tree, f"{{{SVG_NS}}}text")
    name_elem.set("x", str(color_legend_x + 200 + i * 850))
    name_elem.set("y", str(color_legend_y))
    name_elem.set("font-family", "sans-serif")
    name_elem.set("font-size", "36")
    name_elem.set("fill", INK_SOFT)
    name_elem.text = name

# Convert back to string
final_svg = ET.tostring(svg_tree, encoding="unicode")

# Add XML declaration
final_svg = '<?xml version="1.0" encoding="UTF-8"?>\n' + final_svg

# Save as SVG file
with open(f"plot-{THEME}.svg", "w") as f:
    f.write(final_svg)

# Use cairosvg to convert to PNG
cairosvg.svg2png(bytestring=final_svg.encode(), write_to=f"plot-{THEME}.png", output_width=4800, output_height=2700)

# Save HTML for interactive version
with open(f"plot-{THEME}.html", "w") as f:
    f.write(
        f"""<!DOCTYPE html>
<html>
<head>
    <title>chernoff-basic · pygal · pyplots.ai</title>
    <style>
        body {{ margin: 0; padding: 20px; background: {PAGE_BG}; font-family: sans-serif; }}
        .container {{ max-width: 100%; margin: 0 auto; }}
        h1 {{ text-align: center; color: {INK}; }}
        object {{ width: 100%; height: auto; }}
    </style>
</head>
<body>
    <div class="container">
        <object type="image/svg+xml" data="plot-{THEME}.svg">
            Chernoff faces visualization not supported
        </object>
    </div>
</body>
</html>"""
    )
Runnable source as JSON, for any HTTP client: https://api.anyplot.ai/specs/chernoff-basic/pygal/code. Any spec id and library id listed in llms-full.txt fit the same URL shape; every URL below is complete and callable.
{
  "spec_id": "chernoff-basic",
  "language": "python",
  "library": "pygal",
  "page": "https://anyplot.ai/chernoff-basic/python/pygal",
  "hub": "https://anyplot.ai/chernoff-basic",
  "code_json": "https://api.anyplot.ai/specs/chernoff-basic/pygal/code",
  "spec_json": "https://api.anyplot.ai/specs/chernoff-basic",
  "render_light_png": "https://storage.googleapis.com/anyplot-images/plots/chernoff-basic/python/pygal/plot-light.png",
  "render_dark_png": "https://storage.googleapis.com/anyplot-images/plots/chernoff-basic/python/pygal/plot-dark.png",
  "interactive_light_html": "https://storage.googleapis.com/anyplot-images/plots/chernoff-basic/python/pygal/plot-light.html",
  "interactive_dark_html": "https://storage.googleapis.com/anyplot-images/plots/chernoff-basic/python/pygal/plot-dark.html",
  "quality_score": 86.0,
  "license": "MIT",
  "guide": "https://anyplot.ai/llms.txt"
}
Part of Chernoff Faces for Multivariate Data on anyplot.ai.