The same plot in 14 other libraries — JavaScript: Chart.js, D3.js, Highcharts, MUI X Charts; Python: Altair, Bokeh, lets-plot, Matplotlib, Plotly, plotnine, Pygal, Seaborn; R: ggplot2; Julia: Makie.jl. Compare all 15 side by side: Chernoff Faces for Multivariate Data in Python, R, Julia and JavaScript.
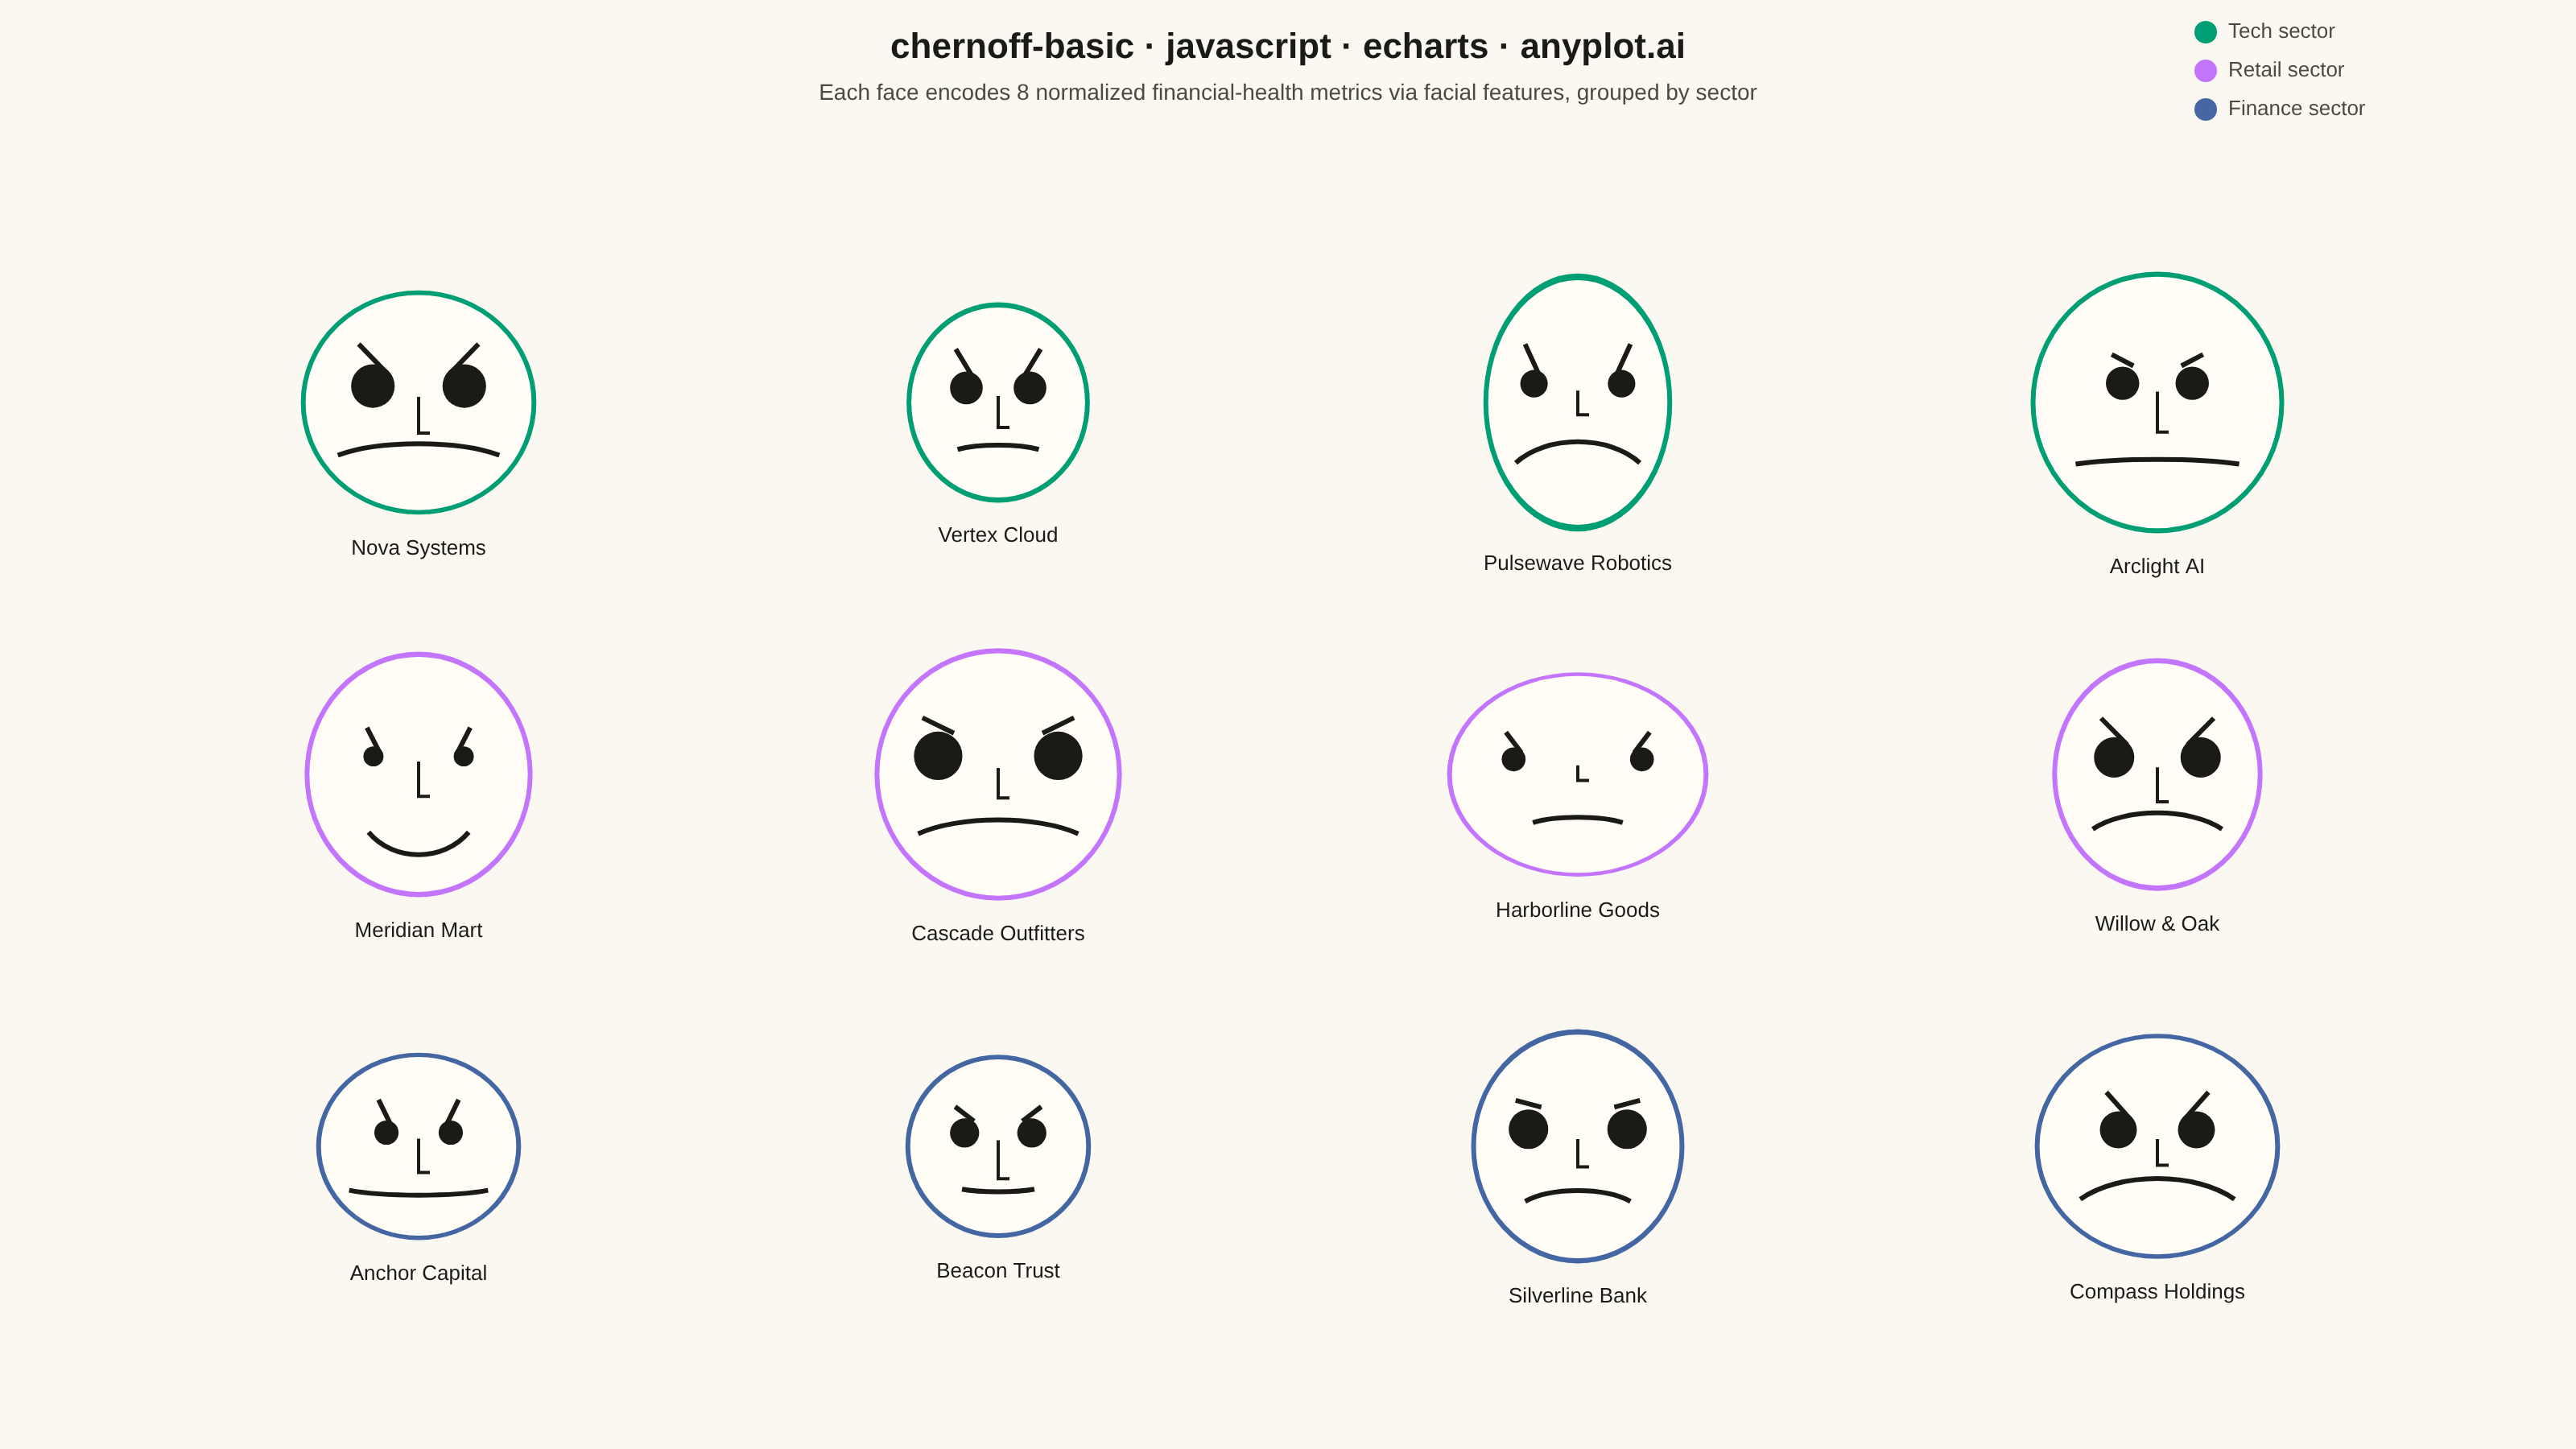
Chernoff faces visualize multivariate data by mapping each variable to a facial feature (eye size, mouth curvature, face width, nose length, etc.), transforming each observation into a unique cartoon face. This technique leverages humans' innate ability to recognize and distinguish faces, making it easier to identify patterns, clusters, and outliers across multiple dimensions simultaneously.
// anyplot.ai
// chernoff-basic: Chernoff Faces for Multivariate Data
// Library: echarts 6.1.0 | JavaScript 22.23.2
// Quality: 92/100 | Created: 2026-09-02
//# anyplot-orientation: landscape

const t = window.ANYPLOT_TOKENS;
const size = window.ANYPLOT_SIZE;

// --- Data (in-memory, deterministic LCG) ------------------------------------
let seed = 42;
const rand = () => {
  seed = (seed * 1103515245 + 12345) % 2147483648;
  return seed / 2147483648;
};
const between = (lo, hi) => lo + rand() * (hi - lo);

const sectors = ["Tech", "Retail", "Finance"];
const names = [
  ["Nova Systems", "Vertex Cloud", "Pulsewave Robotics", "Arclight AI"],
  ["Meridian Mart", "Cascade Outfitters", "Harborline Goods", "Willow & Oak"],
  ["Anchor Capital", "Beacon Trust", "Silverline Bank", "Compass Holdings"],
];

const rawMetrics = [
  "revenueGrowth", "profitMargin", "liquidityRatio", "debtToEquity",
  "marketShare", "rdInvestment", "customerSatisfaction", "employeeRetention",
];
const ranges = {
  revenueGrowth: [-5, 25],
  profitMargin: [-10, 30],
  liquidityRatio: [0.5, 3.0],
  debtToEquity: [0.2, 2.5],
  marketShare: [1, 35],
  rdInvestment: [1, 15],
  customerSatisfaction: [40, 95],
  employeeRetention: [60, 98],
};

const rows = [];
for (let s = 0; s < sectors.length; s++) {
  for (let i = 0; i < names[s].length; i++) {
    const row = { name: names[s][i], sector: sectors[s], sectorIndex: s };
    rawMetrics.forEach((m) => {
      row[m] = between(ranges[m][0], ranges[m][1]);
    });
    rows.push(row);
  }
}

// Normalize each metric to 0-1 across companies (per spec: common scale before mapping)
rawMetrics.forEach((m) => {
  const vals = rows.map((r) => r[m]);
  const lo = Math.min(...vals);
  const hi = Math.max(...vals);
  rows.forEach((r) => {
    r[m + "Norm"] = (r[m] - lo) / (hi - lo);
  });
});

// --- Grid layout ---------------------------------------------------------------
const cols = 4;
const gridRows = 3;
const marginTop = size.height * 0.17;
const marginBottom = size.height * 0.06;
const marginLeft = size.width * 0.05;
const marginRight = size.width * 0.05;
const cellW = (size.width - marginLeft - marginRight) / cols;
const cellH = (size.height - marginTop - marginBottom) / gridRows;
const baseR = Math.min(cellW, cellH) * 0.3;

const sectorColors = [t.palette[0], t.palette[1], t.palette[2]];

// Each observation: grid position + feature fractions (0-1 metric -> shape fraction)
const companies = rows.map((r, i) => {
  const col = i % cols;
  const gridRow = Math.floor(i / cols);
  return {
    name: r.name,
    color: sectorColors[r.sectorIndex],
    cx: marginLeft + cellW * (col + 0.5),
    cy: marginTop + cellH * (gridRow + 0.5) - cellH * 0.08,
    widthScale: 0.8 + 0.35 * r.revenueGrowthNorm, // face width <- revenue growth
    heightScale: 0.8 + 0.35 * r.profitMarginNorm, // face height <- profit margin
    eyeSizeFrac: 0.09 + 0.11 * r.marketShareNorm, // eye size <- market share
    eyeSpacingFrac: 0.28 + 0.22 * r.customerSatisfactionNorm, // eye spacing <- customer satisfaction
    browSlantFrac: 0.06 + 0.3 * r.debtToEquityNorm, // eyebrow slant <- debt-to-equity
    noseLengthFrac: 0.15 + 0.28 * r.rdInvestmentNorm, // nose length <- R&D investment
    mouthWidthFrac: 0.35 + 0.35 * r.liquidityRatioNorm, // mouth width <- liquidity ratio
    curvatureFrac: r.employeeRetentionNorm - 0.5, // mouth curvature <- employee retention
  };
});

// --- Face renderer ---------------------------------------------------------------
const renderItem = (params, api) => {
  const c = companies[params.dataIndex];
  const [px, py] = api.coord([api.value(0), api.value(1)]);
  const faceRx = baseR * c.widthScale;
  const faceRy = baseR * c.heightScale;
  const eyeSize = faceRx * c.eyeSizeFrac;
  const eyeSpacingHalf = faceRx * c.eyeSpacingFrac;
  const eyeY = -faceRy * 0.15;
  const browY = eyeY - eyeSize - faceRy * 0.05;
  const browSlant = faceRy * c.browSlantFrac;
  const browHalfLen = eyeSize * 1.3;
  const noseTopY = eyeY + eyeSize * 0.5;
  const noseLength = faceRy * c.noseLengthFrac;
  const noseBottomY = noseTopY + noseLength;
  const mouthY = faceRy * 0.48;
  const mouthHalfWidth = faceRx * c.mouthWidthFrac;
  const curvature = c.curvatureFrac * faceRy * 0.5;

  return {
    type: "group",
    x: px,
    y: py,
    children: [
      // face outline (width/height fractions above become an ellipse via scaleY)
      {
        type: "circle",
        shape: { cx: 0, cy: 0, r: faceRx },
        scaleY: faceRy / faceRx,
        style: { fill: t.elevatedBg, stroke: c.color, lineWidth: 3 },
      },
      // eyes
      { type: "circle", shape: { cx: -eyeSpacingHalf, cy: eyeY, r: eyeSize }, style: { fill: t.ink } },
      { type: "circle", shape: { cx: eyeSpacingHalf, cy: eyeY, r: eyeSize }, style: { fill: t.ink } },
      // eyebrows (inner point lower = steeper slant = higher debt-to-equity)
      {
        type: "line",
        shape: {
          x1: -eyeSpacingHalf - browHalfLen * 0.5, y1: browY - browSlant / 2,
          x2: -eyeSpacingHalf + browHalfLen * 0.5, y2: browY + browSlant / 2,
        },
        style: { stroke: t.ink, lineWidth: 3 },
      },
      {
        type: "line",
        shape: {
          x1: eyeSpacingHalf + browHalfLen * 0.5, y1: browY - browSlant / 2,
          x2: eyeSpacingHalf - browHalfLen * 0.5, y2: browY + browSlant / 2,
        },
        style: { stroke: t.ink, lineWidth: 3 },
      },
      // nose
      {
        type: "polyline",
        shape: { points: [[0, noseTopY], [0, noseBottomY], [7, noseBottomY]] },
        style: { stroke: t.ink, lineWidth: 2, fill: "none" },
      },
      // mouth (positive curvature = corners pulled up = smile)
      {
        type: "bezierCurve",
        shape: {
          x1: -mouthHalfWidth, y1: mouthY, x2: mouthHalfWidth, y2: mouthY,
          cpx1: -mouthHalfWidth * 0.5, cpy1: mouthY + curvature,
          cpx2: mouthHalfWidth * 0.5, cpy2: mouthY + curvature,
        },
        style: { stroke: t.ink, lineWidth: 3, fill: "none" },
      },
      // label
      {
        type: "text",
        style: {
          text: c.name, x: 0, y: faceRy + 16,
          fill: t.ink, fontSize: 13, fontWeight: 500,
          align: "center", verticalAlign: "top",
        },
      },
    ],
  };
};

// --- Sector legend (static color key, top-right) ---------------------------------
const legend = sectors.map((name, i) => ({
  type: "group",
  x: size.width - marginRight - 150,
  y: 20 + i * 24,
  children: [
    { type: "circle", shape: { cx: 0, cy: 0, r: 7 }, style: { fill: sectorColors[i] } },
    {
      type: "text",
      style: {
        text: `${name} sector`, x: 14, y: 0,
        fill: t.inkSoft, fontSize: 13, align: "left", verticalAlign: "middle",
      },
    },
  ],
}));

// --- Chart -------------------------------------------------------------------------
const chart = echarts.init(document.getElementById("container"));
chart.setOption({
  animation: false,
  backgroundColor: "transparent",
  title: {
    text: "chernoff-basic · javascript · echarts · anyplot.ai",
    subtext: "Each face encodes 8 normalized financial-health metrics via facial features, grouped by sector",
    left: "center",
    top: 14,
    textStyle: { color: t.ink, fontSize: 22, fontWeight: "bold" },
    subtextStyle: { color: t.inkSoft, fontSize: 14 },
  },
  graphic: legend,
  grid: { left: 0, right: 0, top: 0, bottom: 0 },
  xAxis: { type: "value", show: false, min: 0, max: size.width },
  yAxis: { type: "value", show: false, min: 0, max: size.height, inverse: true },
  series: [
    {
      type: "custom",
      renderItem,
      data: companies.map((c) => [c.cx, c.cy]),
    },
  ],
});
Runnable source as JSON, for any HTTP client: https://api.anyplot.ai/specs/chernoff-basic/echarts/code. Any spec id and library id listed in llms-full.txt fit the same URL shape; every URL below is complete and callable.
{
  "spec_id": "chernoff-basic",
  "language": "javascript",
  "library": "echarts",
  "page": "https://anyplot.ai/chernoff-basic/javascript/echarts",
  "hub": "https://anyplot.ai/chernoff-basic",
  "code_json": "https://api.anyplot.ai/specs/chernoff-basic/echarts/code",
  "spec_json": "https://api.anyplot.ai/specs/chernoff-basic",
  "render_light_png": "https://storage.googleapis.com/anyplot-images/plots/chernoff-basic/javascript/echarts/plot-light.png",
  "render_dark_png": "https://storage.googleapis.com/anyplot-images/plots/chernoff-basic/javascript/echarts/plot-dark.png",
  "interactive_light_html": "https://storage.googleapis.com/anyplot-images/plots/chernoff-basic/javascript/echarts/plot-light.html",
  "interactive_dark_html": "https://storage.googleapis.com/anyplot-images/plots/chernoff-basic/javascript/echarts/plot-dark.html",
  "quality_score": 92.0,
  "license": "MIT",
  "guide": "https://anyplot.ai/llms.txt"
}
Part of Chernoff Faces for Multivariate Data on anyplot.ai.