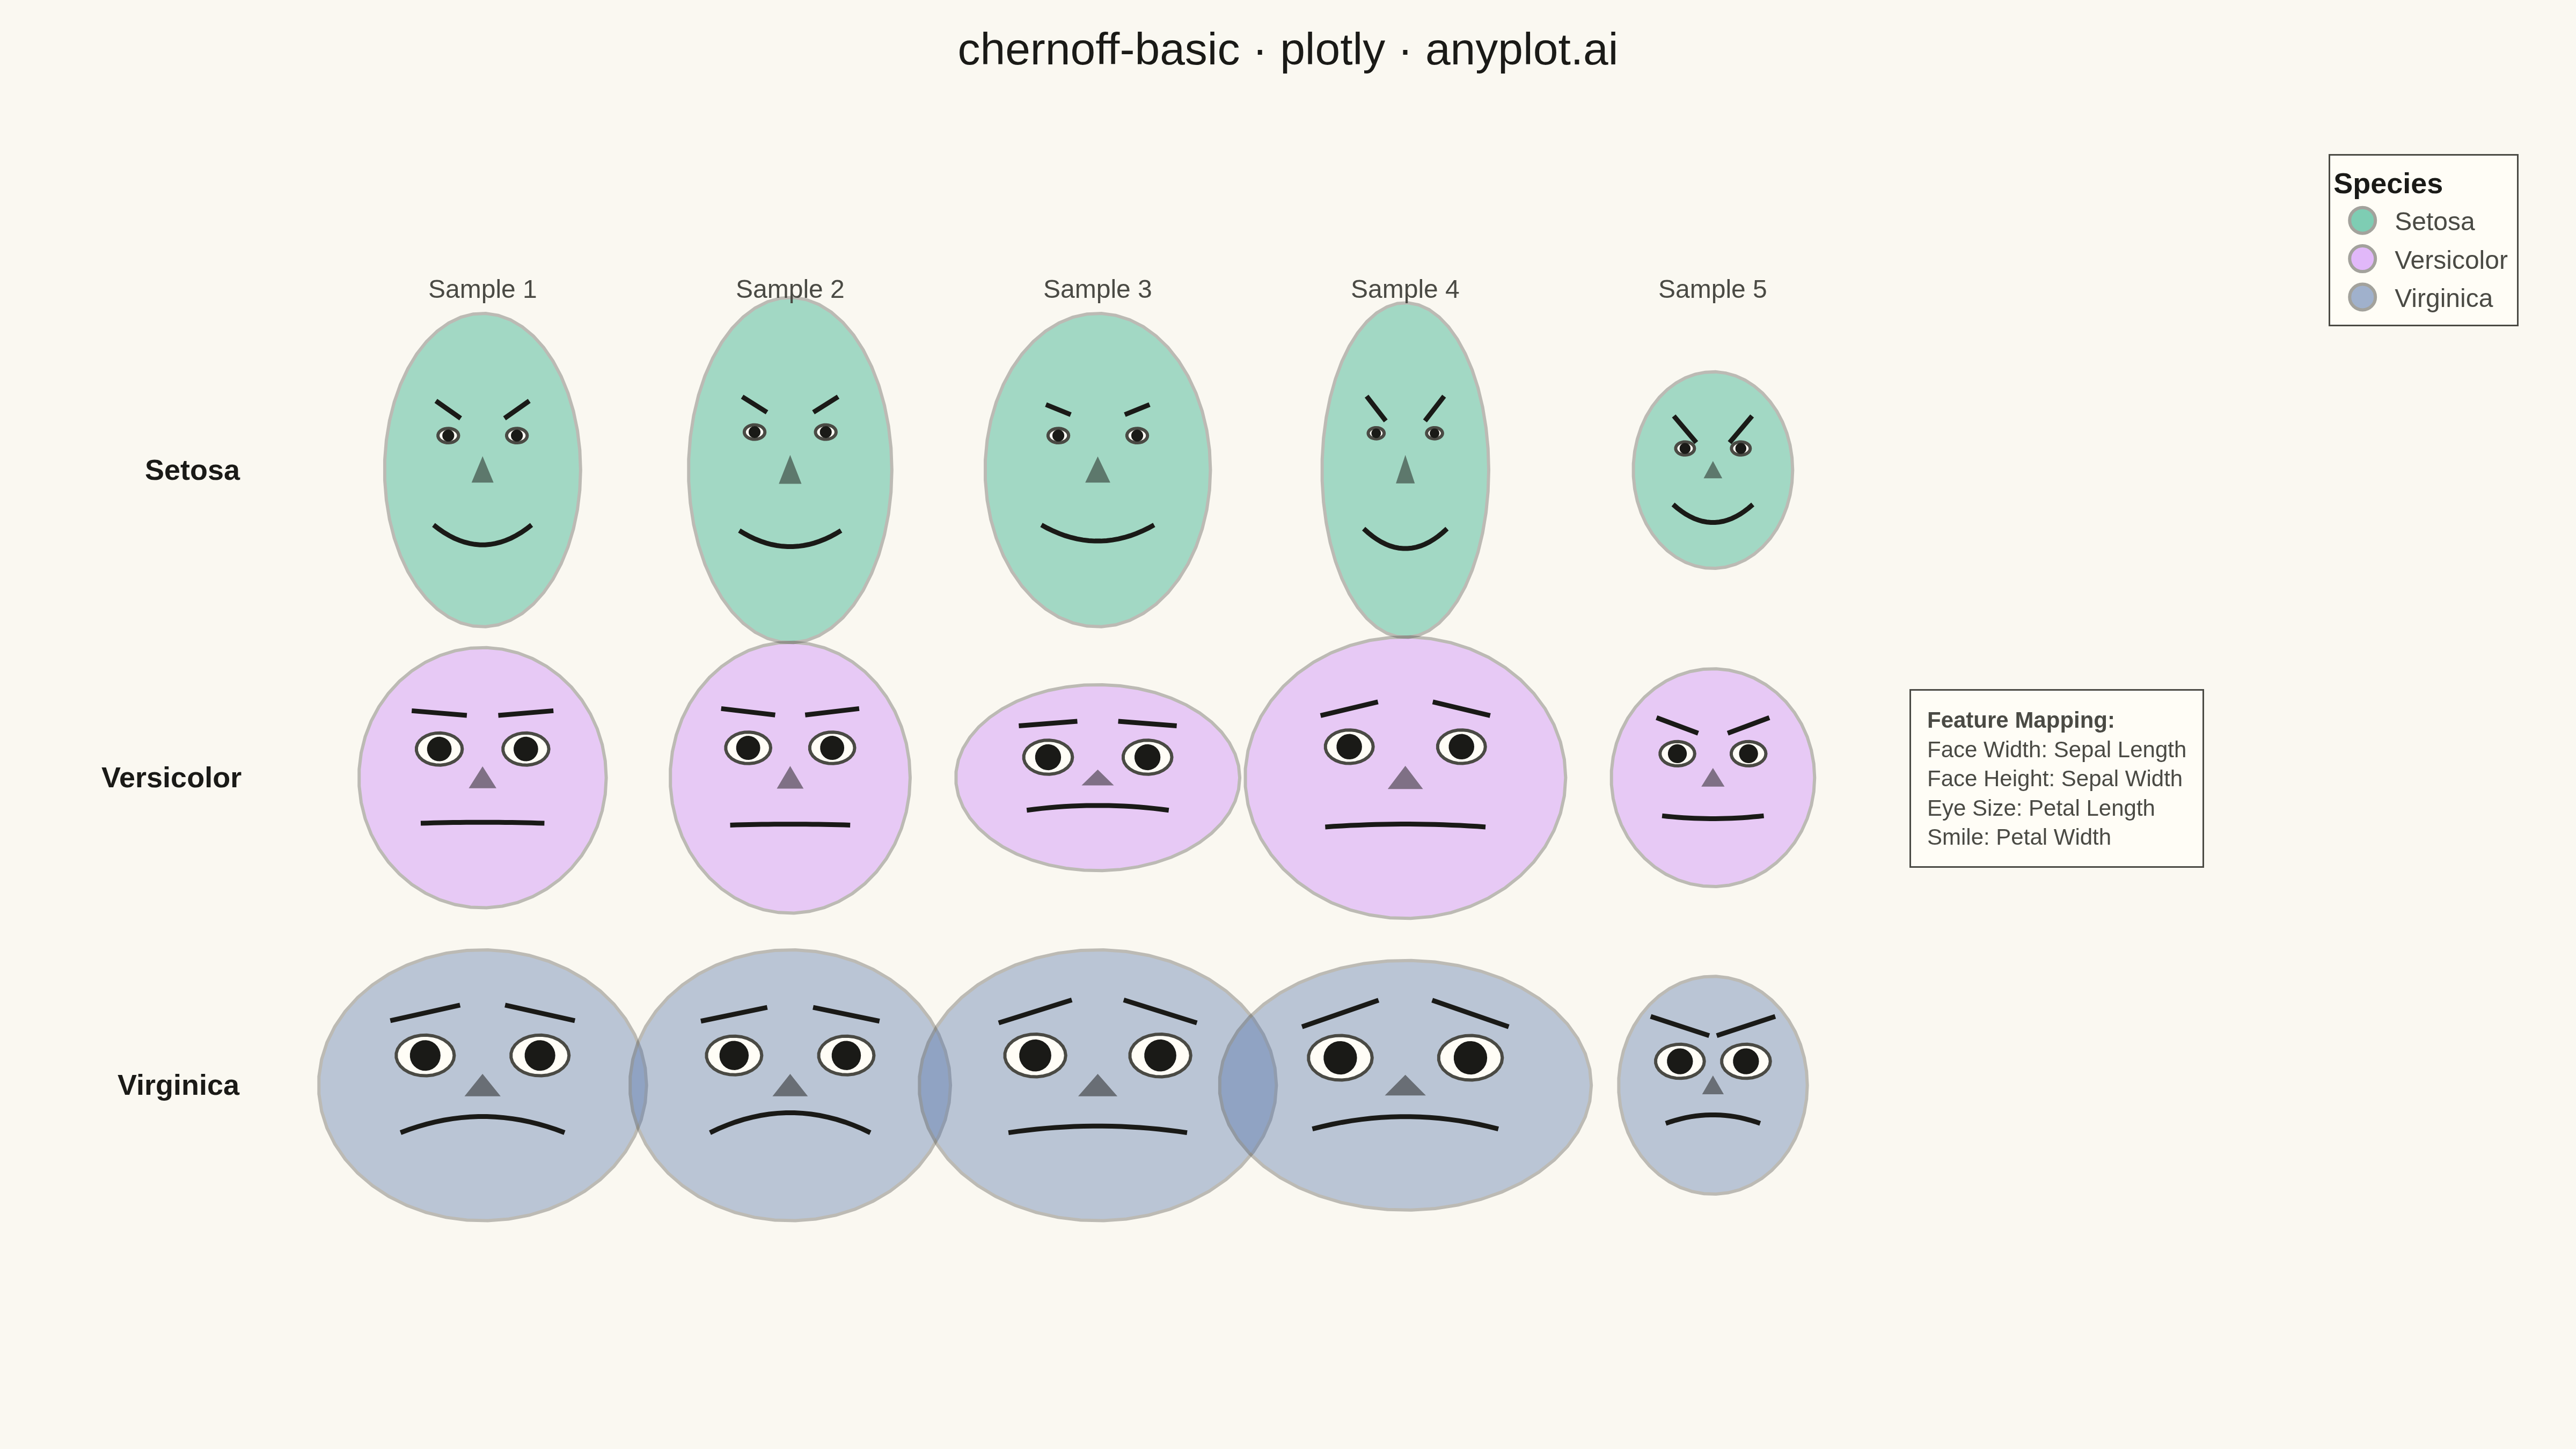
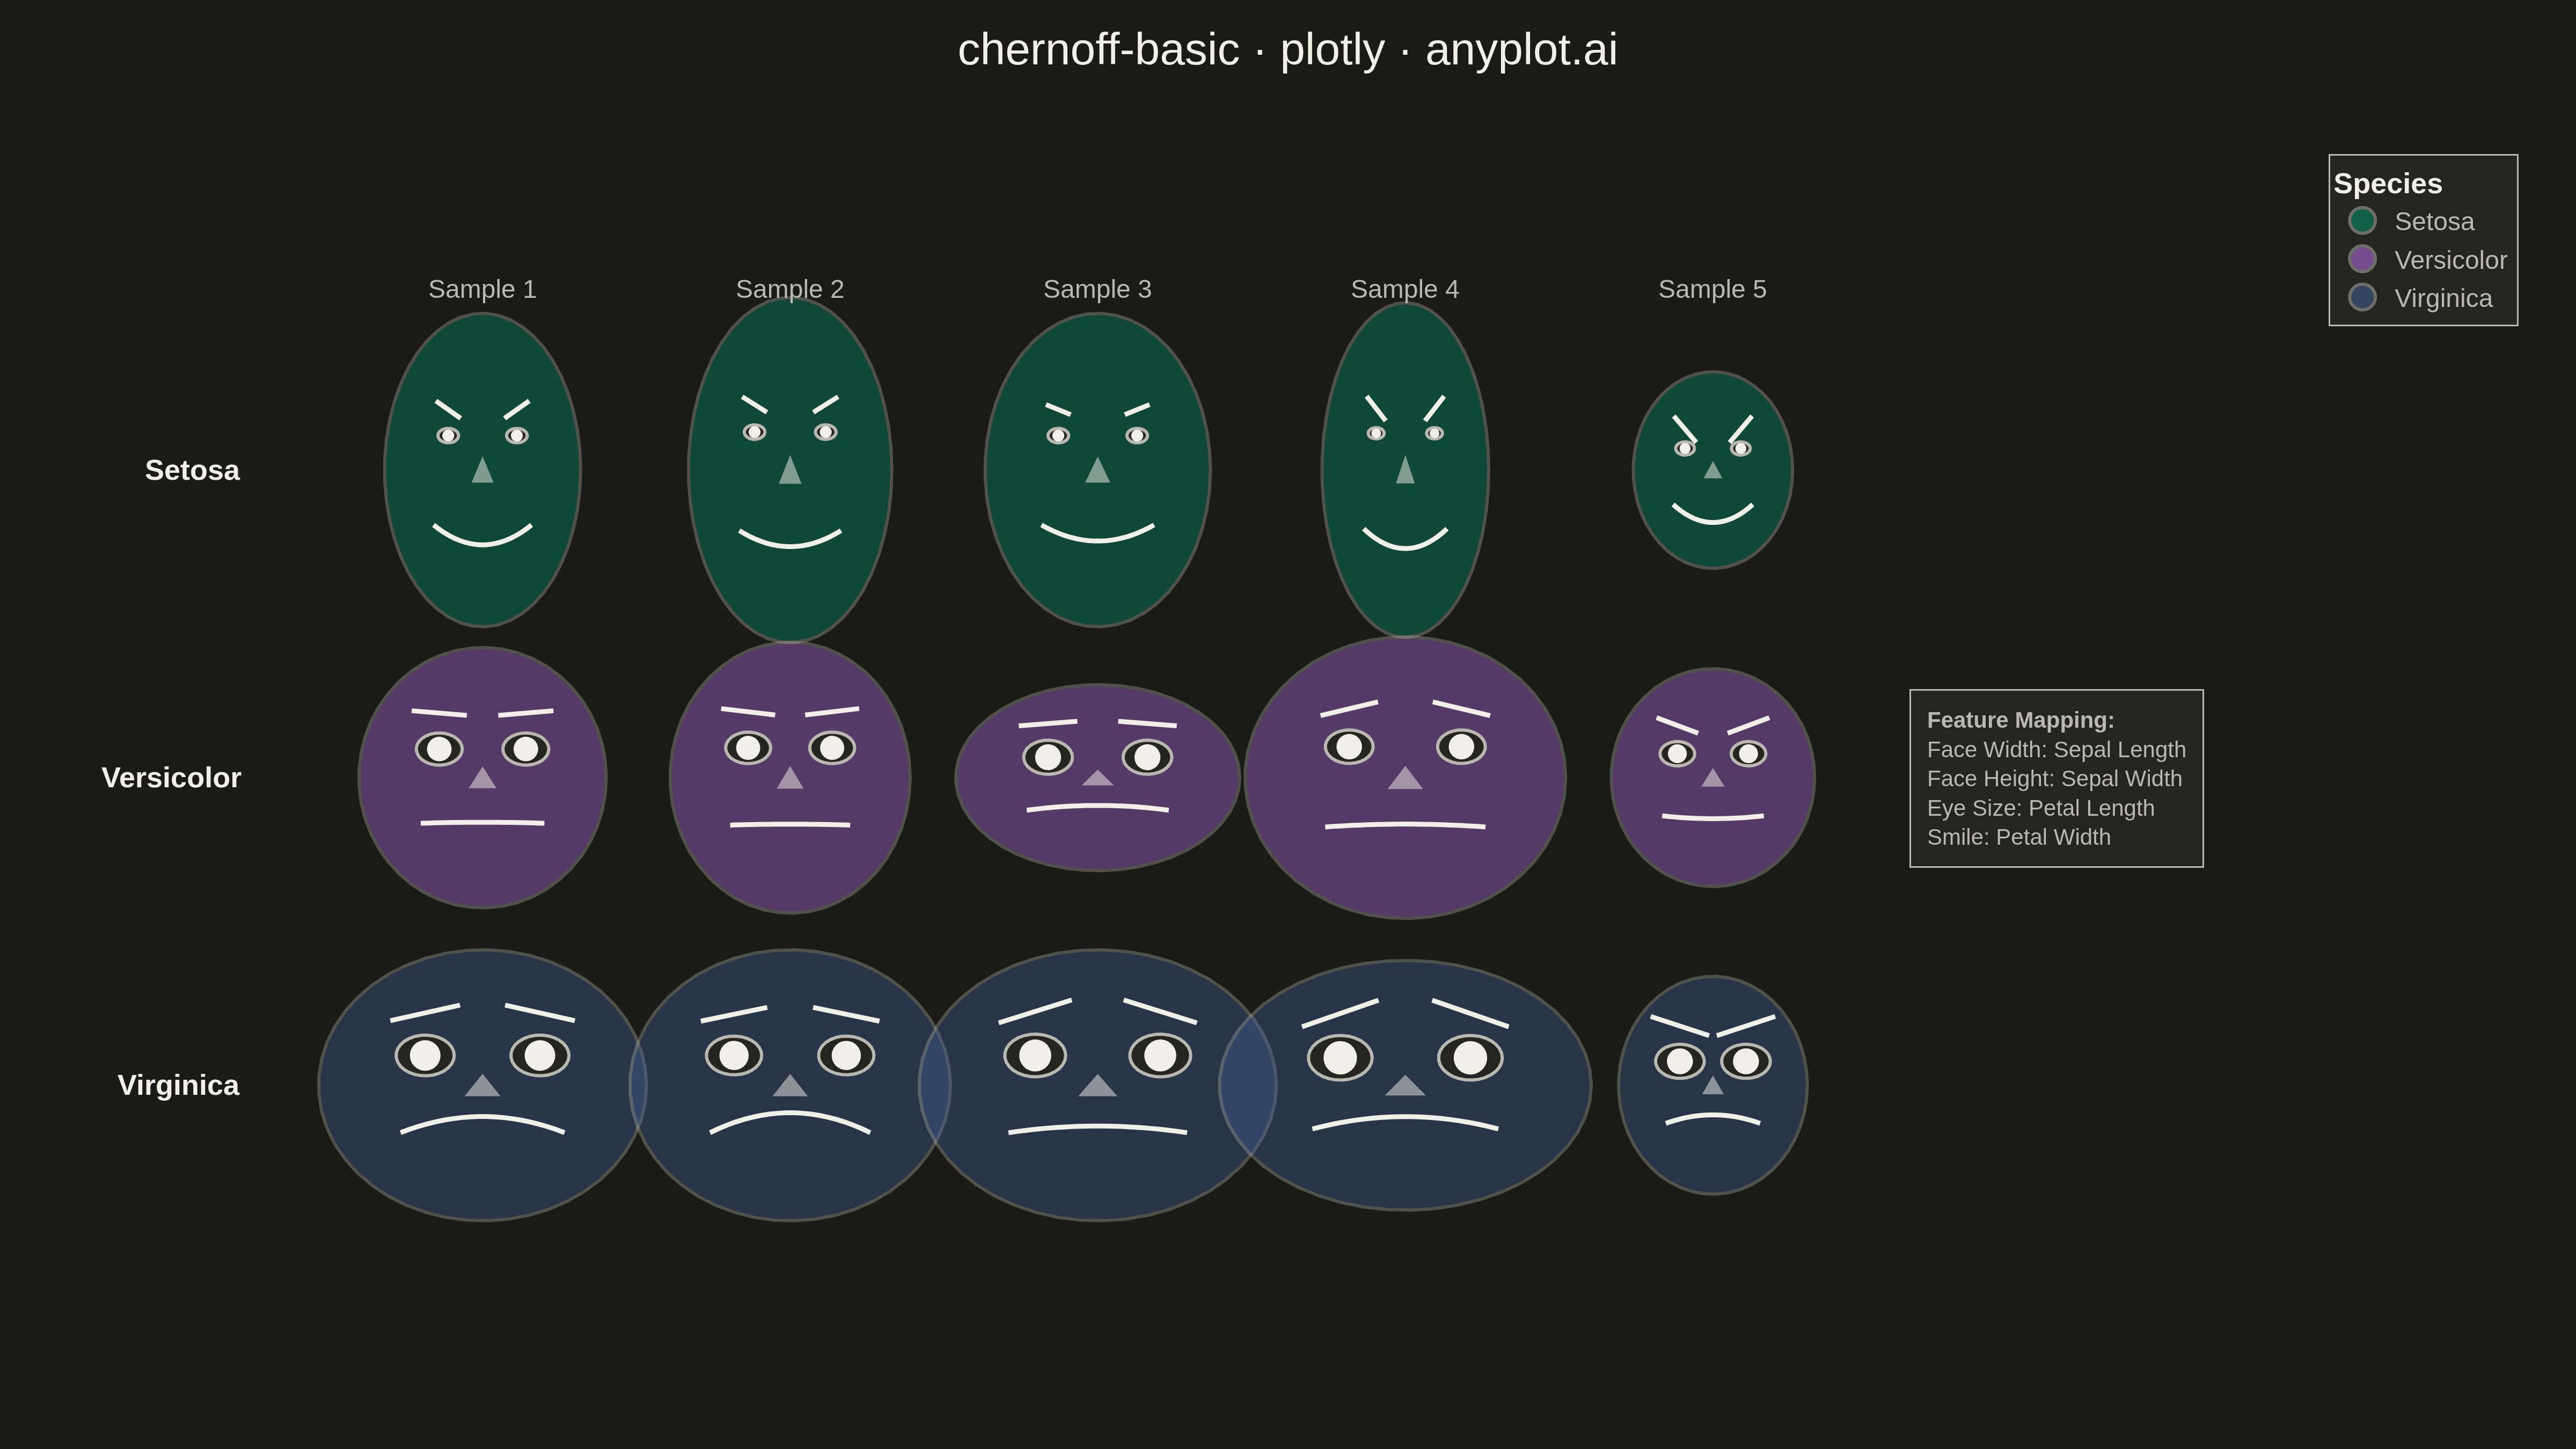
Chernoff faces visualize multivariate data by mapping each variable to a facial feature (eye size, mouth curvature, face width, nose length, etc.), transforming each observation into a unique cartoon face. This technique leverages humans' innate ability to recognize and distinguish faces, making it easier to identify patterns, clusters, and outliers across multiple dimensions simultaneously.
""" anyplot.ai
chernoff-basic: Chernoff Faces for Multivariate Data
Library: plotly 6.7.0 | Python 3.13.13
Quality: 92/100 | Updated: 2026-05-15
"""

import os

import numpy as np
import plotly.graph_objects as go
from sklearn.datasets import load_iris


# Theme tokens
THEME = os.getenv("ANYPLOT_THEME", "light")
PAGE_BG = "#FAF8F1" if THEME == "light" else "#1A1A17"
ELEVATED_BG = "#FFFDF6" if THEME == "light" else "#242420"
INK = "#1A1A17" if THEME == "light" else "#F0EFE8"
INK_SOFT = "#4A4A44" if THEME == "light" else "#B8B7B0"
GRID = "rgba(26,26,23,0.10)" if THEME == "light" else "rgba(240,239,232,0.10)"

# Okabe-Ito palette (first series is always #009E73)
IMPRINT = ["#009E73", "#C475FD", "#4467A3"]

# Data - use Iris dataset with 4 measurements per flower
np.random.seed(42)
iris = load_iris()
X = iris.data
y = iris.target
feature_names = iris.feature_names
target_names = iris.target_names

# Select subset for clear visualization (5 samples per species = 15 faces)
indices = []
for species in range(3):
    species_mask = y == species
    species_data = X[species_mask]
    species_indices_all = np.where(species_mask)[0]
    # Calculate variance score for each sample and select diverse ones
    mean_vals = species_data.mean(axis=0)
    distances = np.sum((species_data - mean_vals) ** 2, axis=1)
    # Select min, max distance and 3 evenly spaced others
    sorted_idx = np.argsort(distances)
    selected = [
        sorted_idx[0],
        sorted_idx[len(sorted_idx) // 4],
        sorted_idx[len(sorted_idx) // 2],
        sorted_idx[3 * len(sorted_idx) // 4],
        sorted_idx[-1],
    ]
    indices.extend([species_indices_all[i] for i in selected])

X_subset = X[indices]
y_subset = y[indices]

# Normalize data to 0-1 range
X_norm = (X_subset - X_subset.min(axis=0)) / (X_subset.max(axis=0) - X_subset.min(axis=0))

# Create figure
fig = go.Figure()

# Grid layout: 3 rows (species) x 5 columns (samples)
n_cols = 5
n_rows = 3
spacing = 2.2
radius = 0.95

all_shapes = []

# Create all faces inline (KISS - no functions)
for i, (data, species) in enumerate(zip(X_norm, y_subset)):
    row = i // n_cols
    col = i % n_cols

    cx = col * spacing + spacing / 2
    cy = (n_rows - 1 - row) * spacing + spacing / 2

    color = IMPRINT[species]

    # Feature mapping with increased variation:
    #   - sepal_length (data[0]) -> face width
    #   - sepal_width (data[1]) -> face height
    #   - petal_length (data[2]) -> eye size
    #   - petal_width (data[3]) -> mouth curvature
    face_width_factor = 0.6 + data[0] * 0.8  # 0.6-1.4 (wider range)
    face_height_factor = 0.7 + data[1] * 0.6  # 0.7-1.3 (wider range)
    eye_size = 0.06 + data[2] * 0.18  # 0.06-0.24 (more variation)
    mouth_curve = -0.3 + data[3] * 0.6  # -0.3 to +0.3 (frown to big smile)

    # Face outline (ellipse)
    face_w = radius * face_width_factor
    face_h = radius * face_height_factor
    theta = np.linspace(0, 2 * np.pi, 50)
    face_x = cx + face_w * np.cos(theta)
    face_y = cy + face_h * np.sin(theta)

    all_shapes.append(
        dict(
            type="path",
            path="M " + " L ".join([f"{x},{y}" for x, y in zip(face_x, face_y)]) + " Z",
            fillcolor=color,
            line=dict(color=INK_SOFT, width=2),
            opacity=0.35,
        )
    )

    # Eyes
    eye_offset_x = face_w * 0.35
    eye_offset_y = face_h * 0.22
    eye_r = radius * eye_size
    eye_theta = np.linspace(0, 2 * np.pi, 30)

    # Left eye
    left_eye_x = (cx - eye_offset_x) + eye_r * np.cos(eye_theta)
    left_eye_y = (cy + eye_offset_y) + eye_r * 0.7 * np.sin(eye_theta)
    all_shapes.append(
        dict(
            type="path",
            path="M " + " L ".join([f"{x},{y}" for x, y in zip(left_eye_x, left_eye_y)]) + " Z",
            fillcolor=ELEVATED_BG,
            line=dict(color=INK_SOFT, width=2),
        )
    )

    # Left pupil
    pupil_r = eye_r * 0.5
    pupil_x = (cx - eye_offset_x) + pupil_r * np.cos(eye_theta)
    pupil_y = (cy + eye_offset_y) + pupil_r * np.sin(eye_theta)
    all_shapes.append(
        dict(
            type="path",
            path="M " + " L ".join([f"{x},{y}" for x, y in zip(pupil_x, pupil_y)]) + " Z",
            fillcolor=INK,
            line=dict(color=INK, width=1),
        )
    )

    # Right eye
    right_eye_x = (cx + eye_offset_x) + eye_r * np.cos(eye_theta)
    right_eye_y = (cy + eye_offset_y) + eye_r * 0.7 * np.sin(eye_theta)
    all_shapes.append(
        dict(
            type="path",
            path="M " + " L ".join([f"{x},{y}" for x, y in zip(right_eye_x, right_eye_y)]) + " Z",
            fillcolor=ELEVATED_BG,
            line=dict(color=INK_SOFT, width=2),
        )
    )

    # Right pupil
    pupil_x = (cx + eye_offset_x) + pupil_r * np.cos(eye_theta)
    pupil_y = (cy + eye_offset_y) + pupil_r * np.sin(eye_theta)
    all_shapes.append(
        dict(
            type="path",
            path="M " + " L ".join([f"{x},{y}" for x, y in zip(pupil_x, pupil_y)]) + " Z",
            fillcolor=INK,
            line=dict(color=INK, width=1),
        )
    )

    # Nose (simple triangle)
    nose_h = face_h * 0.15
    nose_w = face_w * 0.1
    nose_y_center = cy
    nose_path = f"M {cx},{nose_y_center + nose_h * 0.5} L {cx - nose_w},{nose_y_center - nose_h * 0.5} L {cx + nose_w},{nose_y_center - nose_h * 0.5} Z"
    all_shapes.append(dict(type="path", path=nose_path, fillcolor=INK, line=dict(color=INK, width=1), opacity=0.5))

    # Mouth (curved line with much more variation)
    mouth_y_base = cy - face_h * 0.35
    mouth_width = face_w * 0.5
    mouth_points = 20
    mouth_x_vals = np.linspace(cx - mouth_width, cx + mouth_width, mouth_points)
    # Parabolic curve: positive = smile, negative = frown
    mouth_y_vals = mouth_y_base + mouth_curve * (1 - ((mouth_x_vals - cx) / mouth_width) ** 2) * radius * 0.5
    mouth_path = "M " + " L ".join([f"{x},{y}" for x, y in zip(mouth_x_vals, mouth_y_vals)])
    all_shapes.append(dict(type="path", path=mouth_path, line=dict(color=INK, width=3)))

    # Eyebrows (angled based on face width feature)
    brow_offset_y = eye_offset_y + eye_r + face_h * 0.1
    brow_width = eye_r * 1.2
    brow_angle = (data[0] - 0.5) * 0.2  # More angle variation

    # Left eyebrow
    all_shapes.append(
        dict(
            type="line",
            x0=cx - eye_offset_x - brow_width,
            y0=cy + brow_offset_y - brow_angle * radius,
            x1=cx - eye_offset_x + brow_width,
            y1=cy + brow_offset_y + brow_angle * radius,
            line=dict(color=INK, width=3),
        )
    )

    # Right eyebrow
    all_shapes.append(
        dict(
            type="line",
            x0=cx + eye_offset_x - brow_width,
            y0=cy + brow_offset_y + brow_angle * radius,
            x1=cx + eye_offset_x + brow_width,
            y1=cy + brow_offset_y - brow_angle * radius,
            line=dict(color=INK, width=3),
        )
    )

# Add invisible scatter for axis setup
fig.add_trace(go.Scatter(x=[0], y=[0], mode="markers", marker=dict(opacity=0), showlegend=False))

# Add legend entries for species
for i, (name, color) in enumerate(zip(target_names, IMPRINT)):
    fig.add_trace(
        go.Scatter(
            x=[None],
            y=[None],
            mode="markers",
            marker=dict(size=20, color=color, opacity=0.5, line=dict(color=INK_SOFT, width=2)),
            name=name.capitalize(),
            showlegend=True,
        )
    )

# Row labels (species names)
for i, name in enumerate(target_names):
    row_y = (n_rows - 1 - i) * spacing + spacing / 2
    fig.add_annotation(
        x=-0.6,
        y=row_y,
        text=f"<b>{name.capitalize()}</b>",
        showarrow=False,
        font=dict(size=18, color=INK),
        xanchor="right",
    )

# Column labels (sample numbers)
for col in range(n_cols):
    col_x = col * spacing + spacing / 2
    fig.add_annotation(
        x=col_x, y=n_rows * spacing + 0.2, text=f"Sample {col + 1}", showarrow=False, font=dict(size=16, color=INK_SOFT)
    )

# Feature mapping legend
mapping_text = (
    "<b>Feature Mapping:</b><br>"
    "Face Width: Sepal Length<br>"
    "Face Height: Sepal Width<br>"
    "Eye Size: Petal Length<br>"
    "Smile: Petal Width"
)
fig.add_annotation(
    x=n_cols * spacing + 0.3,
    y=n_rows * spacing / 2,
    text=mapping_text,
    showarrow=False,
    font=dict(size=14, color=INK_SOFT),
    align="left",
    xanchor="left",
    bgcolor=ELEVATED_BG,
    bordercolor=INK_SOFT,
    borderwidth=1,
    borderpad=10,
)

# Update layout - optimized for better space utilization
fig.update_layout(
    title=dict(text="chernoff-basic · plotly · anyplot.ai", font=dict(size=28, color=INK), x=0.5, xanchor="center"),
    shapes=all_shapes,
    xaxis=dict(range=[-1.2, n_cols * spacing + 3.0], showgrid=False, zeroline=False, showticklabels=False, title=""),
    yaxis=dict(
        range=[-0.3, n_rows * spacing + 0.6],
        showgrid=False,
        zeroline=False,
        showticklabels=False,
        title="",
        scaleanchor="x",
        scaleratio=1,
    ),
    paper_bgcolor=PAGE_BG,
    plot_bgcolor=PAGE_BG,
    font=dict(color=INK),
    legend=dict(
        title=dict(text="<b>Species</b>", font=dict(size=18, color=INK)),
        font=dict(size=16, color=INK_SOFT),
        x=1.02,
        y=0.98,
        xanchor="left",
        bgcolor=ELEVATED_BG,
        bordercolor=INK_SOFT,
        borderwidth=1,
    ),
    margin=dict(l=100, r=180, t=80, b=40),
)

# Save as PNG
fig.write_image(f"plot-{THEME}.png", width=1600, height=900, scale=3)

# Save interactive HTML
fig.write_html(f"plot-{THEME}.html", include_plotlyjs="cdn")
Runnable source as JSON, for any HTTP client: https://api.anyplot.ai/specs/chernoff-basic/plotly/code. Any spec id and library id listed in llms-full.txt fit the same URL shape; every URL below is complete and callable.
{
  "spec_id": "chernoff-basic",
  "language": "python",
  "library": "plotly",
  "page": "https://anyplot.ai/chernoff-basic/python/plotly",
  "hub": "https://anyplot.ai/chernoff-basic",
  "code_json": "https://api.anyplot.ai/specs/chernoff-basic/plotly/code",
  "spec_json": "https://api.anyplot.ai/specs/chernoff-basic",
  "render_light_png": "https://storage.googleapis.com/anyplot-images/plots/chernoff-basic/python/plotly/plot-light.png",
  "render_dark_png": "https://storage.googleapis.com/anyplot-images/plots/chernoff-basic/python/plotly/plot-dark.png",
  "interactive_light_html": "https://storage.googleapis.com/anyplot-images/plots/chernoff-basic/python/plotly/plot-light.html",
  "interactive_dark_html": "https://storage.googleapis.com/anyplot-images/plots/chernoff-basic/python/plotly/plot-dark.html",
  "quality_score": 92.0,
  "license": "MIT",
  "guide": "https://anyplot.ai/llms.txt"
}
Part of Chernoff Faces for Multivariate Data on anyplot.ai.