The same plot in 14 other libraries — JavaScript: Chart.js, D3.js, Apache ECharts, Highcharts; Python: Altair, Bokeh, lets-plot, Matplotlib, Plotly, plotnine, Pygal, Seaborn; R: ggplot2; Julia: Makie.jl. Compare all 15 side by side: Chernoff Faces for Multivariate Data in Python, R, Julia and JavaScript.
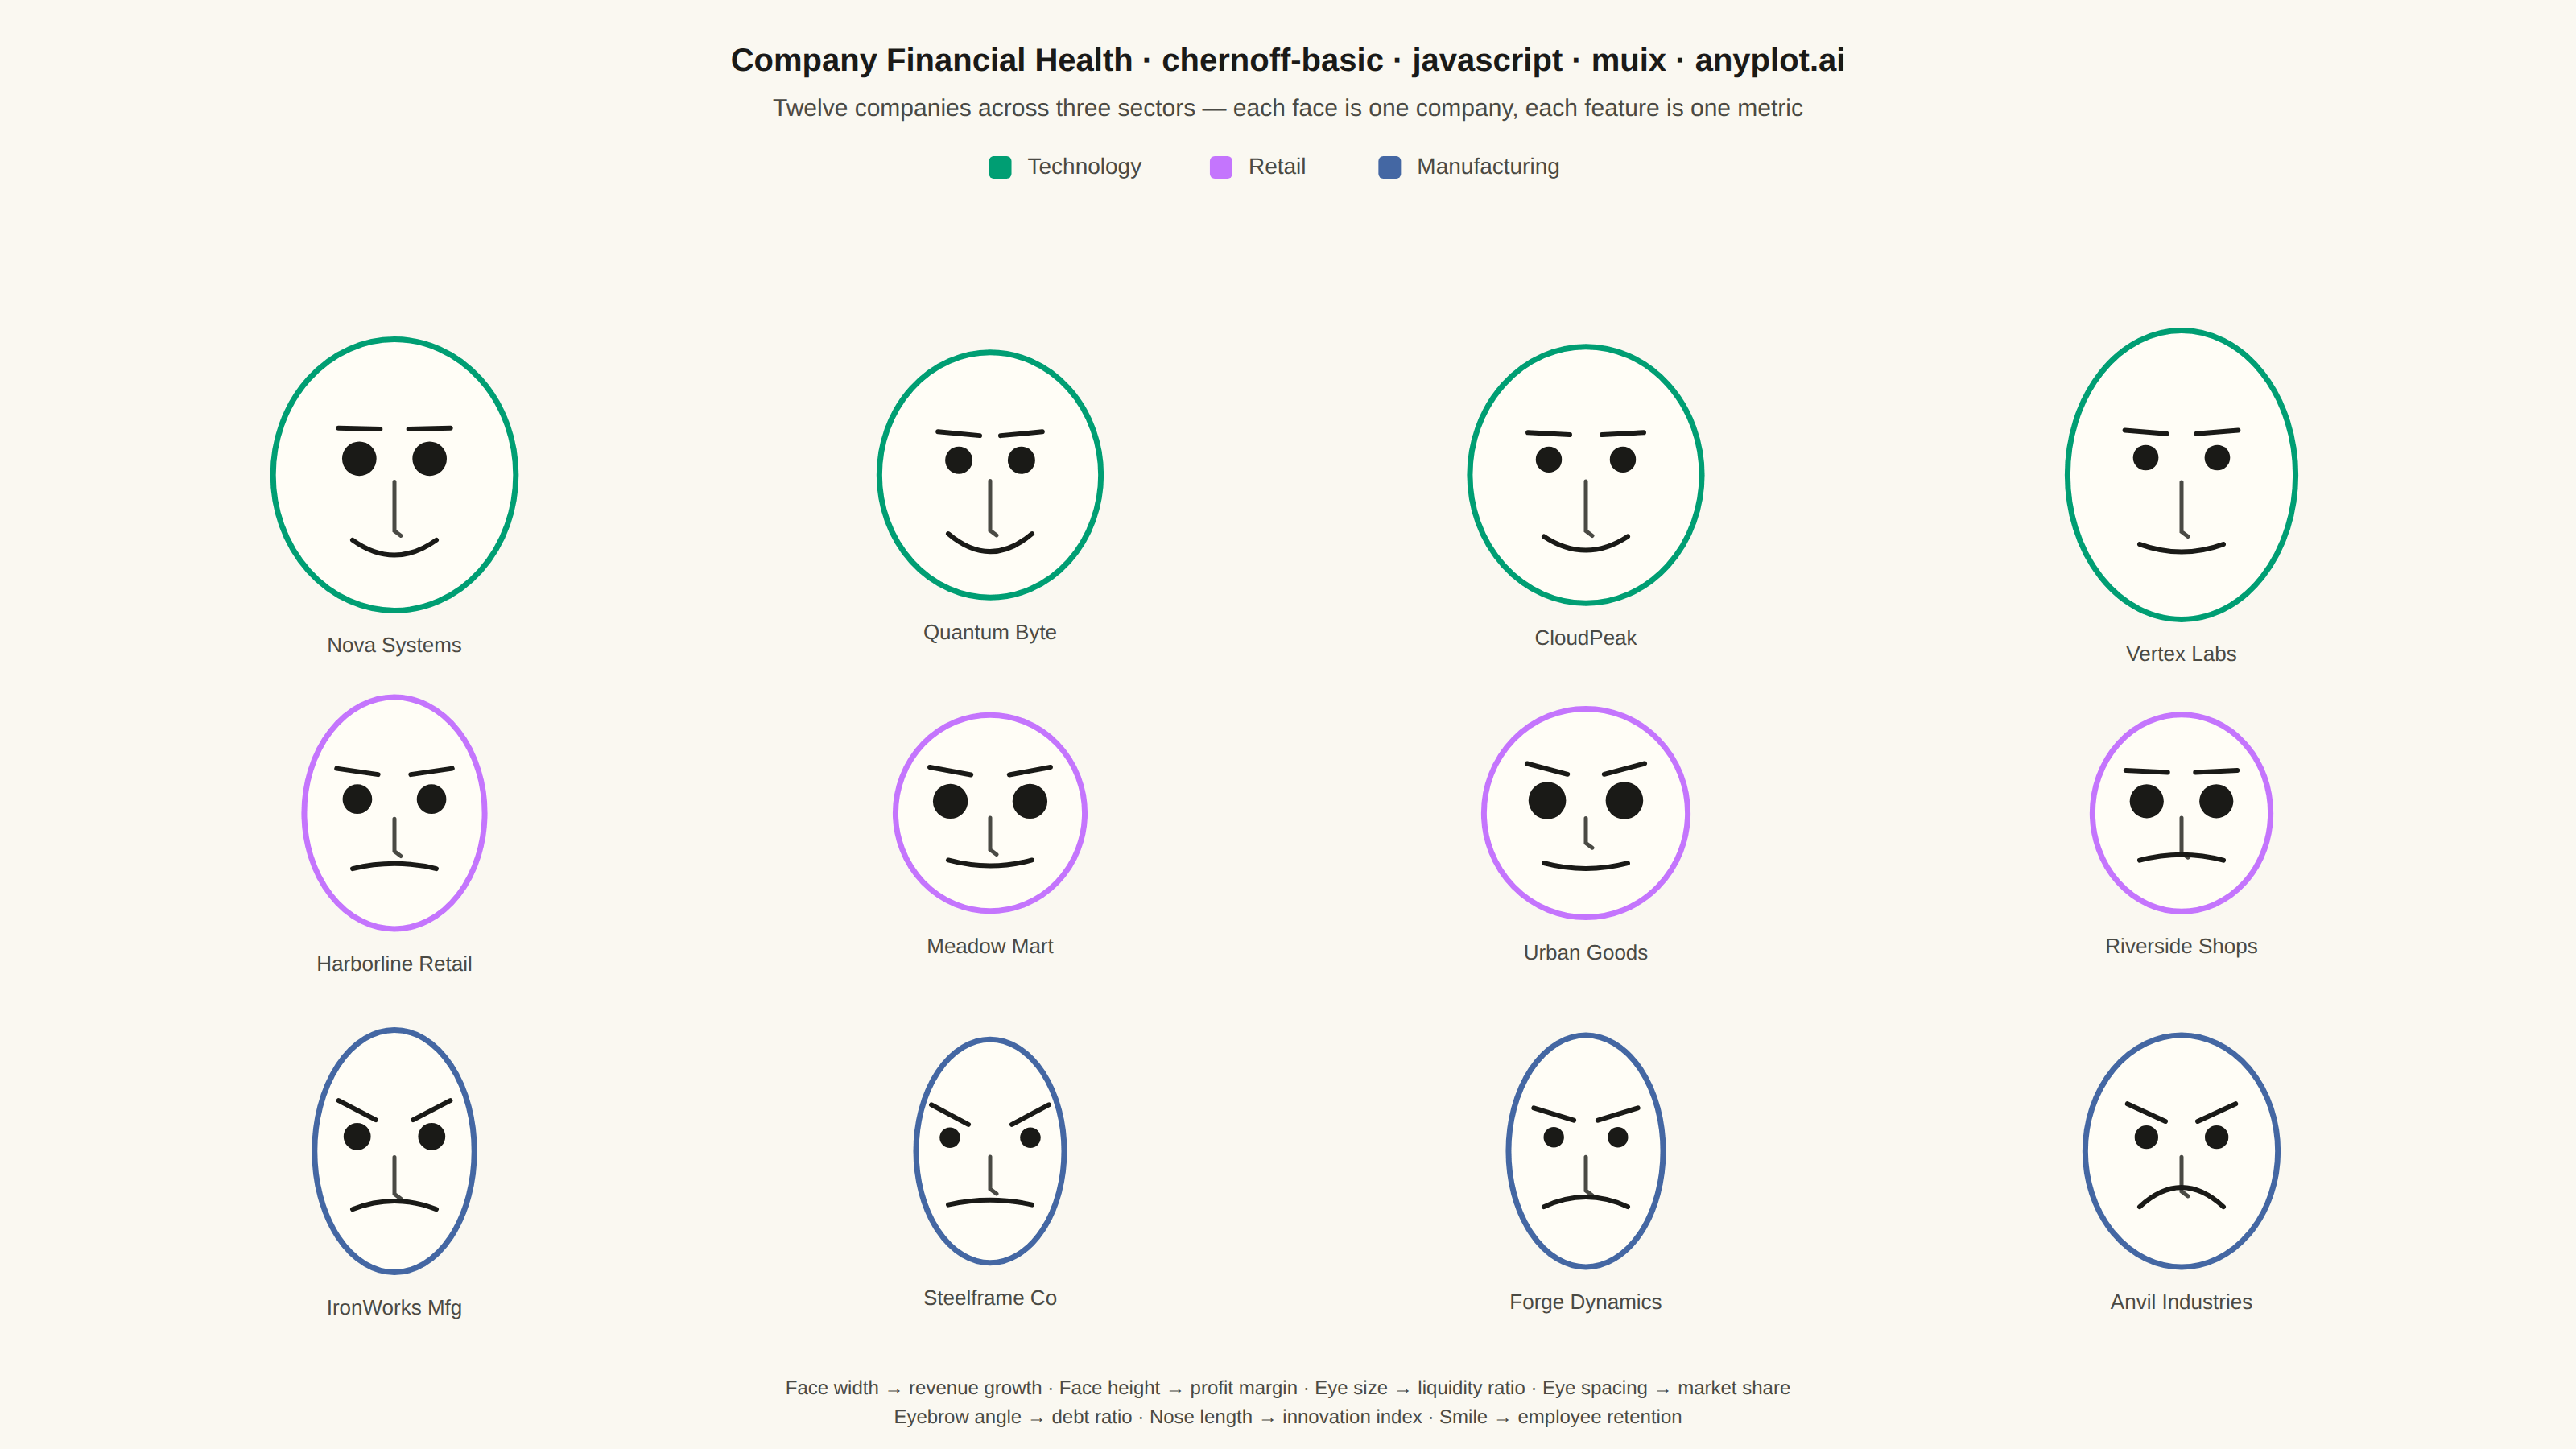
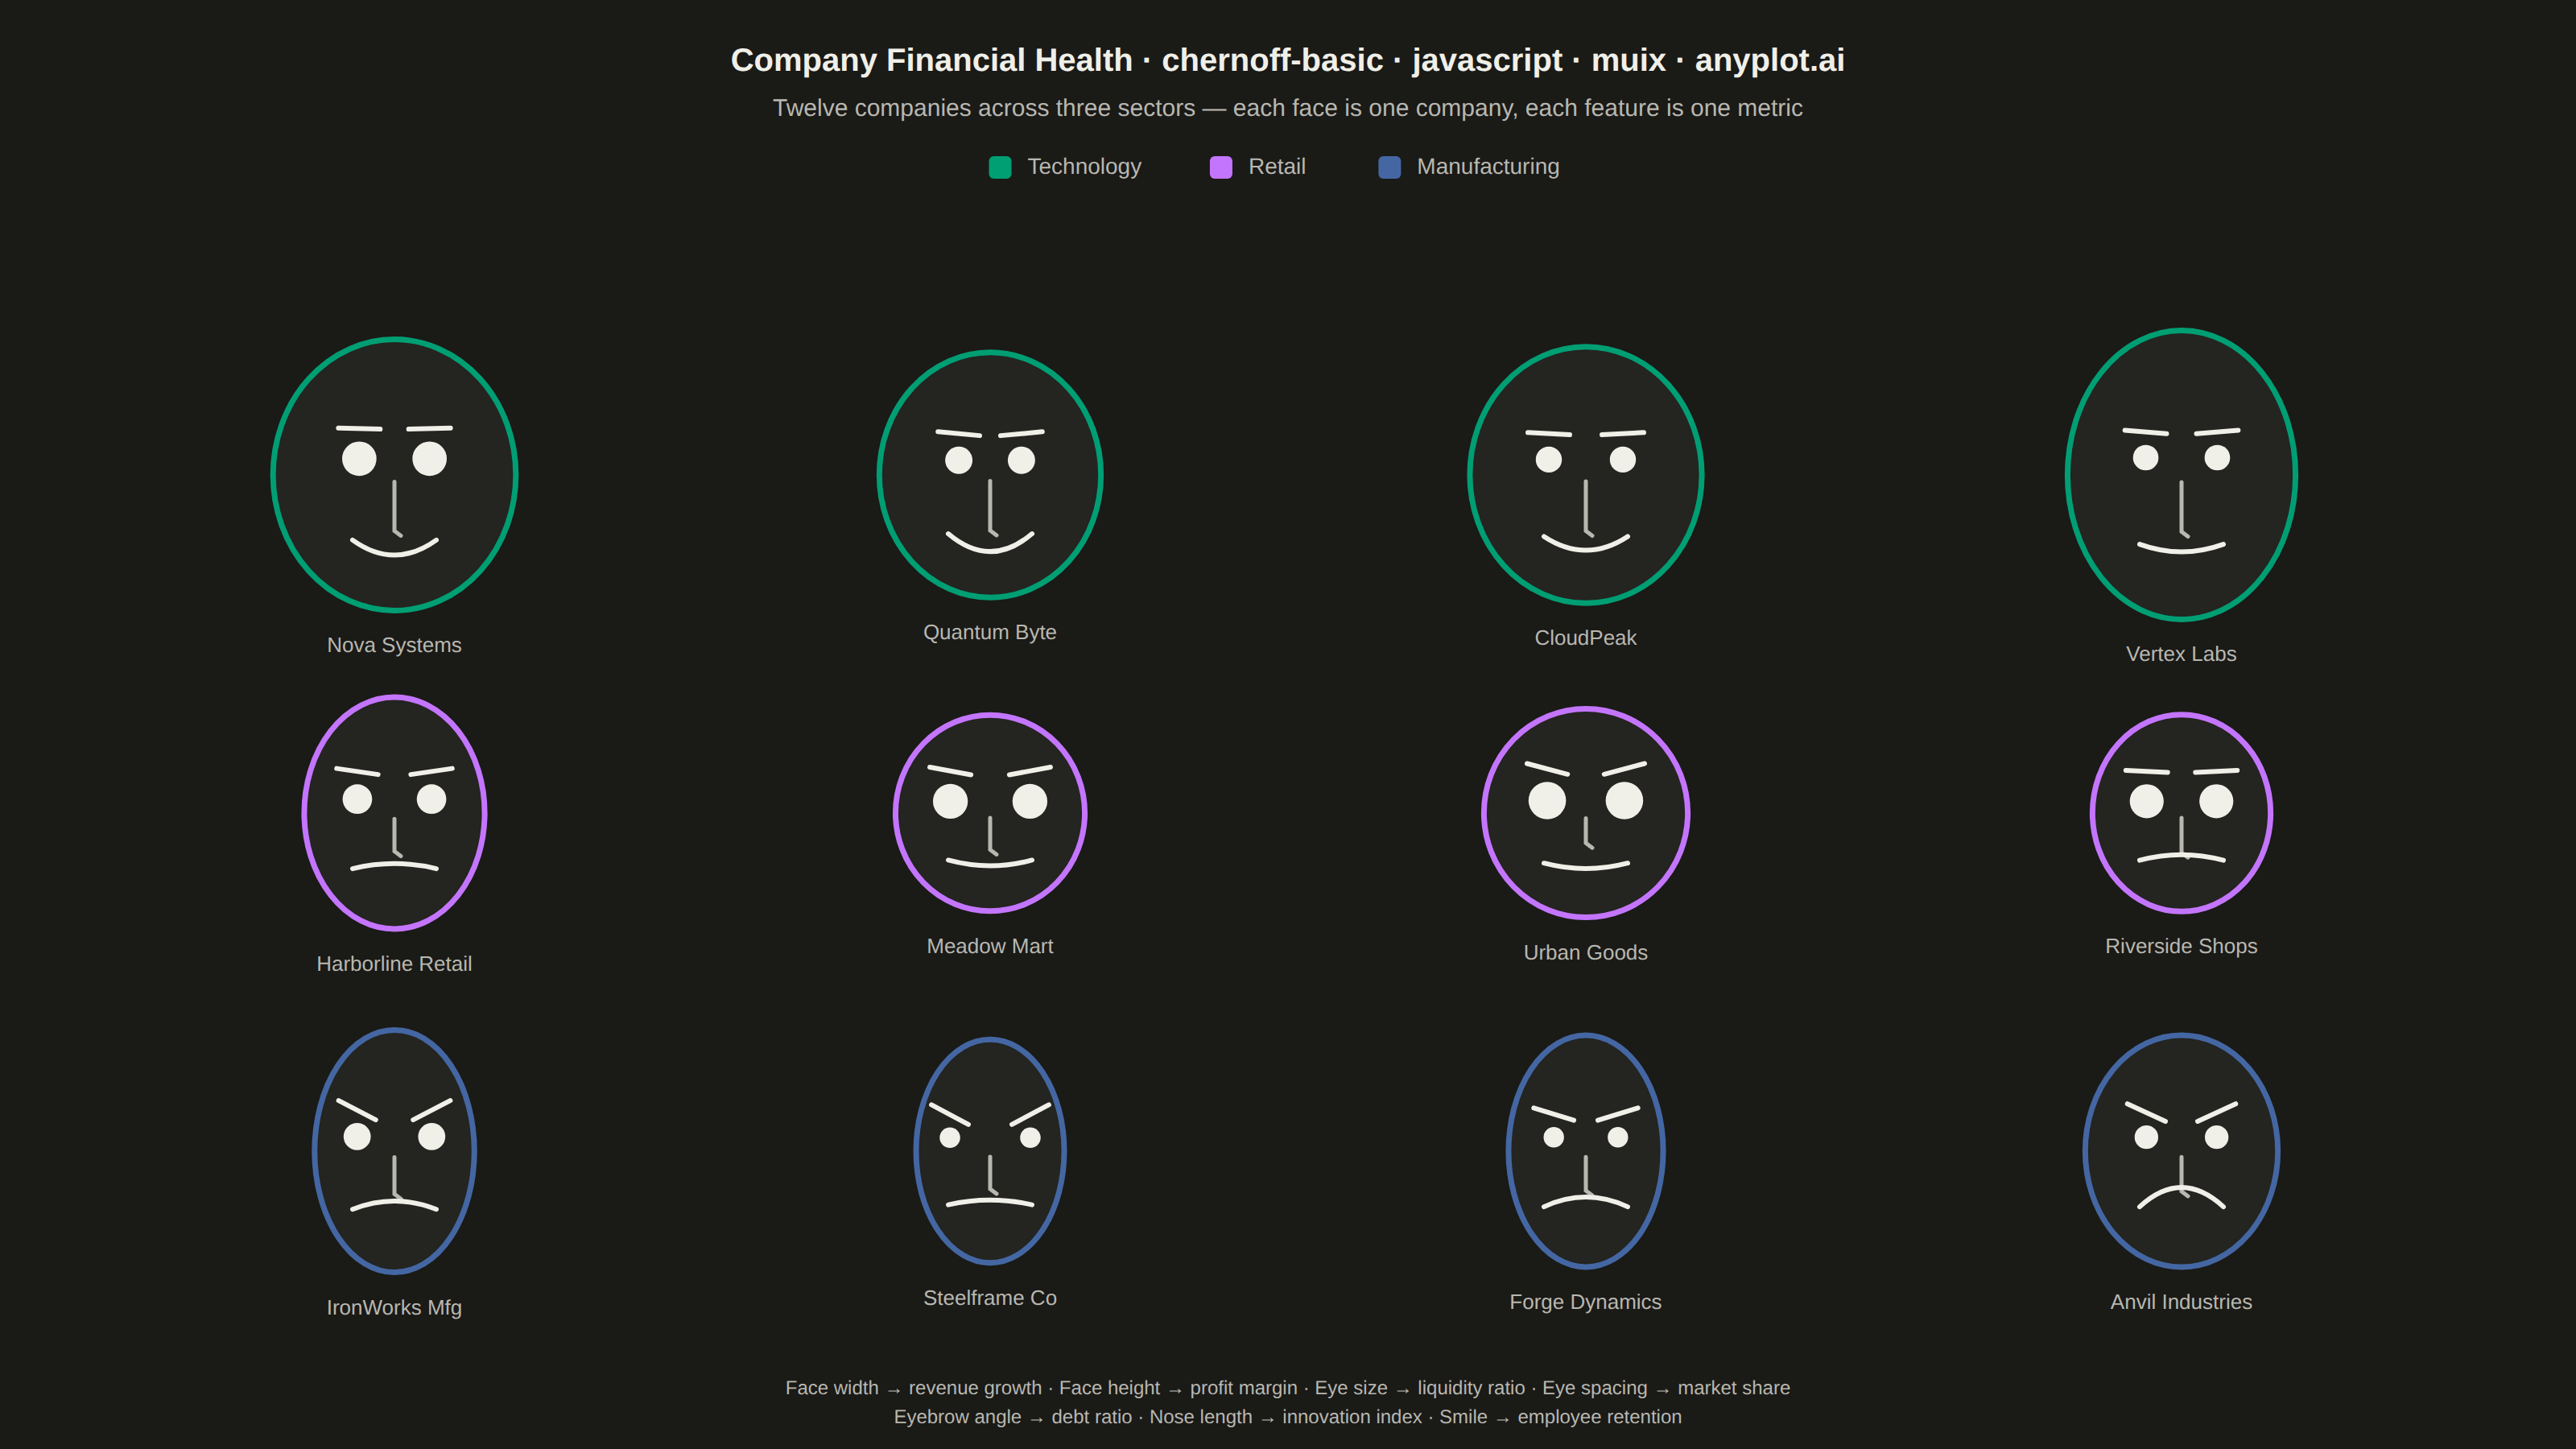
Chernoff faces visualize multivariate data by mapping each variable to a facial feature (eye size, mouth curvature, face width, nose length, etc.), transforming each observation into a unique cartoon face. This technique leverages humans' innate ability to recognize and distinguish faces, making it easier to identify patterns, clusters, and outliers across multiple dimensions simultaneously.
// anyplot.ai
// chernoff-basic: Chernoff Faces for Multivariate Data
// Library: muix 7.29.1 | JavaScript 22.23.2
// Quality: 90/100 | Created: 2026-09-02
import { ChartContainer } from "@mui/x-charts/ChartContainer";
import { useXScale, useYScale } from "@mui/x-charts/hooks";

const t = window.ANYPLOT_TOKENS;

const SPEC_TITLE = "Company Financial Health";
const TITLE = `${SPEC_TITLE} · chernoff-basic · javascript · muix · anyplot.ai`;
// Title fontsize scales linearly off the 67-char baseline (default 22px, floor 15px).
const TITLE_FONT_SIZE = Math.max(15, Math.round(22 * Math.min(1, 67 / TITLE.length)));
const SUBTITLE = "Twelve companies across three sectors — each face is one company, each feature is one metric";

// --- Data: 12 companies across 3 sectors, 7 metrics normalized to [0, 1] ----
// Small fixed-seed LCG — the browser has no seeded RNG.
let seed = 42;
function rand() {
  seed = (seed * 1103515245 + 12345) % 2147483648;
  return seed / 2147483648;
}
const clamp01 = (v) => Math.min(1, Math.max(0, v));
const jitter = () => (rand() - 0.5) * 0.44;

const SECTORS = ["Technology", "Retail", "Manufacturing"];

// Sector-level baselines that make the three rows read as distinct visual
// families before any per-company jitter is applied.
const SECTOR_PROFILE = {
  Technology: { revenueGrowth: 0.85, profitMargin: 0.65, liquidityRatio: 0.55, marketShare: 0.4, debtRatio: 0.15, innovationIndex: 0.9, employeeRetention: 0.85 },
  Retail: { revenueGrowth: 0.4, profitMargin: 0.28, liquidityRatio: 0.72, marketShare: 0.68, debtRatio: 0.45, innovationIndex: 0.28, employeeRetention: 0.48 },
  Manufacturing: { revenueGrowth: 0.22, profitMargin: 0.38, liquidityRatio: 0.32, marketShare: 0.55, debtRatio: 0.85, innovationIndex: 0.5, employeeRetention: 0.25 },
};

const COMPANIES = [
  { name: "Nova Systems", sector: "Technology" },
  { name: "Quantum Byte", sector: "Technology" },
  { name: "CloudPeak", sector: "Technology" },
  { name: "Vertex Labs", sector: "Technology" },
  { name: "Harborline Retail", sector: "Retail" },
  { name: "Meadow Mart", sector: "Retail" },
  { name: "Urban Goods", sector: "Retail" },
  { name: "Riverside Shops", sector: "Retail" },
  { name: "IronWorks Mfg", sector: "Manufacturing" },
  { name: "Steelframe Co", sector: "Manufacturing" },
  { name: "Forge Dynamics", sector: "Manufacturing" },
  { name: "Anvil Industries", sector: "Manufacturing" },
];

const METRIC_KEYS = ["revenueGrowth", "profitMargin", "liquidityRatio", "marketShare", "debtRatio", "innovationIndex", "employeeRetention"];

const faces = COMPANIES.map((c, i) => {
  const base = SECTOR_PROFILE[c.sector];
  const metrics = {};
  METRIC_KEYS.forEach((k) => {
    metrics[k] = clamp01(base[k] + jitter());
  });
  return {
    ...c,
    row: SECTORS.indexOf(c.sector),
    col: i % 4,
    metrics,
  };
});

// --- Facial feature mapping (documented, not arbitrary) ----------------------
// face width      <- revenueGrowth      face height   <- profitMargin
// eye size        <- liquidityRatio     eye spacing   <- marketShare
// eyebrow angle   <- debtRatio (higher debt -> more furrowed / worried brow)
// nose length     <- innovationIndex
// mouth curvature <- employeeRetention (higher retention -> bigger smile)
const FACE_RX = 62;
const FACE_RY = 78;
const EYE_R = 9;
const EYE_DX = 22;
const BROW_LEN = 26;
const NOSE_LEN = 22;
const MOUTH_HALF_W = 26;
const MOUTH_CURVE_MAX = 26;

function FaceGlyph({ face, cx, cy, color }) {
  const m = face.metrics;
  const rx = FACE_RX * (0.72 + 0.56 * m.revenueGrowth);
  const ry = FACE_RY * (0.75 + 0.5 * m.profitMargin);
  const eyeR = EYE_R * (0.6 + 0.8 * m.liquidityRatio);
  const eyeDx = EYE_DX * (0.7 + 0.6 * m.marketShare);
  const browAngle = -8 + 36 * m.debtRatio; // degrees; negative = relaxed/raised, positive = furrowed as debt rises
  const noseLen = NOSE_LEN * (0.6 + 0.8 * m.innovationIndex);
  const mouthCurve = (m.employeeRetention - 0.5) * 2 * MOUTH_CURVE_MAX; // + = smile, - = frown

  const eyeY = cy - ry * 0.12;
  const browY = eyeY - eyeR - 8;
  const noseY0 = cy + ry * 0.05;
  const noseY1 = noseY0 + noseLen;
  const mouthY = cy + ry * 0.48;

  return (
    <g>
      <ellipse cx={cx} cy={cy} rx={rx} ry={ry} fill={t.elevatedBg} stroke={color} strokeWidth={3.5} />
      <circle cx={cx - eyeDx} cy={eyeY} r={eyeR} fill={t.ink} />
      <circle cx={cx + eyeDx} cy={eyeY} r={eyeR} fill={t.ink} />
      <line x1={cx - eyeDx - BROW_LEN / 2} y1={browY} x2={cx - eyeDx + BROW_LEN / 2} y2={browY} stroke={t.ink} strokeWidth={3} strokeLinecap="round" transform={`rotate(${browAngle} ${cx - eyeDx} ${browY})`} />
      <line x1={cx + eyeDx - BROW_LEN / 2} y1={browY} x2={cx + eyeDx + BROW_LEN / 2} y2={browY} stroke={t.ink} strokeWidth={3} strokeLinecap="round" transform={`rotate(${-browAngle} ${cx + eyeDx} ${browY})`} />
      <path d={`M ${cx} ${noseY0} L ${cx} ${noseY1} L ${cx + 4} ${noseY1 + 3}`} fill="none" stroke={t.inkSoft} strokeWidth={2.5} strokeLinecap="round" />
      <path
        d={`M ${cx - MOUTH_HALF_W} ${mouthY} Q ${cx} ${mouthY + mouthCurve} ${cx + MOUTH_HALF_W} ${mouthY}`}
        fill="none"
        stroke={t.ink}
        strokeWidth={3}
        strokeLinecap="round"
      />
      <text x={cx} y={cy + ry + 26} textAnchor="middle" fontSize={13} fill={t.inkSoft}>
        {face.name}
      </text>
    </g>
  );
}

function FaceGrid() {
  const xs = useXScale();
  const ys = useYScale();
  return (
    <g>
      {faces.map((face) => (
        <FaceGlyph key={face.name} face={face} cx={xs(face.col + 0.5)} cy={ys(face.row + 0.5)} color={t.palette[face.row]} />
      ))}
    </g>
  );
}

function SectorLegend() {
  const { width } = window.ANYPLOT_SIZE;
  const swatch = 14;
  const gap = 10;
  const groupGap = 32;
  const fontSize = 14;
  const charW = fontSize * 0.58;
  const widths = SECTORS.map((s) => swatch + gap + s.length * charW);
  const totalWidth = widths.reduce((a, b) => a + b, 0) + groupGap * (SECTORS.length - 1);
  let x = width / 2 - totalWidth / 2;
  const y = 108;
  return (
    <g fontSize={fontSize} fill={t.inkSoft}>
      {SECTORS.map((s, i) => {
        const rectX = x;
        const labelX = rectX + swatch + gap;
        x += widths[i] + groupGap;
        return (
          <g key={s}>
            <rect x={rectX} y={y - swatch + 3} width={swatch} height={swatch} rx={3} fill={t.palette[i]} />
            <text x={labelX} y={y}>
              {s}
            </text>
          </g>
        );
      })}
    </g>
  );
}

function FeatureKey() {
  const { width, height } = window.ANYPLOT_SIZE;
  const lines = ["Face width → revenue growth · Face height → profit margin · Eye size → liquidity ratio · Eye spacing → market share", "Eyebrow angle → debt ratio · Nose length → innovation index · Smile → employee retention"];
  return (
    <g fontSize={12} fill={t.inkSoft} textAnchor="middle">
      {lines.map((line, i) => (
        <text key={line} x={width / 2} y={height - 34 + i * 18}>
          {line}
        </text>
      ))}
    </g>
  );
}

// --- Chart (default-exported component — the harness mounts it) -------------
export default function Chart() {
  const { width, height } = window.ANYPLOT_SIZE;
  const MARGIN = { top: 190, right: 60, bottom: 80, left: 60 };
  const cols = 4;
  const rows = SECTORS.length;

  return (
    <ChartContainer
      width={width}
      height={height}
      series={[]}
      margin={MARGIN}
      xAxis={[{ scaleType: "linear", min: 0, max: cols, disableLine: true, disableTicks: true, valueFormatter: () => "" }]}
      yAxis={[{ scaleType: "linear", min: 0, max: rows, reverse: true, disableLine: true, disableTicks: true, valueFormatter: () => "" }]}
      skipAnimation
    >
      <FaceGrid />
      <text x={width / 2} y={44} textAnchor="middle" fontSize={TITLE_FONT_SIZE} fontWeight={600} fill={t.ink}>
        {TITLE}
      </text>
      <text x={width / 2} y={72} textAnchor="middle" fontSize={15} fill={t.inkSoft}>
        {SUBTITLE}
      </text>
      <SectorLegend />
      <FeatureKey />
    </ChartContainer>
  );
}
Runnable source as JSON, for any HTTP client: https://api.anyplot.ai/specs/chernoff-basic/muix/code. Any spec id and library id listed in llms-full.txt fit the same URL shape; every URL below is complete and callable.
{
  "spec_id": "chernoff-basic",
  "language": "javascript",
  "library": "muix",
  "page": "https://anyplot.ai/chernoff-basic/javascript/muix",
  "hub": "https://anyplot.ai/chernoff-basic",
  "code_json": "https://api.anyplot.ai/specs/chernoff-basic/muix/code",
  "spec_json": "https://api.anyplot.ai/specs/chernoff-basic",
  "render_light_png": "https://storage.googleapis.com/anyplot-images/plots/chernoff-basic/javascript/muix/plot-light.png",
  "render_dark_png": "https://storage.googleapis.com/anyplot-images/plots/chernoff-basic/javascript/muix/plot-dark.png",
  "interactive_light_html": "https://storage.googleapis.com/anyplot-images/plots/chernoff-basic/javascript/muix/plot-light.html",
  "interactive_dark_html": "https://storage.googleapis.com/anyplot-images/plots/chernoff-basic/javascript/muix/plot-dark.html",
  "quality_score": 90.0,
  "license": "MIT",
  "guide": "https://anyplot.ai/llms.txt"
}
Part of Chernoff Faces for Multivariate Data on anyplot.ai.