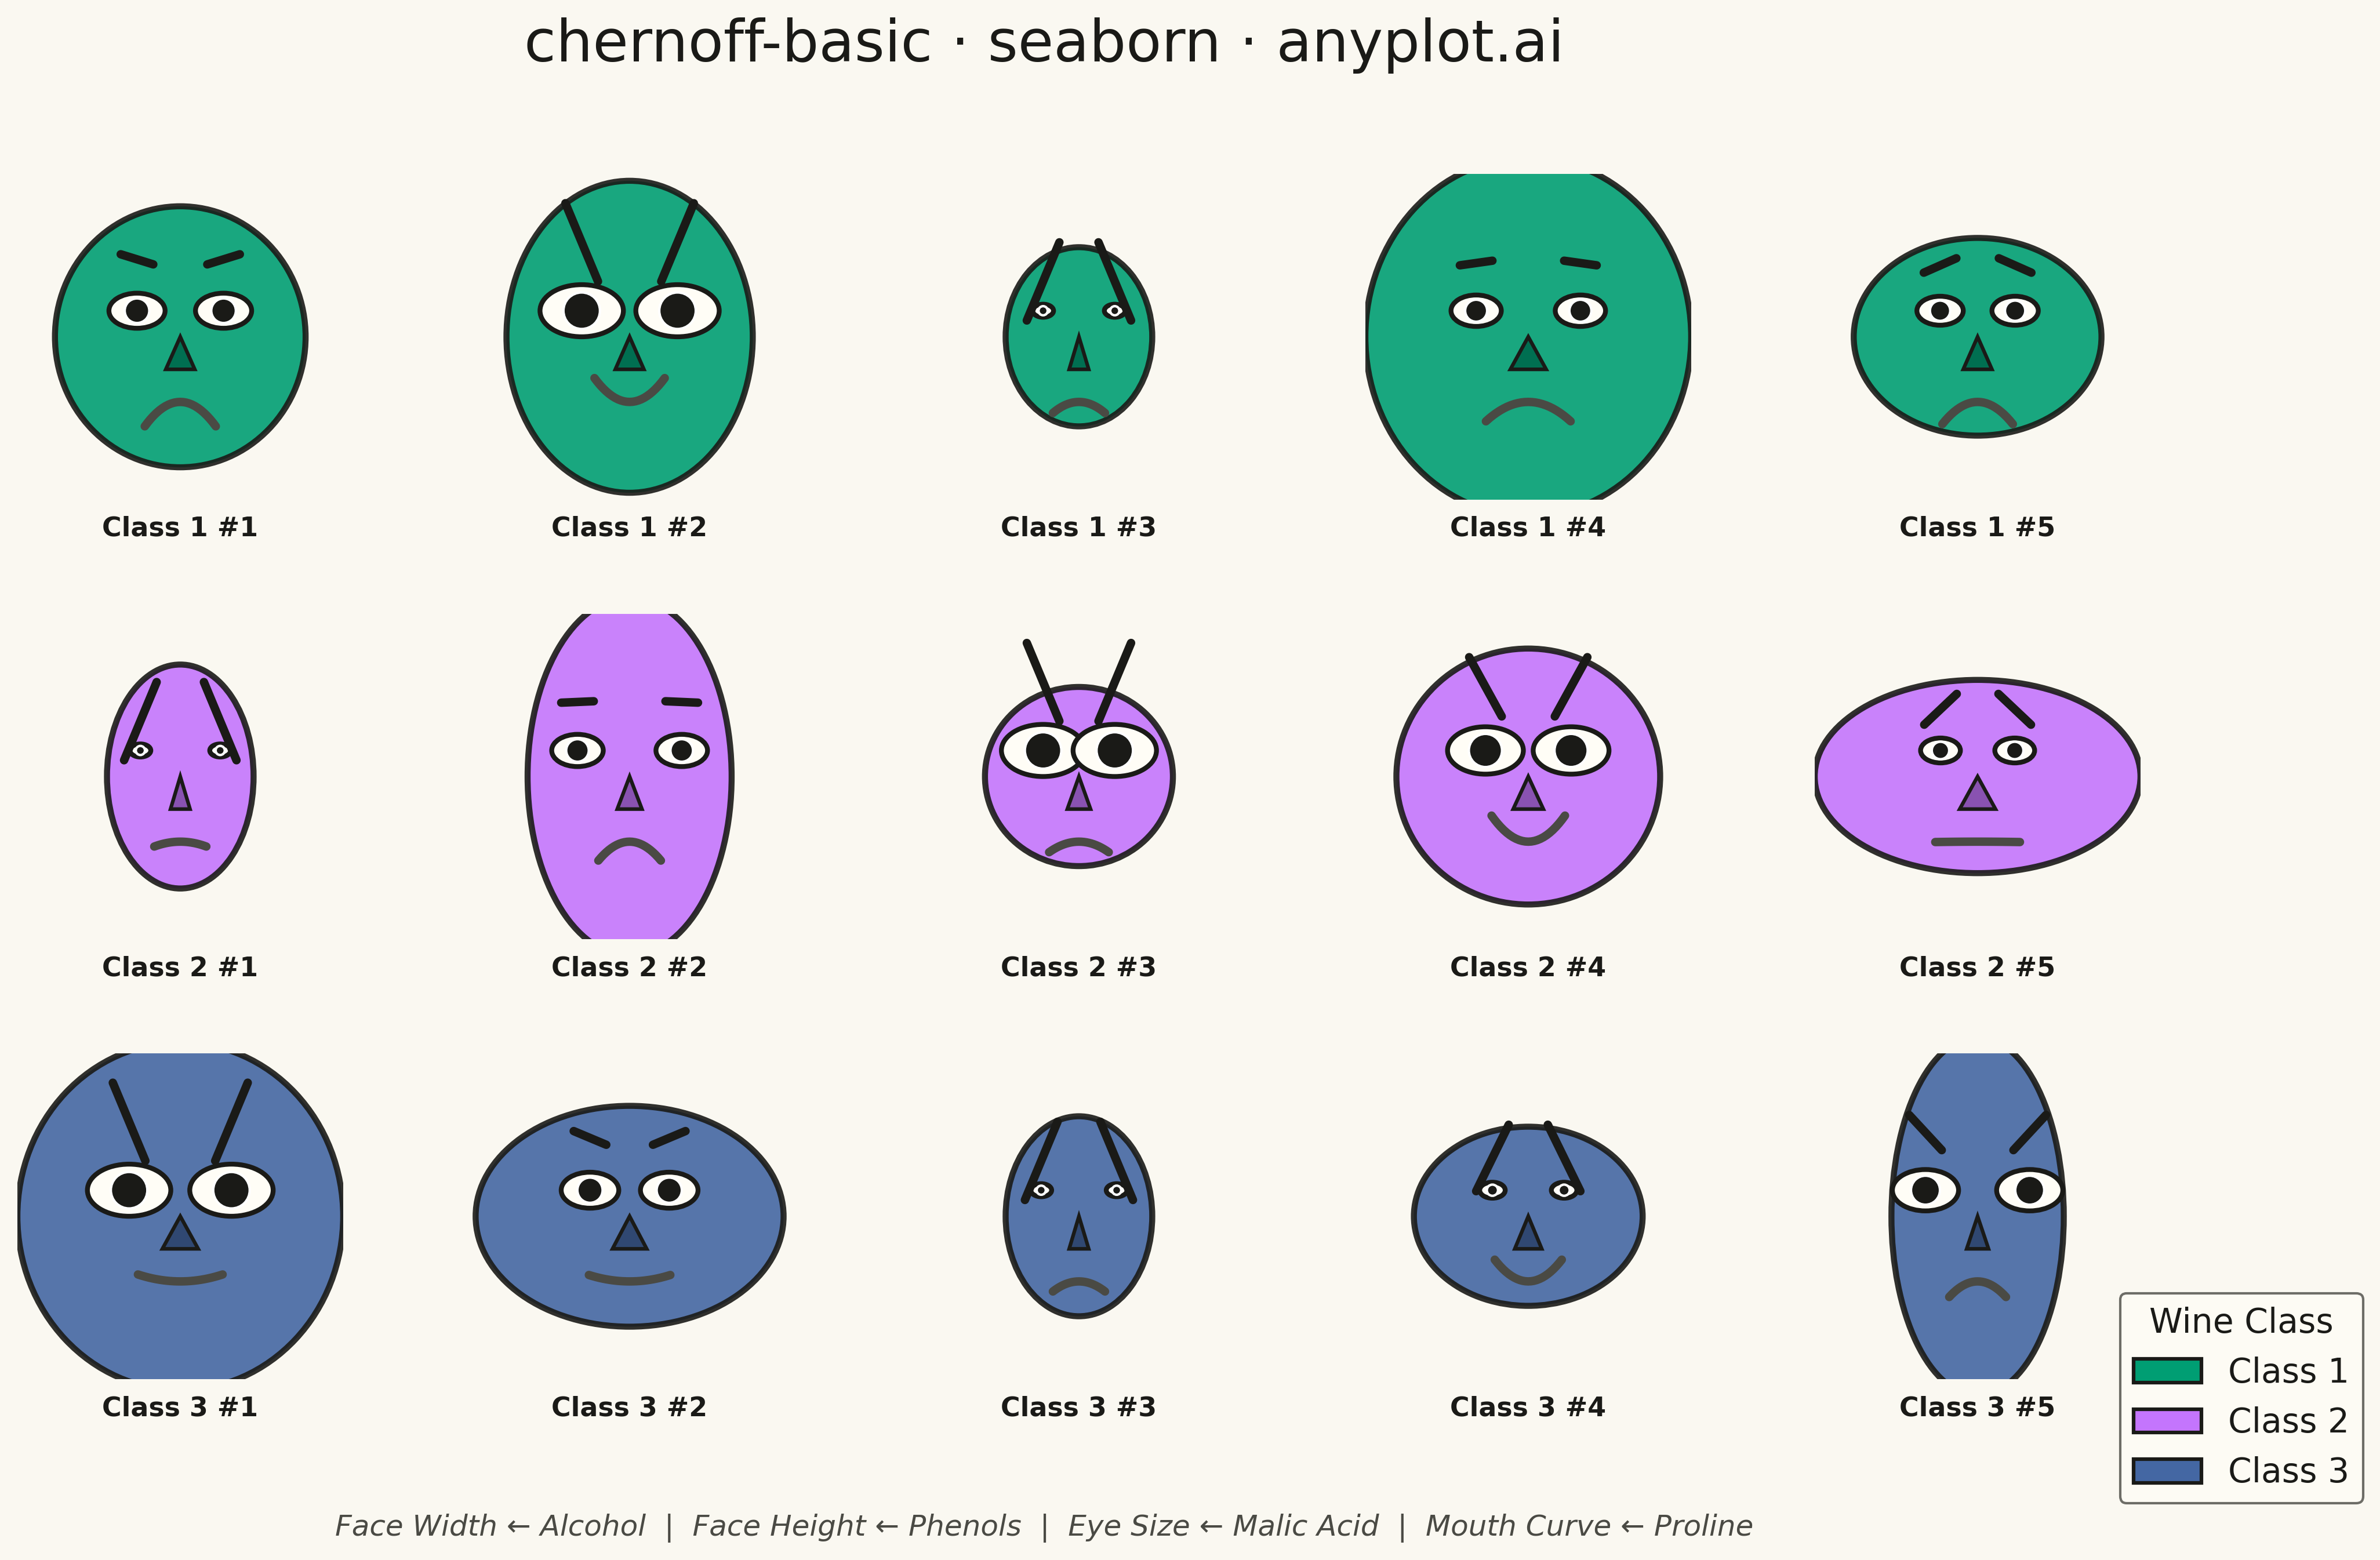
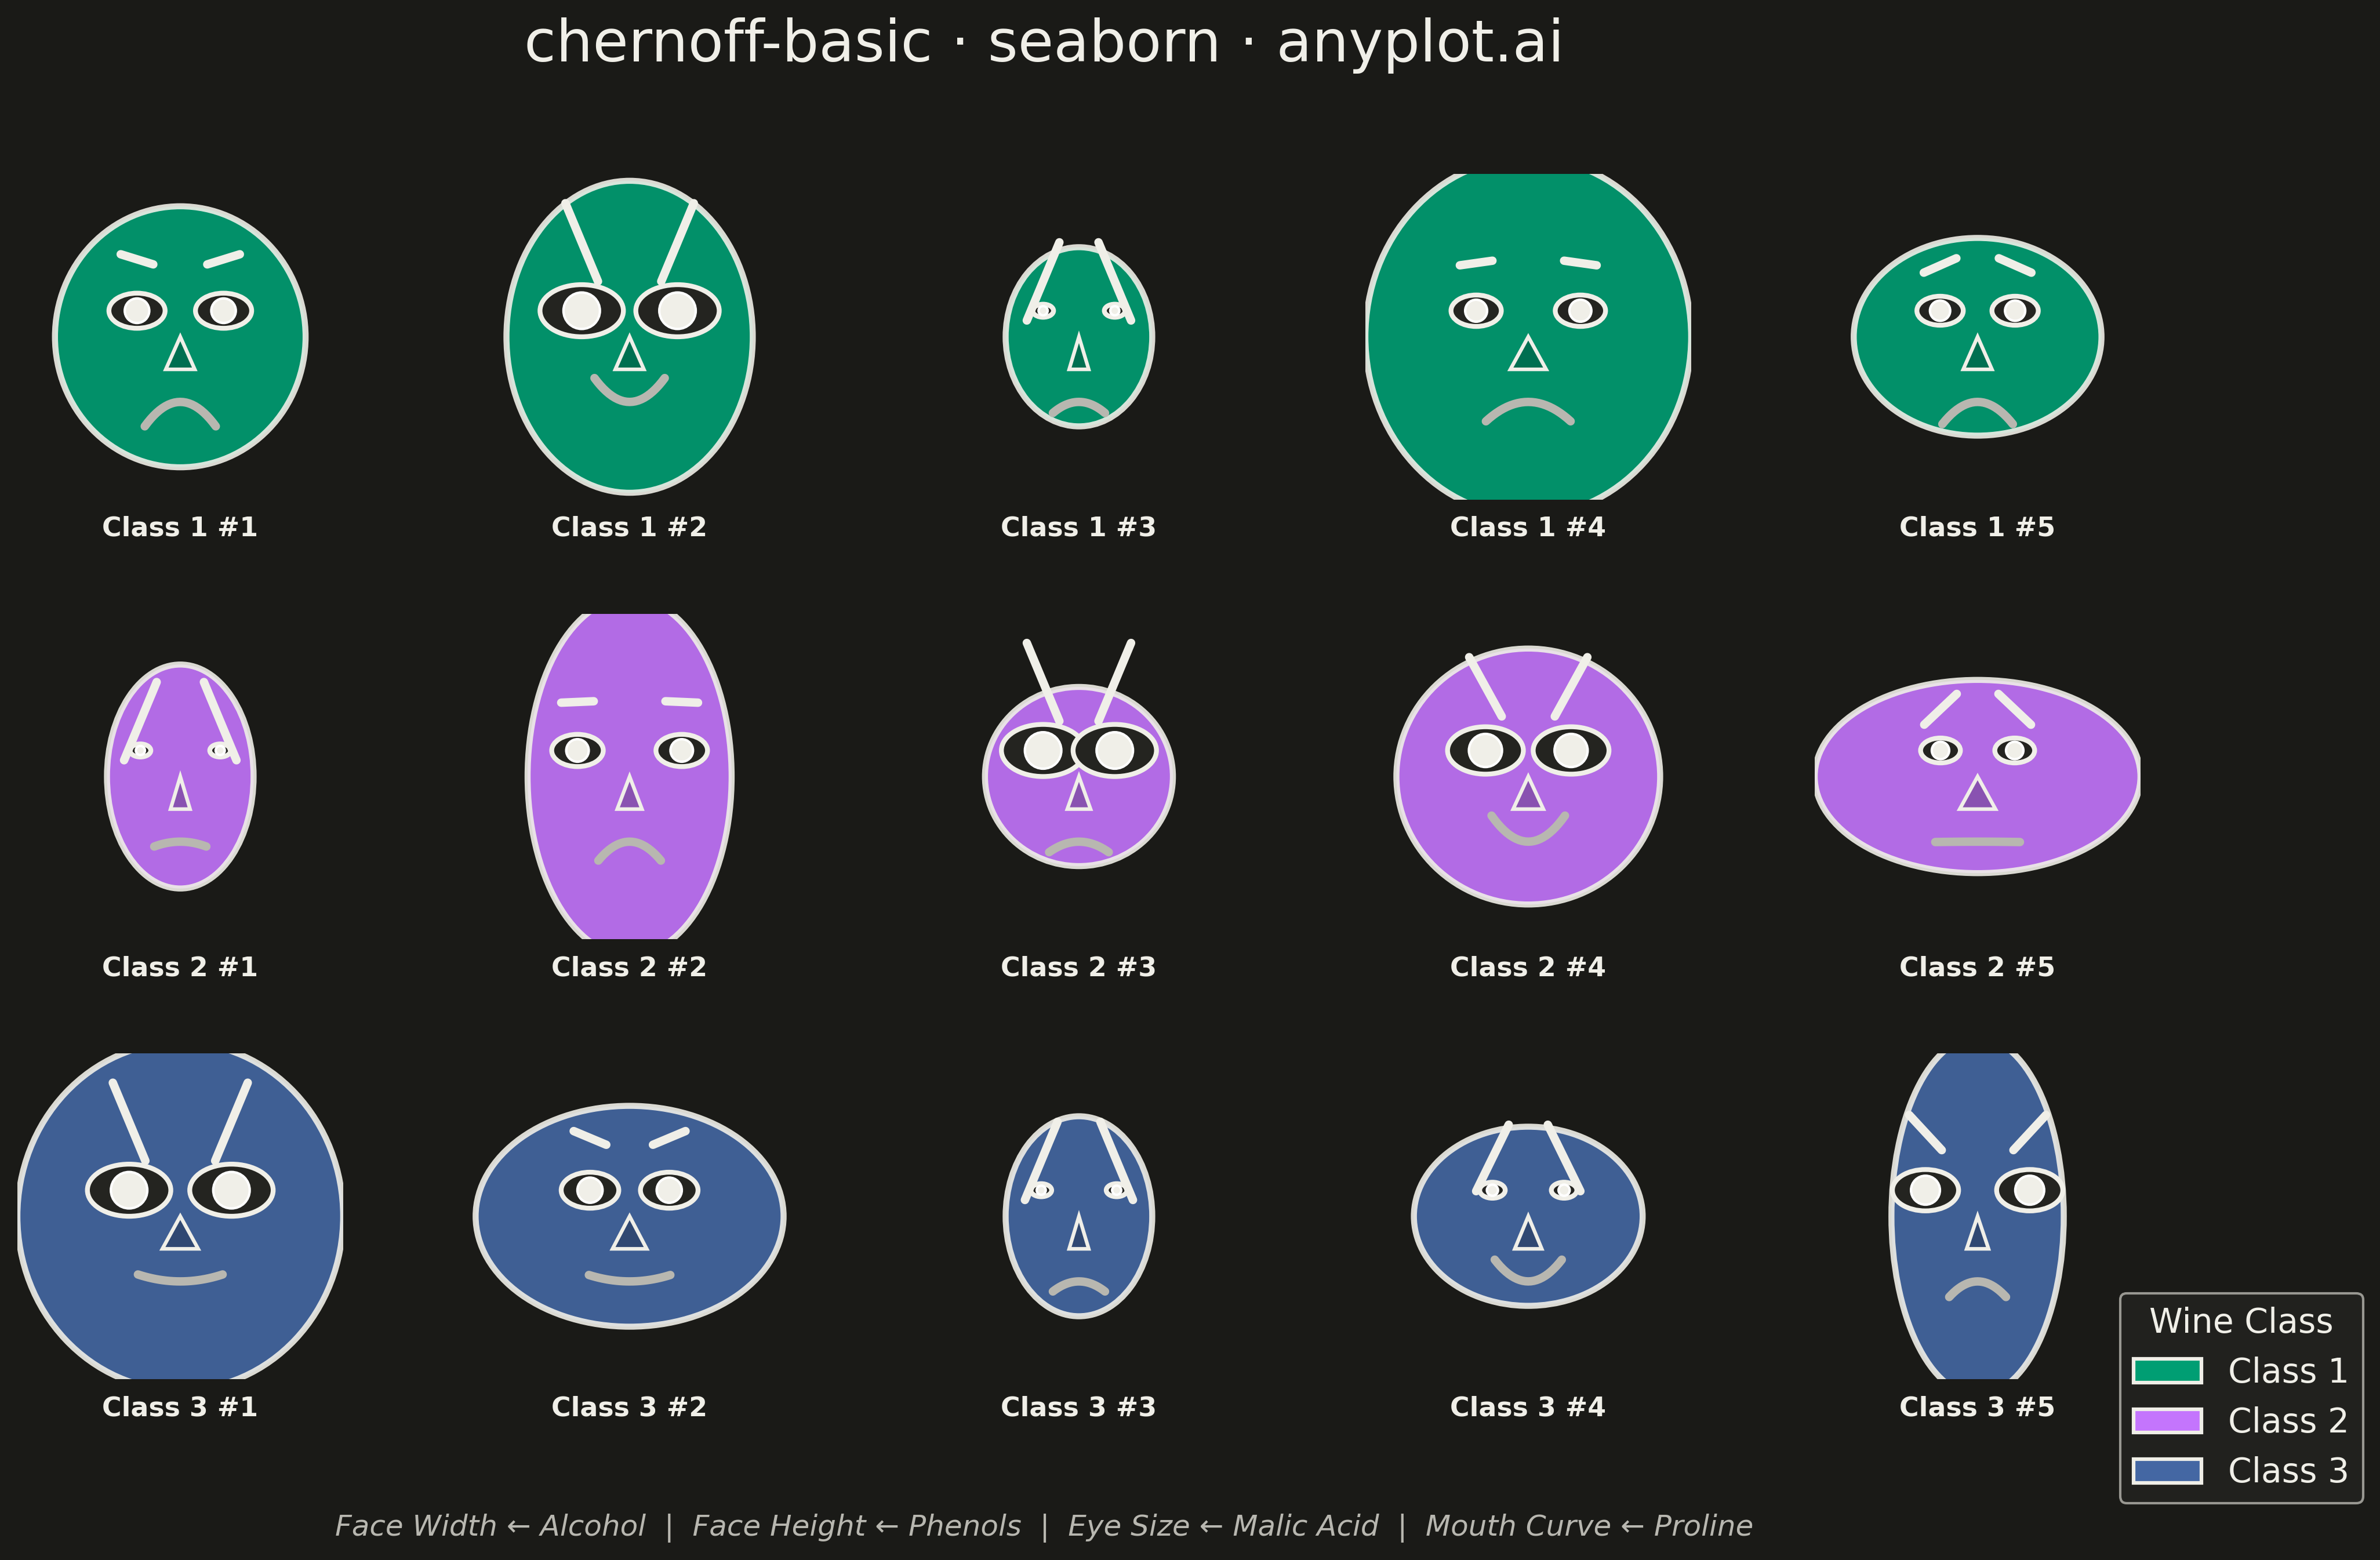
Chernoff faces visualize multivariate data by mapping each variable to a facial feature (eye size, mouth curvature, face width, nose length, etc.), transforming each observation into a unique cartoon face. This technique leverages humans' innate ability to recognize and distinguish faces, making it easier to identify patterns, clusters, and outliers across multiple dimensions simultaneously.
""" anyplot.ai
chernoff-basic: Chernoff Faces for Multivariate Data
Library: seaborn 0.13.2 | Python 3.13.13
Quality: 93/100 | Updated: 2026-05-15
"""

import os

import matplotlib.patches as mpatches
import matplotlib.pyplot as plt
import numpy as np
import seaborn as sns
from sklearn.datasets import load_wine


THEME = os.getenv("ANYPLOT_THEME", "light")
PAGE_BG = "#FAF8F1" if THEME == "light" else "#1A1A17"
ELEVATED_BG = "#FFFDF6" if THEME == "light" else "#242420"
INK = "#1A1A17" if THEME == "light" else "#F0EFE8"
INK_SOFT = "#4A4A44" if THEME == "light" else "#B8B7B0"
BRAND = "#009E73"

# Load wine dataset (13 chemical measurements per wine sample)
wine = load_wine()
feature_names = wine.feature_names
data = wine.data
target = wine.target

# Select 5 wines from each class (3 classes = 15 total)
np.random.seed(42)
indices = []
for cls in range(3):
    class_indices = np.where(target == cls)[0]
    selected = np.random.choice(class_indices, size=5, replace=False)
    indices.extend(selected)
indices = np.array(indices)

subset_data = data[indices]
subset_target = target[indices]
class_names = ["Class 1", "Class 2", "Class 3"]

# Select 4 key features for face mapping
selected_features = [0, 6, 9, 12]  # Alcohol, phenols, malic acid, proline
selected_feature_names = [feature_names[i].replace(" ", "\n") for i in selected_features]
data_subset = subset_data[:, selected_features]

# Within-species normalization for faces
normalized_data = np.zeros((15, 4))
for cls in range(3):
    class_mask = subset_target == cls
    class_subset = data_subset[class_mask]
    for feat_idx in range(4):
        feat_min = class_subset[:, feat_idx].min()
        feat_max = class_subset[:, feat_idx].max()
        feat_range = feat_max - feat_min if feat_max > feat_min else 1.0
        normalized_data[class_mask, feat_idx] = (class_subset[:, feat_idx] - feat_min) / feat_range

# Set seaborn theme
sns.set_style("white")
sns.set_context("poster", font_scale=1.0)
sns.set_theme(
    rc={
        "figure.facecolor": PAGE_BG,
        "axes.facecolor": PAGE_BG,
        "text.color": INK,
        "axes.labelcolor": INK,
        "xtick.color": INK_SOFT,
        "ytick.color": INK_SOFT,
    }
)

# Okabe-Ito palette - first series is always brand green
okabe_ito = [BRAND, "#C475FD", "#4467A3"]
face_colors = [okabe_ito[t] for t in subset_target]

# Create figure
fig = plt.figure(figsize=(16, 9), facecolor=PAGE_BG)

# Grid layout: faces only (3 rows x 5 cols)
gs = fig.add_gridspec(3, 5, hspace=0.35, wspace=0.25)


def hex_to_rgb(h):
    return tuple(int(h.lstrip("#")[i : i + 2], 16) / 255.0 for i in (0, 2, 4))


# Draw Chernoff faces
for idx in range(15):
    row = idx // 5
    col = idx % 5
    ax = fig.add_subplot(gs[row, col])

    features = normalized_data[idx]
    color = face_colors[idx]

    # Map features to facial characteristics
    # Feature 0 (alcohol): face width
    # Feature 1 (phenols): face height
    # Feature 2 (malic acid): eye size
    # Feature 3 (proline): mouth curvature

    face_width = 0.45 + features[0] * 0.55
    face_height = 0.55 + features[1] * 0.55
    eye_size = 0.04 + features[2] * 0.12
    mouth_curve = -0.35 + features[3] * 0.7

    # Draw face outline
    face = mpatches.Ellipse(
        (0.5, 0.5), face_width, face_height, facecolor=color, edgecolor=INK, linewidth=2.5, alpha=0.9
    )
    ax.add_patch(face)

    # Draw eyes
    eye_y = 0.58
    eye_spacing = 0.11 + features[1] * 0.05

    # Left eye
    left_eye = mpatches.Ellipse(
        (0.5 - eye_spacing, eye_y), eye_size * 1.6, eye_size, facecolor=ELEVATED_BG, edgecolor=INK, linewidth=2
    )
    ax.add_patch(left_eye)
    left_pupil = mpatches.Circle((0.5 - eye_spacing, eye_y), eye_size * 0.35, facecolor=INK)
    ax.add_patch(left_pupil)

    # Right eye
    right_eye = mpatches.Ellipse(
        (0.5 + eye_spacing, eye_y), eye_size * 1.6, eye_size, facecolor=ELEVATED_BG, edgecolor=INK, linewidth=2
    )
    ax.add_patch(right_eye)
    right_pupil = mpatches.Circle((0.5 + eye_spacing, eye_y), eye_size * 0.35, facecolor=INK)
    ax.add_patch(right_pupil)

    # Draw eyebrows
    eyebrow_angle = -0.12 + features[2] * 0.24
    eyebrow_y = eye_y + eye_size + 0.05

    ax.plot(
        [0.5 - eye_spacing - 0.05, 0.5 - eye_spacing + 0.05],
        [eyebrow_y + eyebrow_angle, eyebrow_y - eyebrow_angle],
        color=INK,
        linewidth=3.5,
        solid_capstyle="round",
    )
    ax.plot(
        [0.5 + eye_spacing - 0.05, 0.5 + eye_spacing + 0.05],
        [eyebrow_y - eyebrow_angle, eyebrow_y + eyebrow_angle],
        color=INK,
        linewidth=3.5,
        solid_capstyle="round",
    )

    # Draw nose
    nose_size = 0.03 + features[0] * 0.025
    color_rgb = hex_to_rgb(color)
    nose_color = tuple(c * 0.7 for c in color_rgb)
    nose = mpatches.Polygon(
        [[0.5, 0.50], [0.5 - nose_size, 0.40], [0.5 + nose_size, 0.40]],
        facecolor=nose_color,
        edgecolor=INK,
        linewidth=1.5,
    )
    ax.add_patch(nose)

    # Draw mouth
    mouth_width = 0.08 + features[0] * 0.05
    mouth_x = np.linspace(0.5 - mouth_width, 0.5 + mouth_width, 25)
    mouth_y = 0.30 + mouth_curve * ((mouth_x - 0.5) ** 2) * 18
    ax.plot(mouth_x, mouth_y, color=INK_SOFT, linewidth=3.5, solid_capstyle="round")

    # Set axis properties
    ax.set_xlim(0, 1)
    ax.set_ylim(0, 1)
    ax.set_aspect("equal")
    ax.axis("off")

    # Add label below face
    class_idx = subset_target[idx]
    sample_num = (idx % 5) + 1
    ax.text(
        0.5,
        -0.05,
        f"{class_names[class_idx]} #{sample_num}",
        ha="center",
        va="top",
        fontsize=11,
        fontweight="bold",
        color=INK,
    )

# Add overall title
fig.suptitle("chernoff-basic · seaborn · anyplot.ai", fontsize=24, fontweight="medium", y=0.98, color=INK)

# Add legend for classes
legend_handles = [mpatches.Patch(color=okabe_ito[i], label=class_names[i], ec=INK, lw=1.5) for i in range(3)]
fig.legend(
    handles=legend_handles,
    loc="lower right",
    fontsize=14,
    frameon=True,
    bbox_to_anchor=(0.98, 0.02),
    title="Wine Class",
    facecolor=ELEVATED_BG,
    edgecolor=INK_SOFT,
    title_fontsize=14,
)

# Add feature mapping explanation
feature_text = "Face Width ← Alcohol  |  Face Height ← Phenols  |  Eye Size ← Malic Acid  |  Mouth Curve ← Proline"
fig.text(0.5, 0.01, feature_text, ha="center", fontsize=12, style="italic", color=INK_SOFT)

plt.savefig(f"plot-{THEME}.png", dpi=300, bbox_inches="tight", facecolor=PAGE_BG)
Runnable source as JSON, for any HTTP client: https://api.anyplot.ai/specs/chernoff-basic/seaborn/code. Any spec id and library id listed in llms-full.txt fit the same URL shape; every URL below is complete and callable.
{
  "spec_id": "chernoff-basic",
  "language": "python",
  "library": "seaborn",
  "page": "https://anyplot.ai/chernoff-basic/python/seaborn",
  "hub": "https://anyplot.ai/chernoff-basic",
  "code_json": "https://api.anyplot.ai/specs/chernoff-basic/seaborn/code",
  "spec_json": "https://api.anyplot.ai/specs/chernoff-basic",
  "render_light_png": "https://storage.googleapis.com/anyplot-images/plots/chernoff-basic/python/seaborn/plot-light.png",
  "render_dark_png": "https://storage.googleapis.com/anyplot-images/plots/chernoff-basic/python/seaborn/plot-dark.png",
  "quality_score": 93.0,
  "license": "MIT",
  "guide": "https://anyplot.ai/llms.txt"
}
Part of Chernoff Faces for Multivariate Data on anyplot.ai.