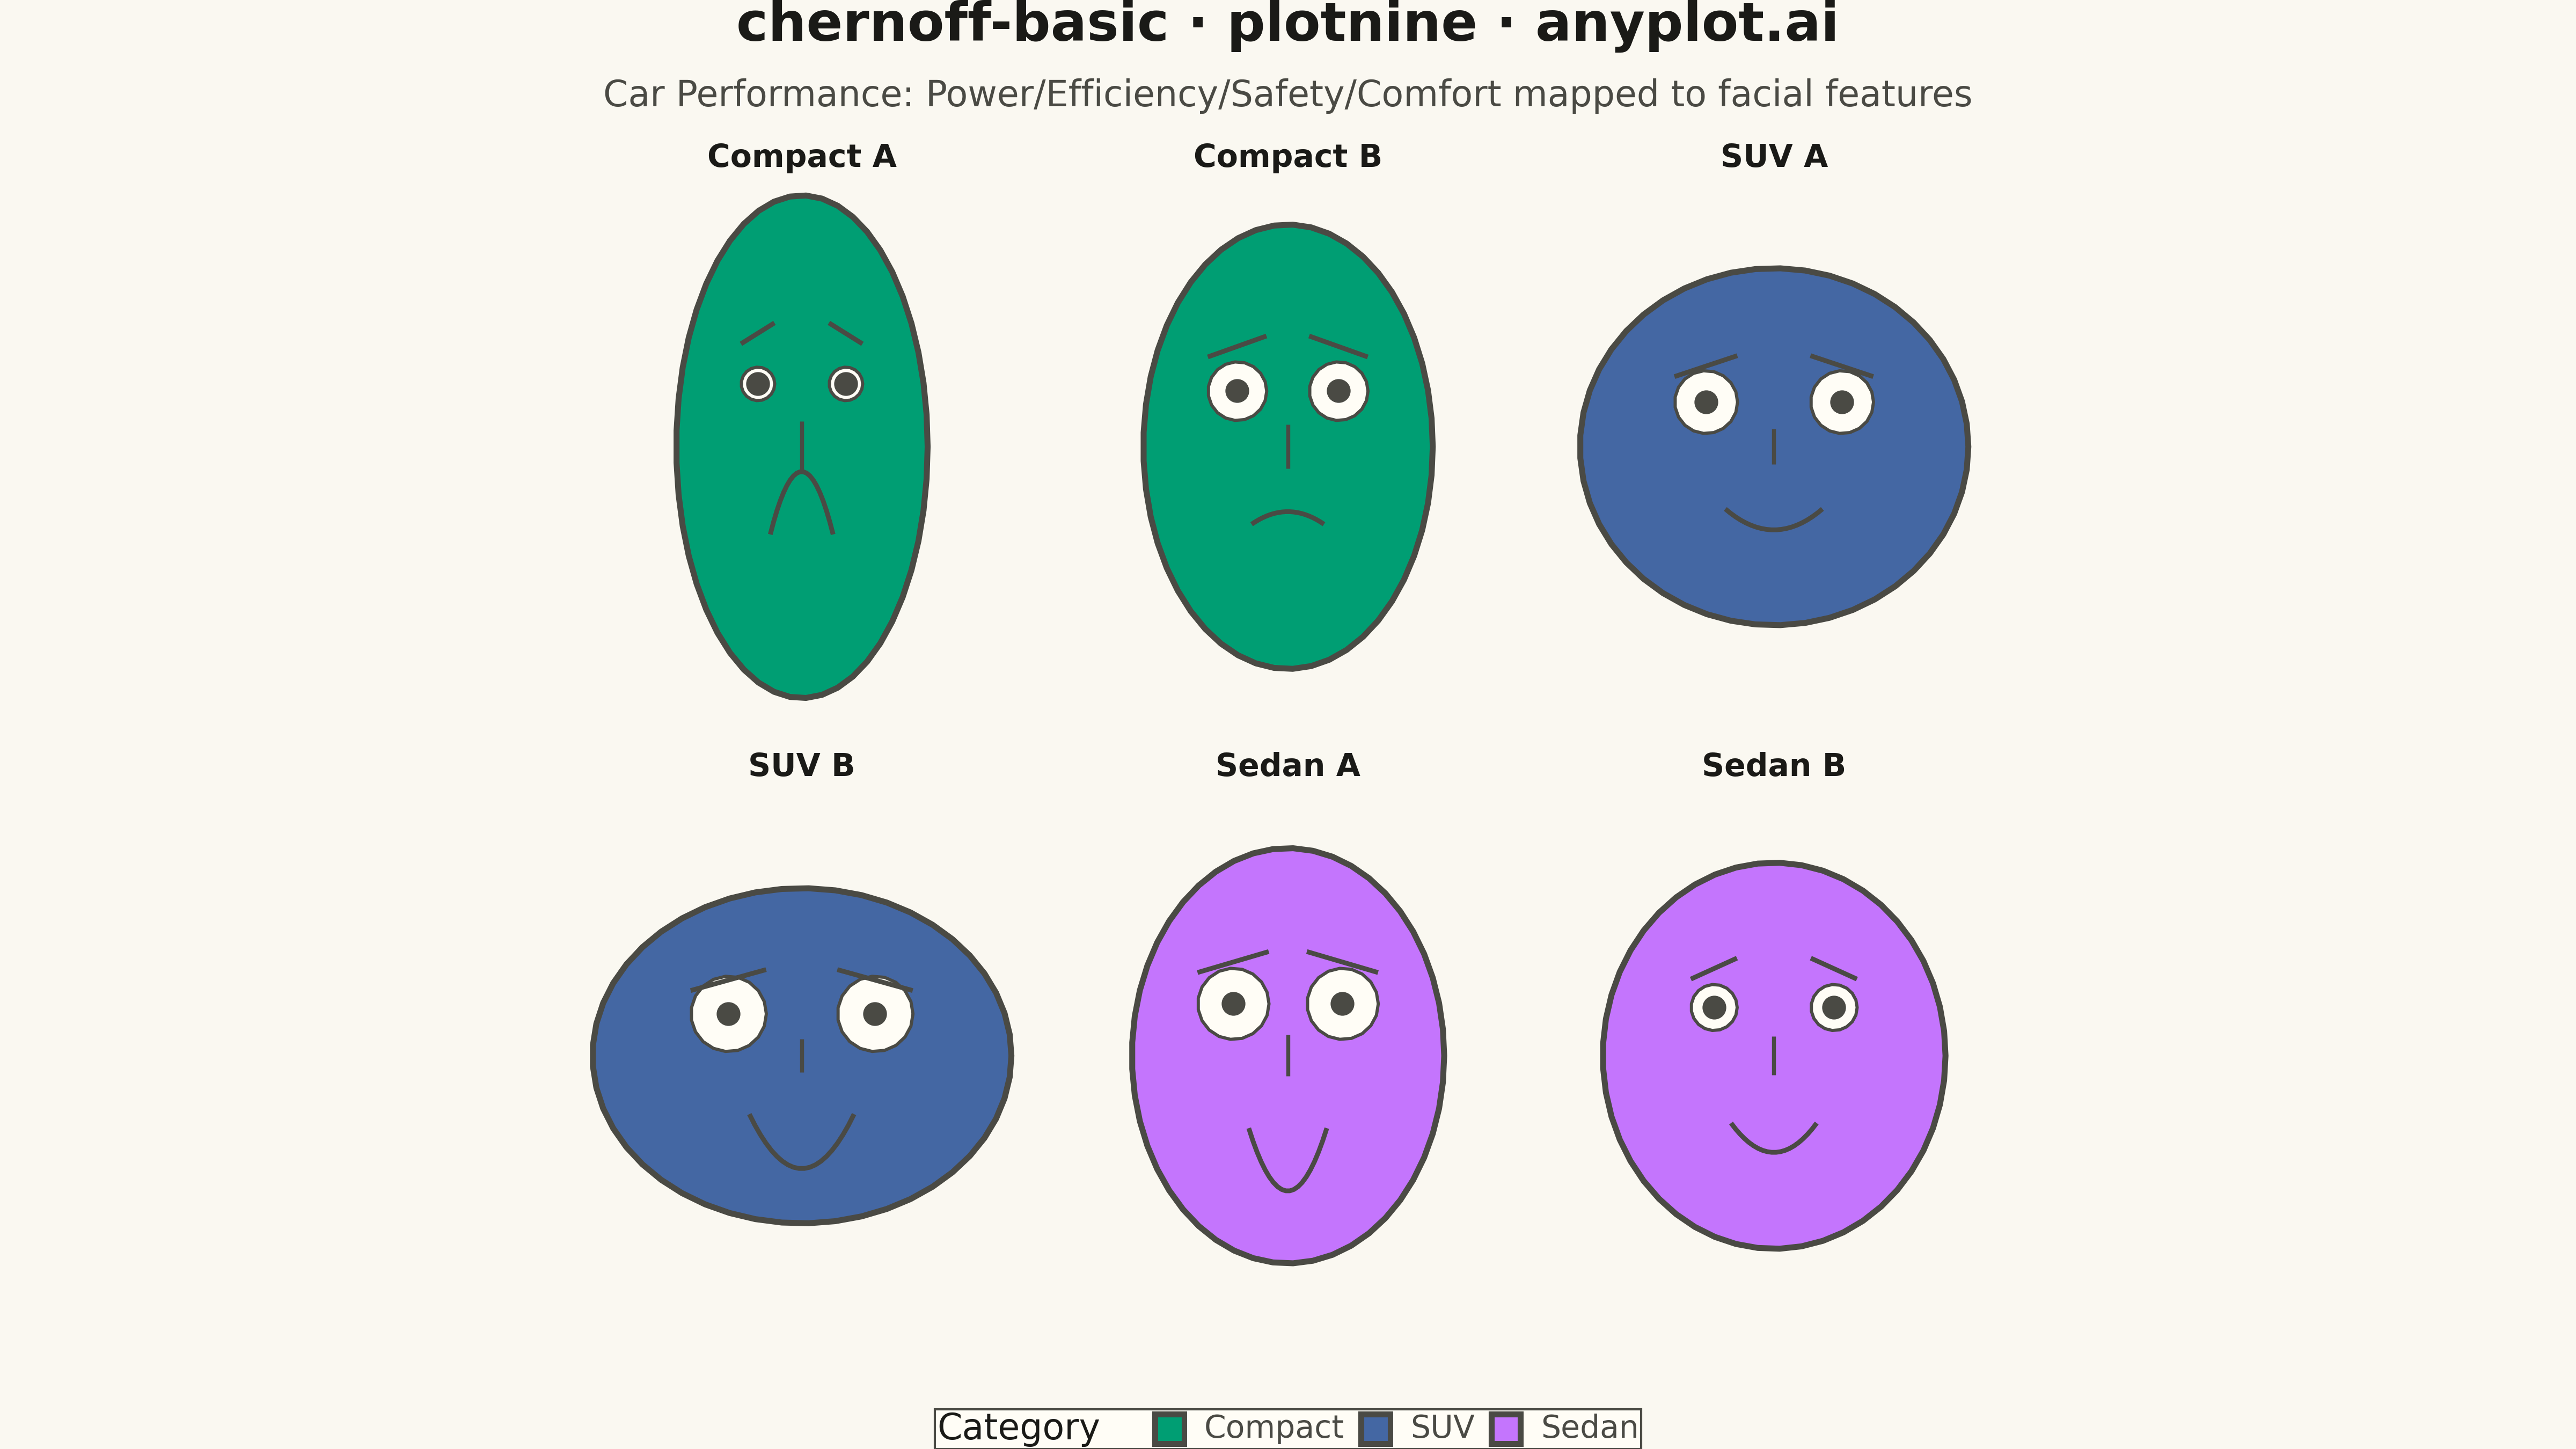
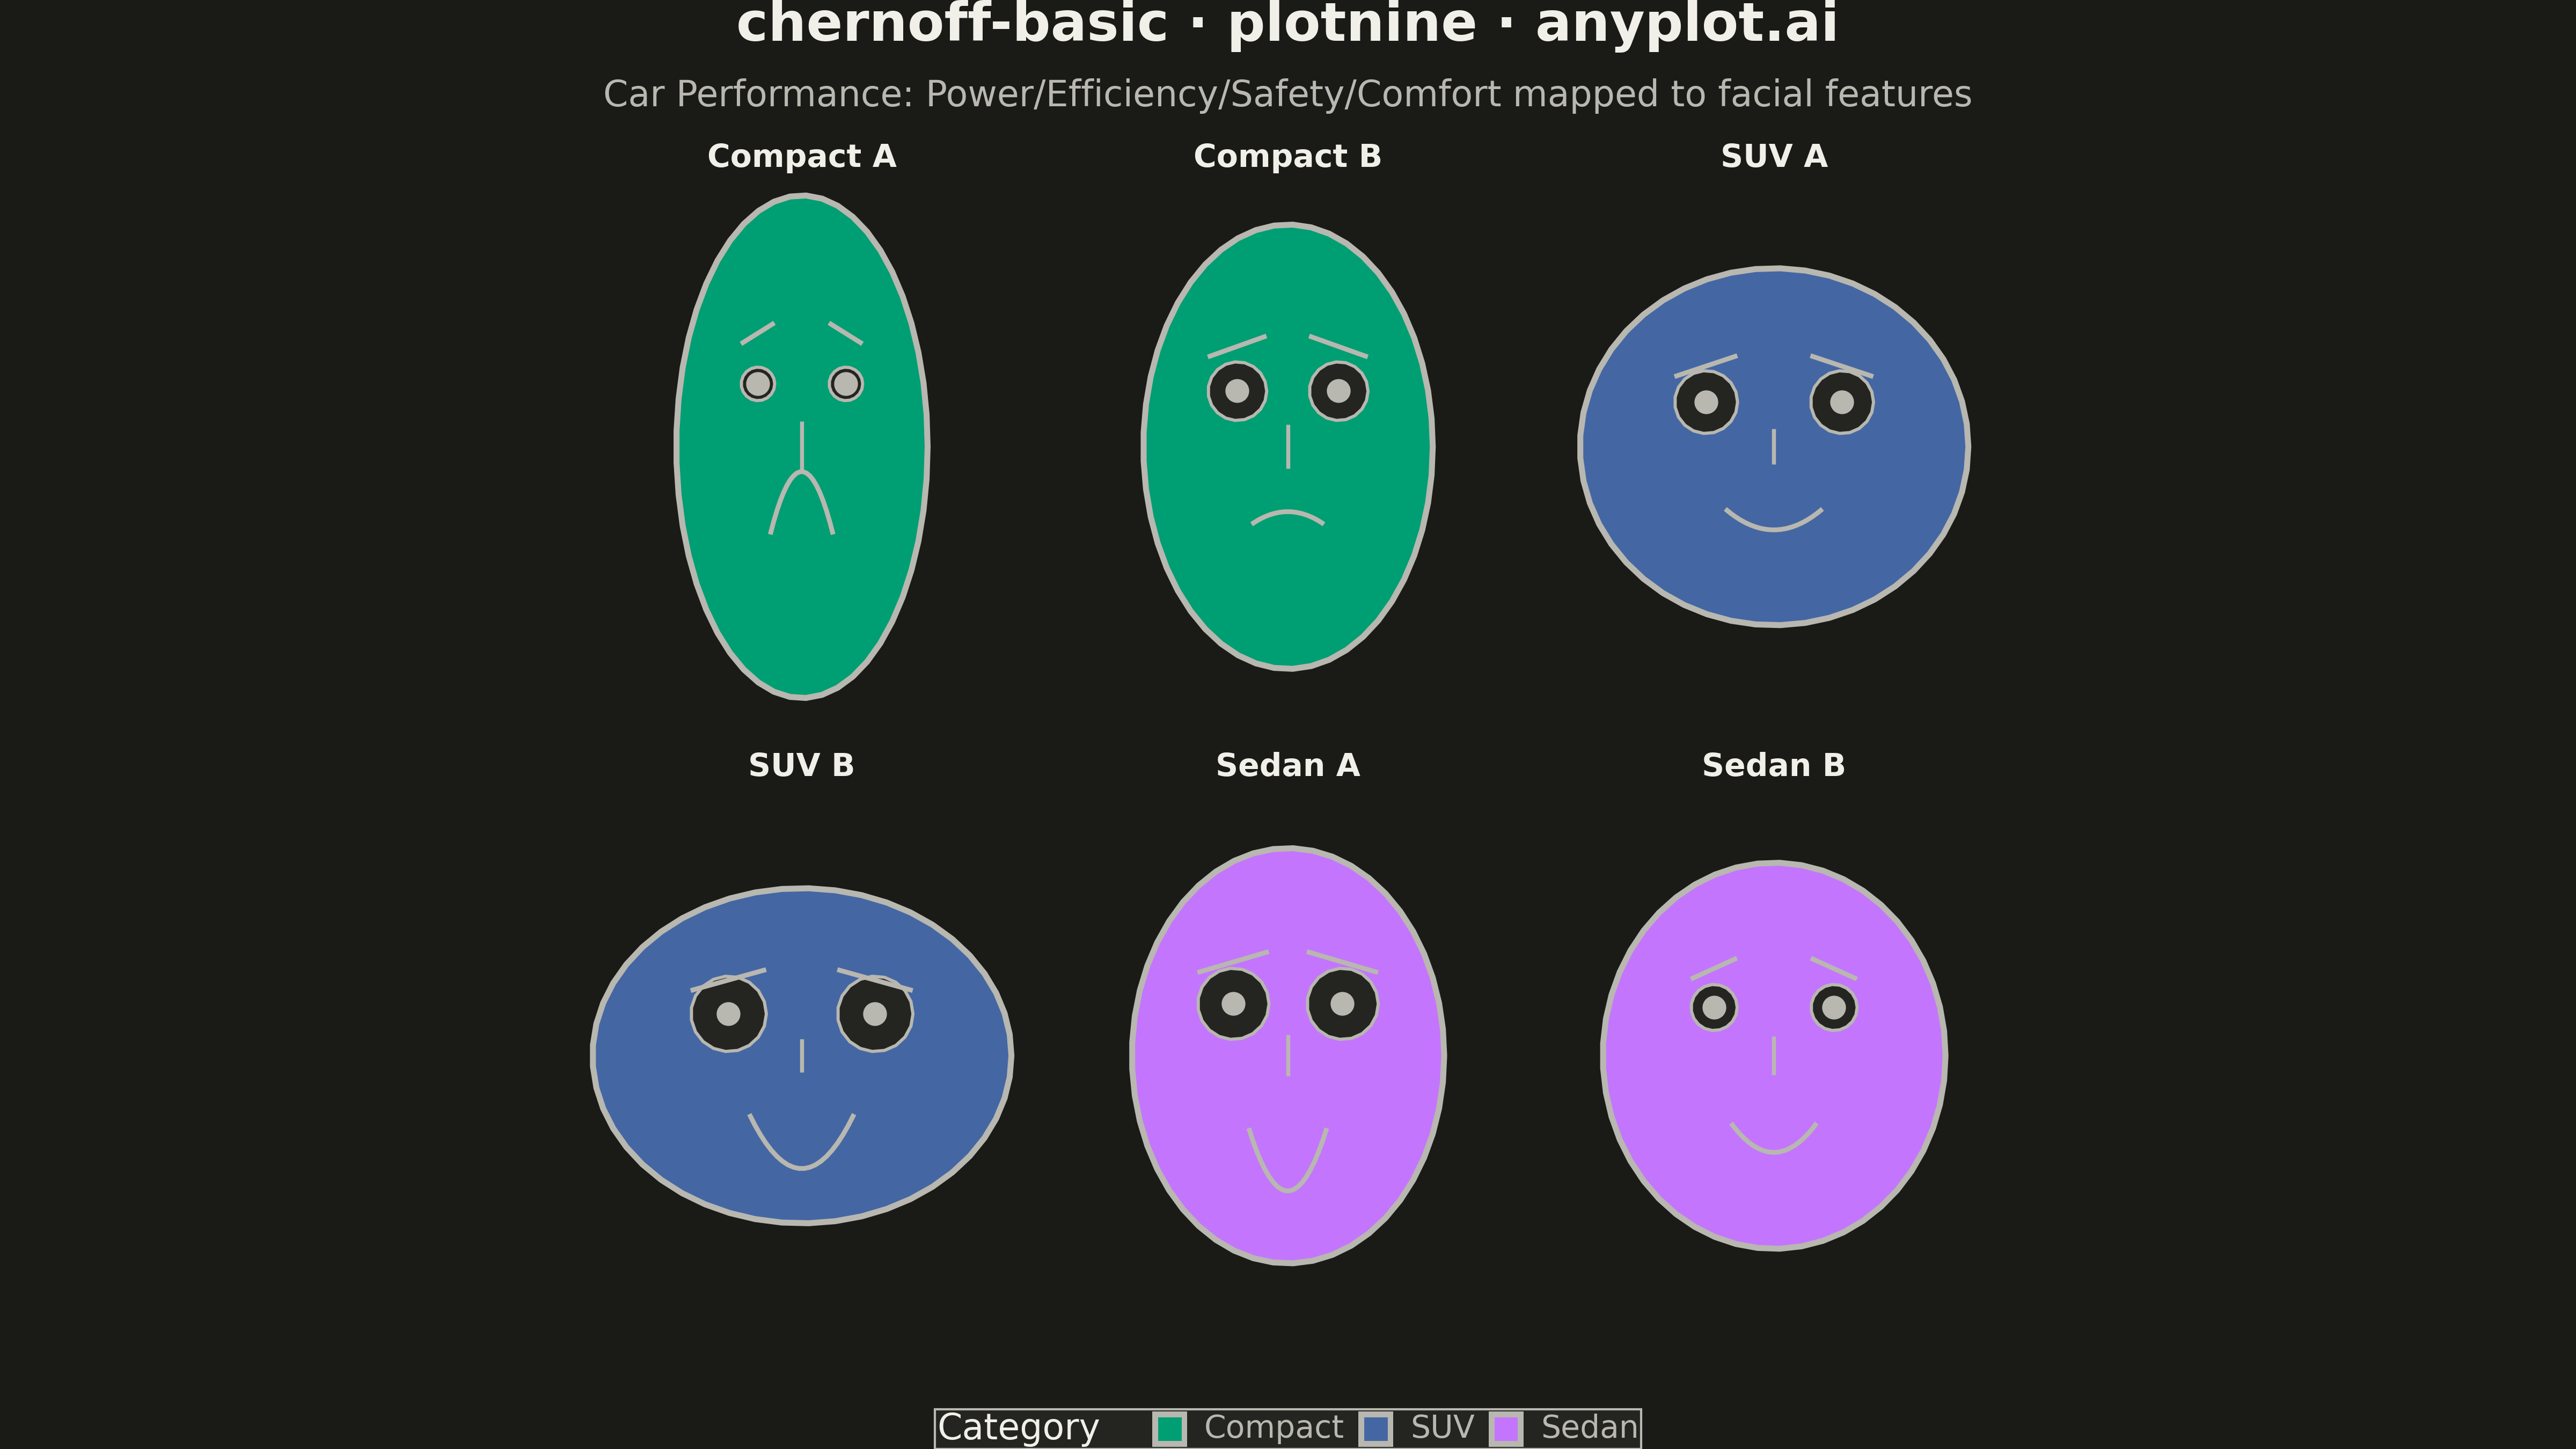
Chernoff faces visualize multivariate data by mapping each variable to a facial feature (eye size, mouth curvature, face width, nose length, etc.), transforming each observation into a unique cartoon face. This technique leverages humans' innate ability to recognize and distinguish faces, making it easier to identify patterns, clusters, and outliers across multiple dimensions simultaneously.
""" anyplot.ai
chernoff-basic: Chernoff Faces for Multivariate Data
Library: plotnine 0.15.4 | Python 3.13.13
Quality: 91/100 | Updated: 2026-05-15
"""

import os

import numpy as np
import pandas as pd
from plotnine import (
    aes,
    coord_fixed,
    element_rect,
    element_text,
    facet_wrap,
    geom_path,
    geom_point,
    geom_polygon,
    ggplot,
    labs,
    scale_fill_manual,
    theme,
    theme_void,
)


THEME = os.getenv("ANYPLOT_THEME", "light")
PAGE_BG = "#FAF8F1" if THEME == "light" else "#1A1A17"
ELEVATED_BG = "#FFFDF6" if THEME == "light" else "#242420"
INK = "#1A1A17" if THEME == "light" else "#F0EFE8"
INK_SOFT = "#4A4A44" if THEME == "light" else "#B8B7B0"

np.random.seed(42)

# Data: Car performance metrics with more extreme outliers
car_data = {
    "observation_id": ["Compact A", "Compact B", "Sedan A", "Sedan B", "SUV A", "SUV B"],
    "category": ["Compact", "Compact", "Sedan", "Sedan", "SUV", "SUV"],
    "engine_power": [100, 150, 180, 220, 280, 320],
    "fuel_efficiency": [38, 30, 26, 22, 18, 15],
    "safety_rating": [3.9, 4.5, 4.8, 4.2, 4.6, 4.9],
    "comfort_score": [3.0, 3.6, 4.5, 4.1, 4.0, 4.4],
}
sample_df = pd.DataFrame(car_data)

# Normalize data to 0-1 range for facial feature mapping
normalized = sample_df[["engine_power", "fuel_efficiency", "safety_rating", "comfort_score"]].apply(
    lambda col: (col - col.min()) / (col.max() - col.min() + 1e-10)
)

face_widths = 0.6 + normalized["engine_power"] * 0.4
face_heights = 0.8 + normalized["fuel_efficiency"] * 0.4
eye_sizes = 0.08 + normalized["safety_rating"] * 0.1
mouth_curvatures = -0.3 + normalized["comfort_score"] * 0.6

# Build data for all faces
all_data = []

for idx in range(len(sample_df)):
    obs_id = sample_df["observation_id"].iloc[idx]
    category = sample_df["category"].iloc[idx]

    fw = face_widths.iloc[idx]
    fh = face_heights.iloc[idx]
    es = eye_sizes.iloc[idx]
    mc = mouth_curvatures.iloc[idx]

    # Face outline
    theta = np.linspace(0, 2 * np.pi, 50)
    fx = fw * np.cos(theta)
    fy = fh * np.sin(theta)
    for i in range(len(fx)):
        all_data.append({"observation_id": obs_id, "category": category, "part": "face", "x": fx[i], "y": fy[i]})

    # Left eye
    theta = np.linspace(0, 2 * np.pi, 20)
    ex = -fw * 0.35 + es * np.cos(theta)
    ey = fh * 0.25 + es * np.sin(theta)
    for i in range(len(ex)):
        all_data.append({"observation_id": obs_id, "category": category, "part": "left_eye", "x": ex[i], "y": ey[i]})

    # Right eye
    ex = fw * 0.35 + es * np.cos(theta)
    ey = fh * 0.25 + es * np.sin(theta)
    for i in range(len(ex)):
        all_data.append({"observation_id": obs_id, "category": category, "part": "right_eye", "x": ex[i], "y": ey[i]})

    # Left pupil (larger for visibility)
    all_data.append(
        {"observation_id": obs_id, "category": category, "part": "left_pupil", "x": -fw * 0.35, "y": fh * 0.25}
    )

    # Right pupil (larger for visibility)
    all_data.append(
        {"observation_id": obs_id, "category": category, "part": "right_pupil", "x": fw * 0.35, "y": fh * 0.25}
    )

    # Mouth
    x_mouth = np.linspace(-fw * 0.25, fw * 0.25, 20)
    y_mouth = -fh * 0.35 + mc * (((x_mouth) / (fw * 0.25)) ** 2 - 1)
    for i in range(len(x_mouth)):
        all_data.append(
            {"observation_id": obs_id, "category": category, "part": "mouth", "x": x_mouth[i], "y": y_mouth[i]}
        )

    # Nose
    all_data.append({"observation_id": obs_id, "category": category, "part": "nose", "x": 0, "y": fh * 0.1})
    all_data.append({"observation_id": obs_id, "category": category, "part": "nose", "x": 0, "y": -fh * 0.1})

    # Left eyebrow
    x_brow = np.linspace(-fw * 0.35 - es, -fw * 0.35 + es, 10)
    y_brow = fh * 0.45 + 0.05 * (x_brow + fw * 0.35) / es
    for i in range(len(x_brow)):
        all_data.append(
            {"observation_id": obs_id, "category": category, "part": "left_eyebrow", "x": x_brow[i], "y": y_brow[i]}
        )

    # Right eyebrow
    x_brow = np.linspace(fw * 0.35 - es, fw * 0.35 + es, 10)
    y_brow = fh * 0.45 - 0.05 * (x_brow - fw * 0.35) / es
    for i in range(len(x_brow)):
        all_data.append(
            {"observation_id": obs_id, "category": category, "part": "right_eyebrow", "x": x_brow[i], "y": y_brow[i]}
        )

plot_df = pd.DataFrame(all_data)

# Okabe-Ito palette
category_colors = {"Compact": "#009E73", "Sedan": "#C475FD", "SUV": "#4467A3"}

anyplot_theme = theme(
    figure_size=(16, 9),
    plot_background=element_rect(fill=PAGE_BG, color=PAGE_BG),
    panel_background=element_rect(fill=PAGE_BG, color=PAGE_BG),
    plot_title=element_text(size=24, weight="bold", color=INK, ha="center"),
    plot_subtitle=element_text(size=16, color=INK_SOFT, ha="center"),
    legend_position="bottom",
    legend_background=element_rect(fill=ELEVATED_BG, color=INK_SOFT),
    legend_title=element_text(size=16, color=INK),
    legend_text=element_text(size=14, color=INK_SOFT),
    strip_text=element_text(size=14, color=INK, weight="bold"),
)

plot = (
    ggplot()
    # Face outline (filled polygon)
    + geom_polygon(
        data=plot_df[plot_df["part"] == "face"],
        mapping=aes(x="x", y="y", group="observation_id", fill="category"),
        color=INK_SOFT,
        size=1.5,
    )
    # Eyes (white/elevated filled)
    + geom_polygon(
        data=plot_df[plot_df["part"] == "left_eye"],
        mapping=aes(x="x", y="y", group="observation_id"),
        fill=ELEVATED_BG,
        color=INK_SOFT,
        size=0.8,
    )
    + geom_polygon(
        data=plot_df[plot_df["part"] == "right_eye"],
        mapping=aes(x="x", y="y", group="observation_id"),
        fill=ELEVATED_BG,
        color=INK_SOFT,
        size=0.8,
    )
    # Pupils (larger for visibility)
    + geom_point(data=plot_df[plot_df["part"] == "left_pupil"], mapping=aes(x="x", y="y"), color=INK_SOFT, size=5)
    + geom_point(data=plot_df[plot_df["part"] == "right_pupil"], mapping=aes(x="x", y="y"), color=INK_SOFT, size=5)
    # Mouth
    + geom_path(
        data=plot_df[plot_df["part"] == "mouth"],
        mapping=aes(x="x", y="y", group="observation_id"),
        color=INK_SOFT,
        size=1.2,
    )
    # Nose
    + geom_path(
        data=plot_df[plot_df["part"] == "nose"],
        mapping=aes(x="x", y="y", group="observation_id"),
        color=INK_SOFT,
        size=1,
    )
    # Eyebrows
    + geom_path(
        data=plot_df[plot_df["part"] == "left_eyebrow"],
        mapping=aes(x="x", y="y", group="observation_id"),
        color=INK_SOFT,
        size=1.2,
    )
    + geom_path(
        data=plot_df[plot_df["part"] == "right_eyebrow"],
        mapping=aes(x="x", y="y", group="observation_id"),
        color=INK_SOFT,
        size=1.2,
    )
    # Facet by observation
    + facet_wrap("~observation_id", ncol=3)
    # Colors (Okabe-Ito palette)
    + scale_fill_manual(values=category_colors)
    # Labels
    + labs(
        title="chernoff-basic · plotnine · anyplot.ai",
        subtitle="Car Performance: Power/Efficiency/Safety/Comfort mapped to facial features",
        fill="Category",
    )
    # Theme
    + theme_void()
    + anyplot_theme
    + coord_fixed(ratio=1)
)

plot.save(f"plot-{THEME}.png", dpi=300)
Runnable source as JSON, for any HTTP client: https://api.anyplot.ai/specs/chernoff-basic/plotnine/code. Any spec id and library id listed in llms-full.txt fit the same URL shape; every URL below is complete and callable.
{
  "spec_id": "chernoff-basic",
  "language": "python",
  "library": "plotnine",
  "page": "https://anyplot.ai/chernoff-basic/python/plotnine",
  "hub": "https://anyplot.ai/chernoff-basic",
  "code_json": "https://api.anyplot.ai/specs/chernoff-basic/plotnine/code",
  "spec_json": "https://api.anyplot.ai/specs/chernoff-basic",
  "render_light_png": "https://storage.googleapis.com/anyplot-images/plots/chernoff-basic/python/plotnine/plot-light.png",
  "render_dark_png": "https://storage.googleapis.com/anyplot-images/plots/chernoff-basic/python/plotnine/plot-dark.png",
  "quality_score": 91.0,
  "license": "MIT",
  "guide": "https://anyplot.ai/llms.txt"
}
Part of Chernoff Faces for Multivariate Data on anyplot.ai.