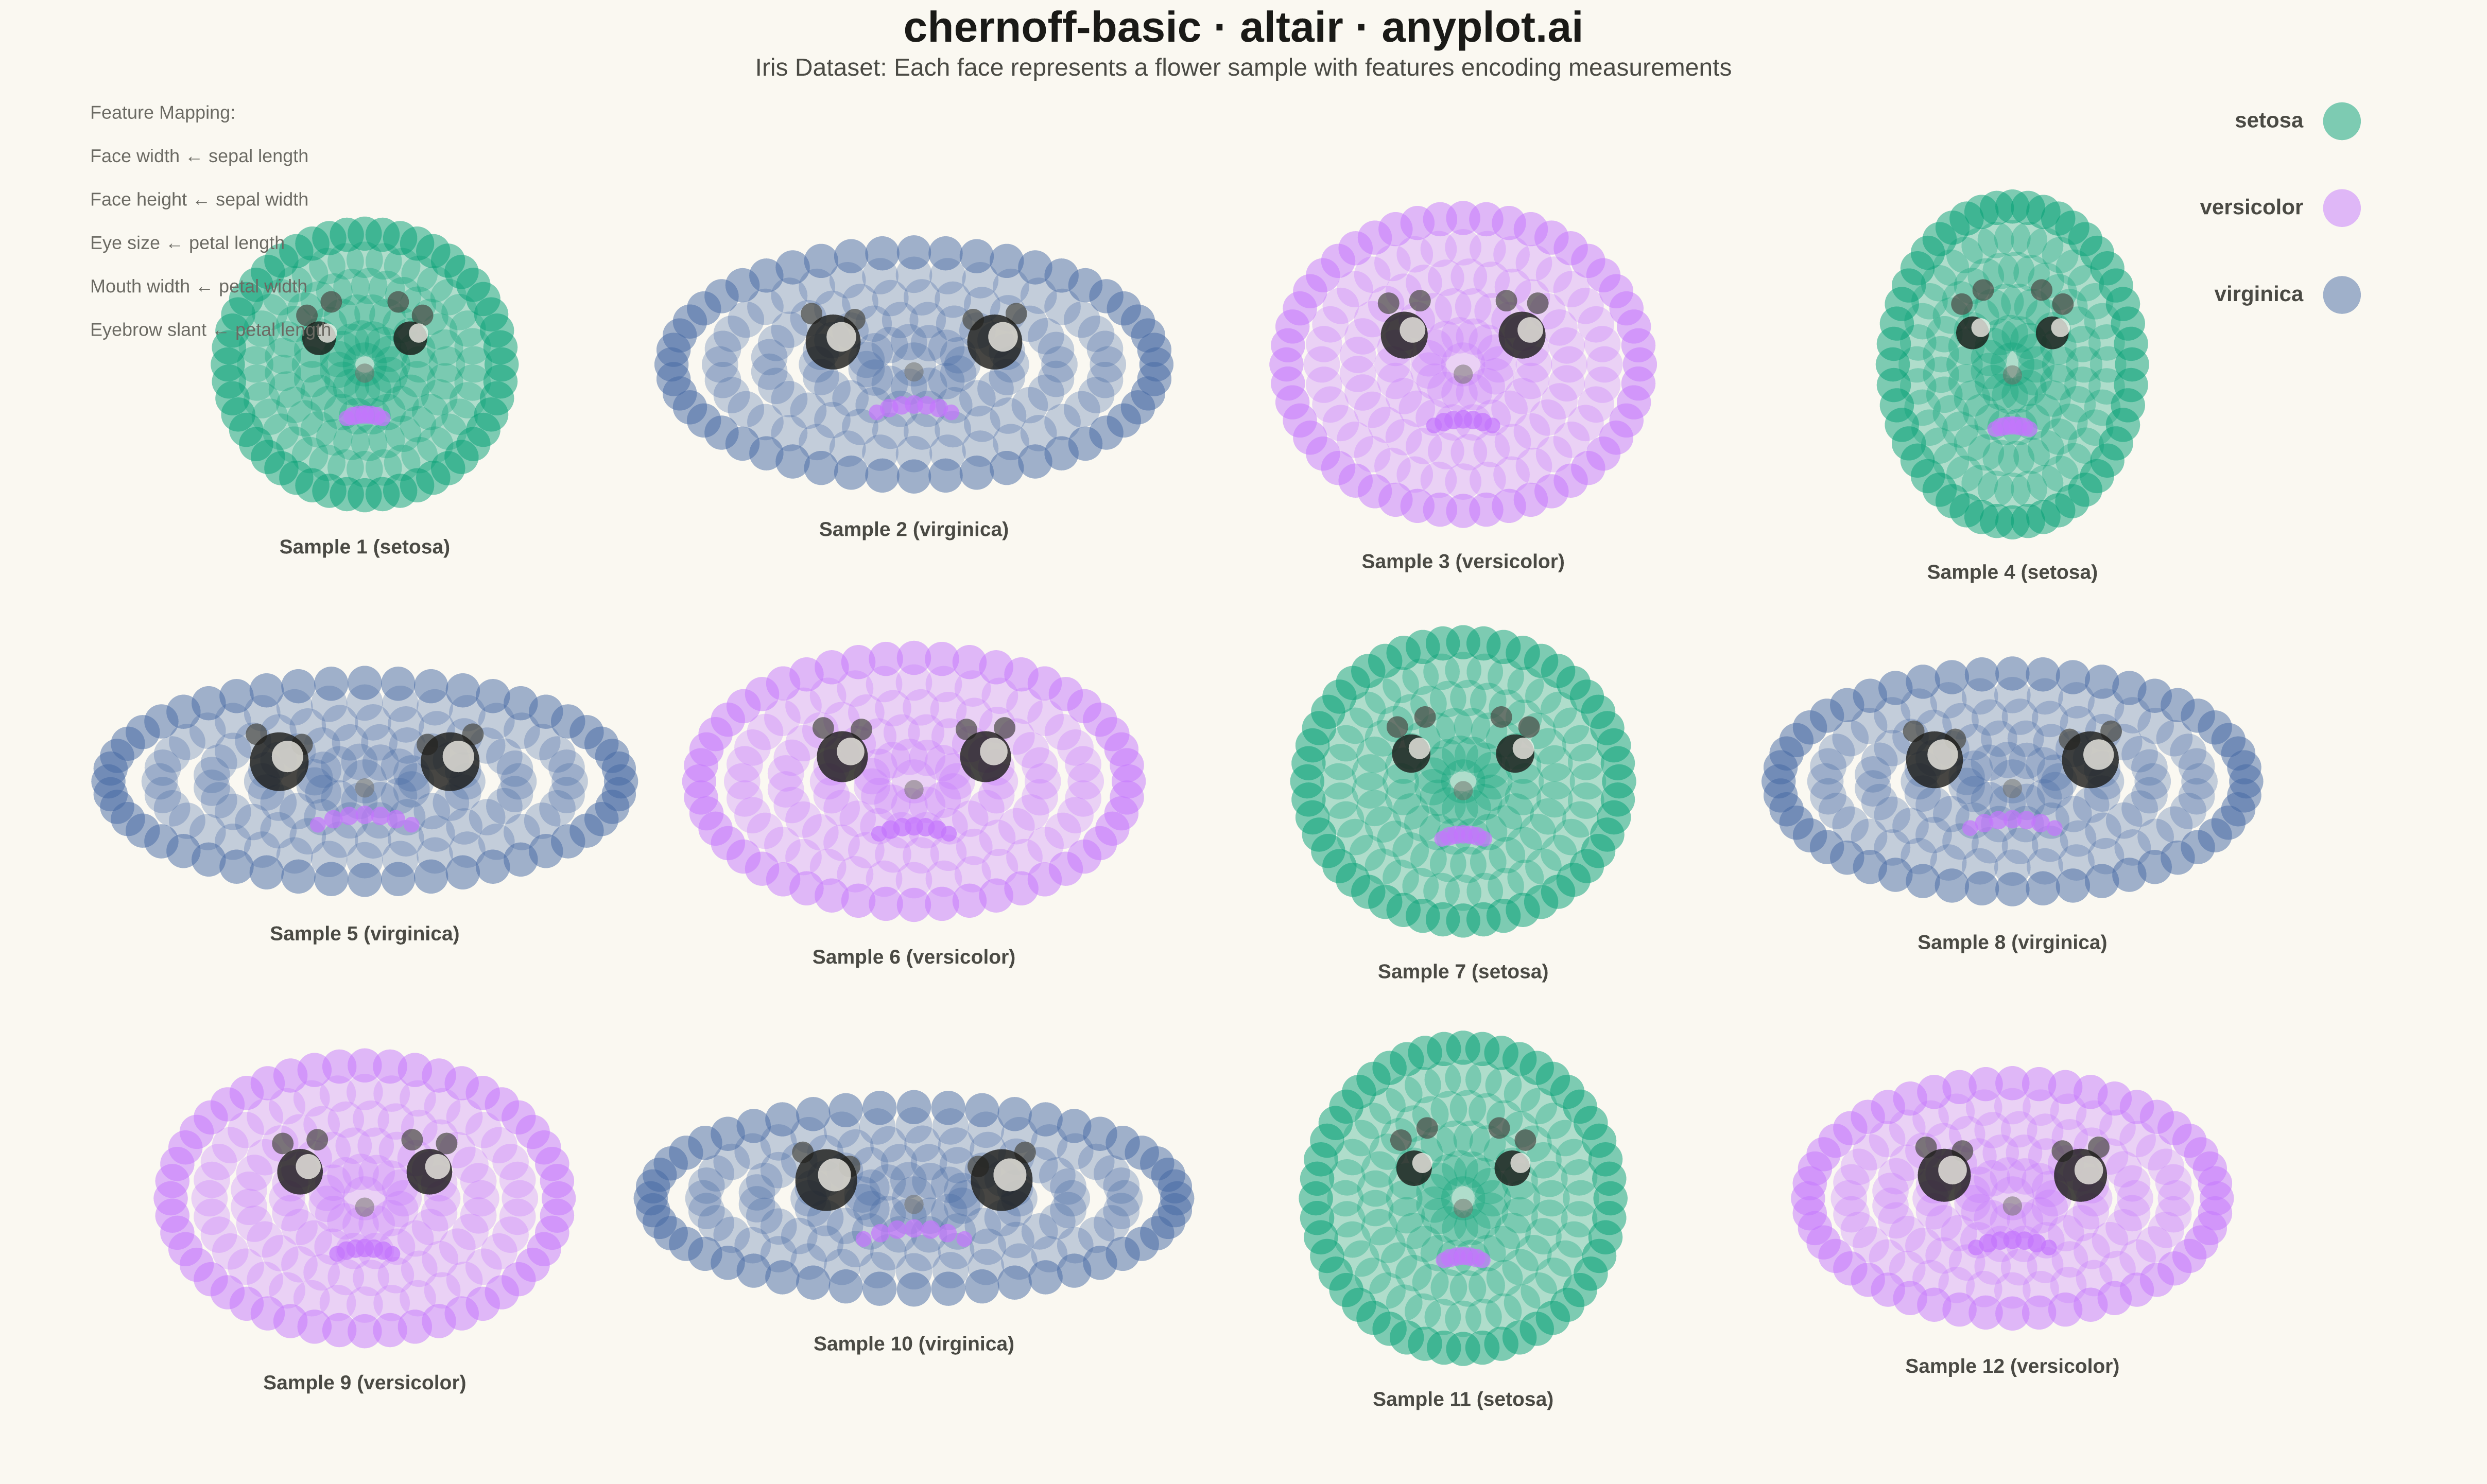
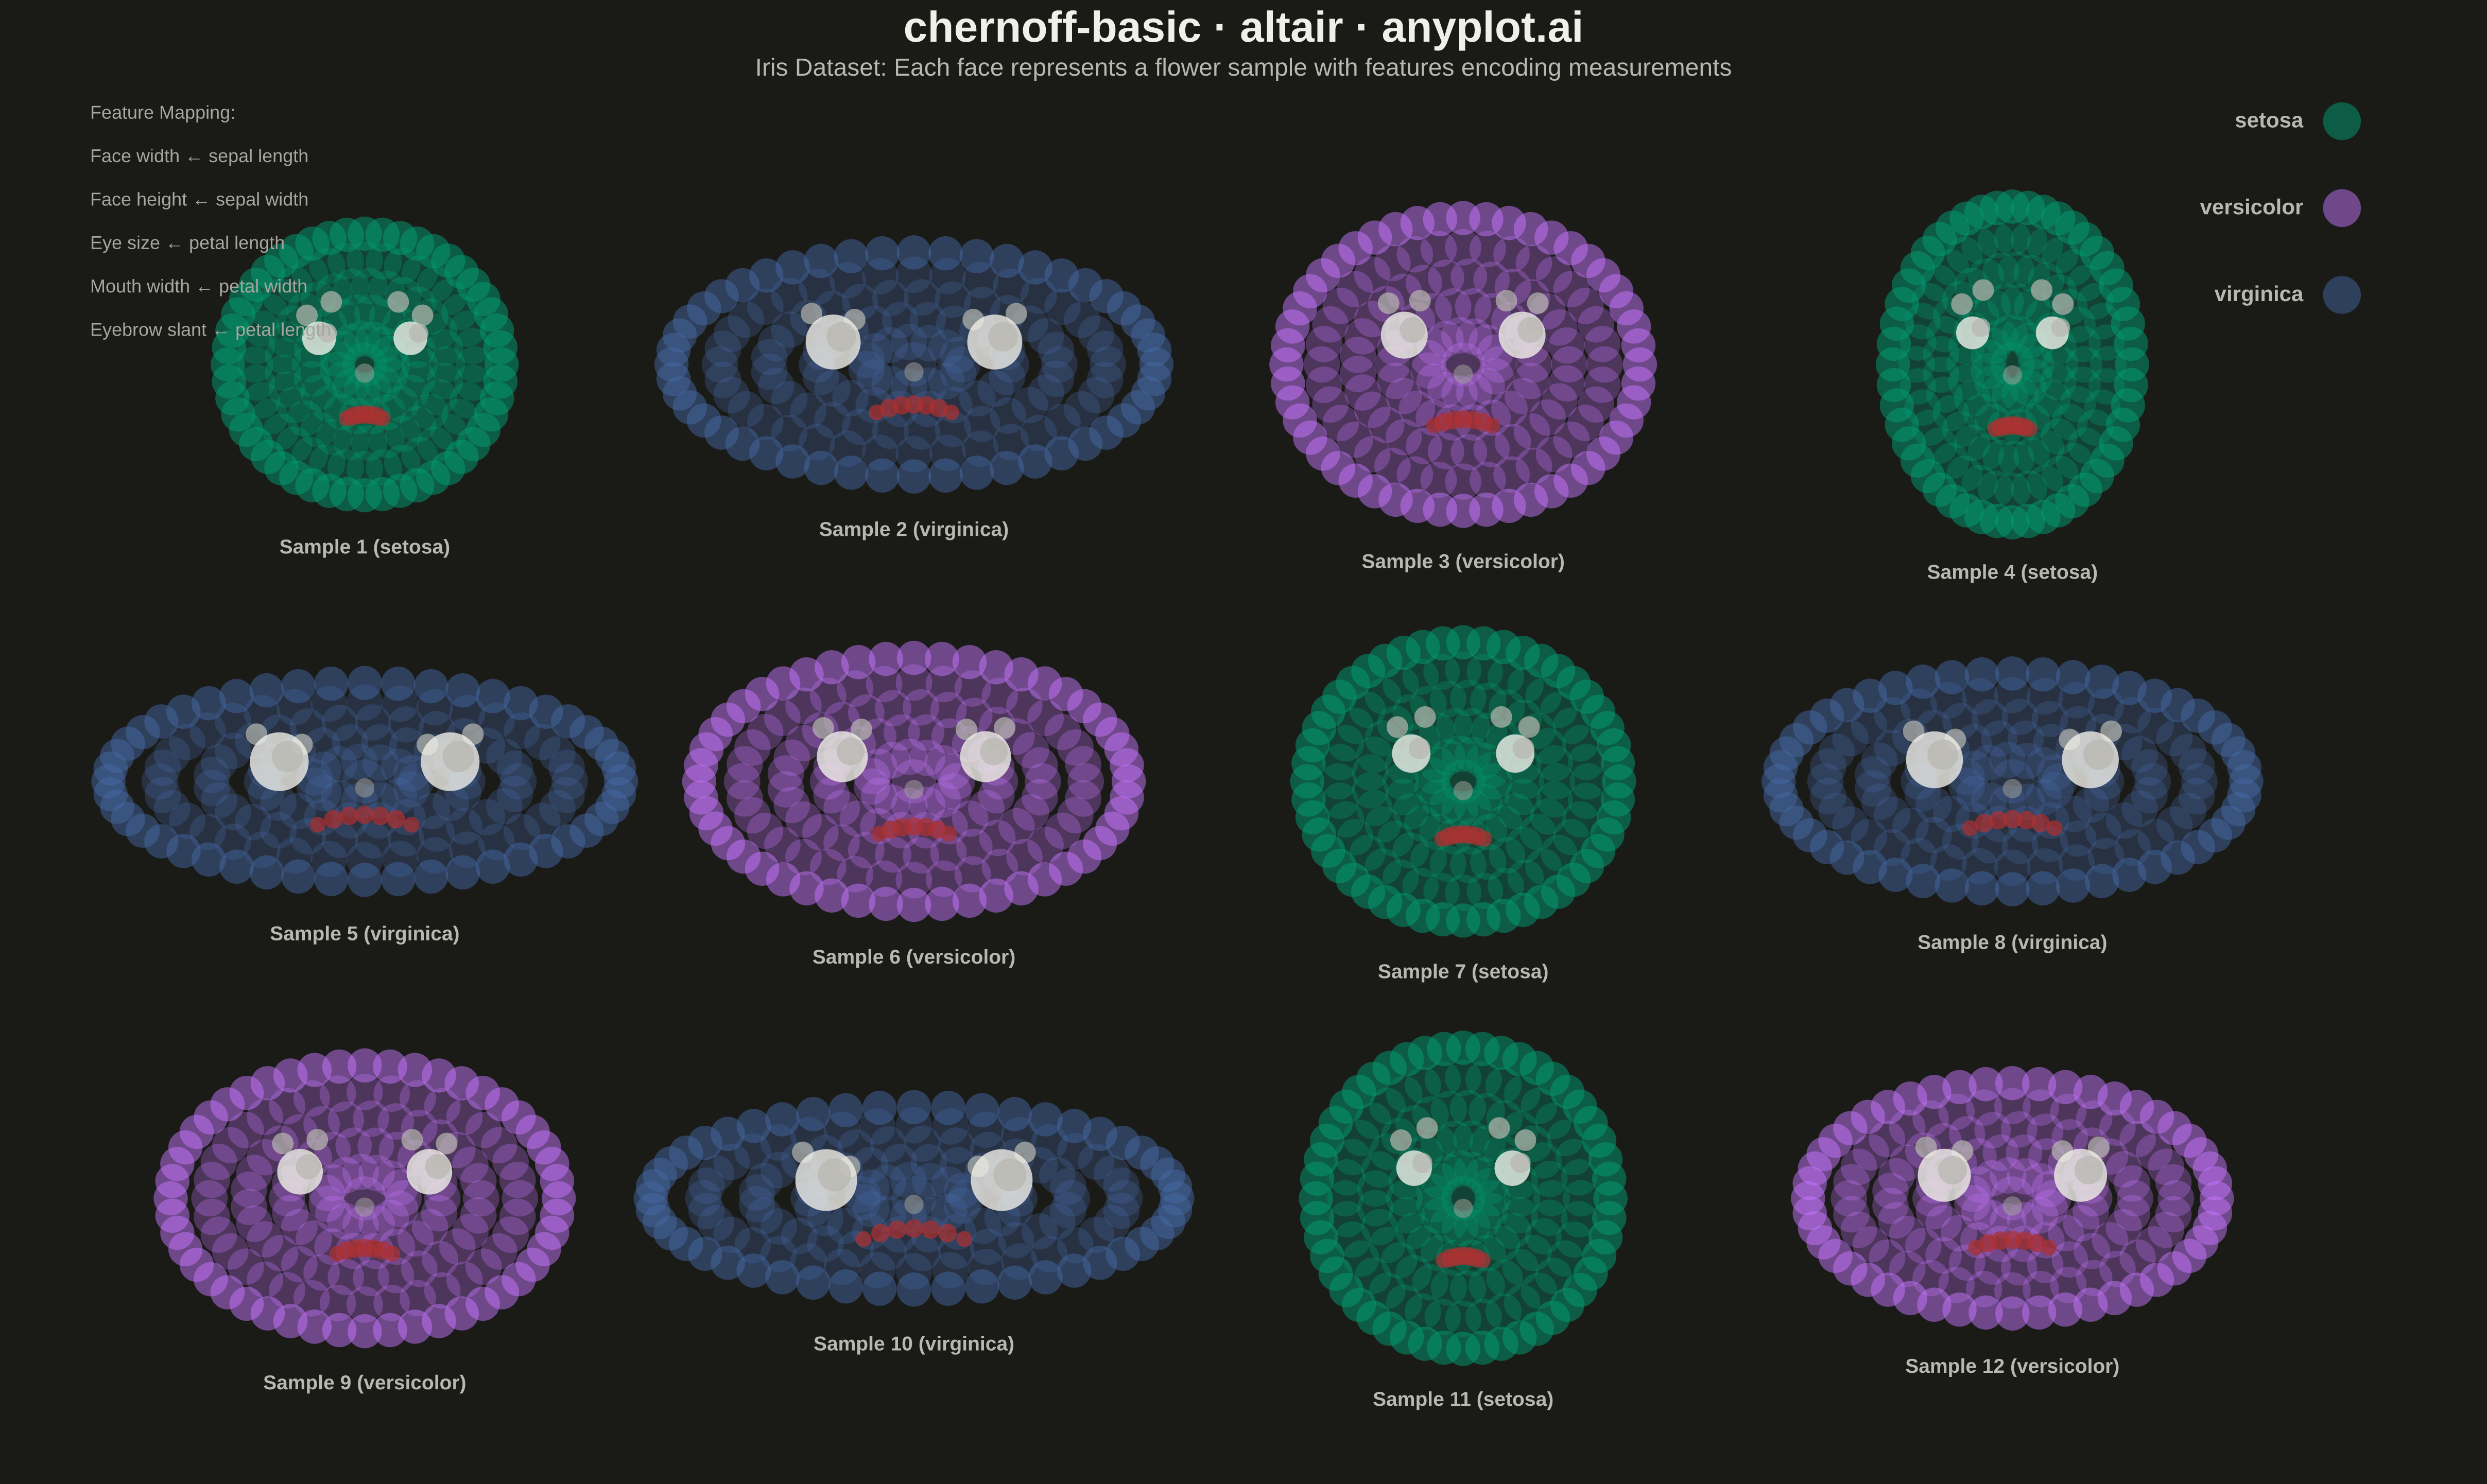
Chernoff faces visualize multivariate data by mapping each variable to a facial feature (eye size, mouth curvature, face width, nose length, etc.), transforming each observation into a unique cartoon face. This technique leverages humans' innate ability to recognize and distinguish faces, making it easier to identify patterns, clusters, and outliers across multiple dimensions simultaneously.
""" anyplot.ai
chernoff-basic: Chernoff Faces for Multivariate Data
Library: altair 6.1.0 | Python 3.13.13
Quality: 89/100 | Updated: 2026-05-15
"""

import os

import altair as alt
import numpy as np
import pandas as pd


# Theme tokens
THEME = os.getenv("ANYPLOT_THEME", "light")
PAGE_BG = "#FAF8F1" if THEME == "light" else "#1A1A17"
ELEVATED_BG = "#FFFDF6" if THEME == "light" else "#242420"
INK = "#1A1A17" if THEME == "light" else "#F0EFE8"
INK_SOFT = "#4A4A44" if THEME == "light" else "#B8B7B0"
INK_MUTED = "#6B6A63" if THEME == "light" else "#A8A79F"

# Okabe-Ito palette for species
IMPRINT = ["#009E73", "#C475FD", "#4467A3", "#BD8233", "#AE3030", "#2ABCCD", "#954477"]

# Data - Iris dataset features for 12 representative flowers
np.random.seed(42)
# Diverse samples from iris-like measurements (normalized 0-1)
data = pd.DataFrame(
    {
        "observation": [f"Sample {i + 1}" for i in range(12)],
        "sepal_length": [0.22, 0.83, 0.45, 0.12, 0.91, 0.67, 0.33, 0.78, 0.55, 0.95, 0.28, 0.61],
        "sepal_width": [0.63, 0.45, 0.78, 0.89, 0.32, 0.56, 0.71, 0.41, 0.65, 0.25, 0.82, 0.48],
        "petal_length": [0.07, 0.69, 0.42, 0.05, 0.83, 0.55, 0.18, 0.76, 0.38, 0.95, 0.11, 0.62],
        "petal_width": [0.04, 0.54, 0.33, 0.02, 0.79, 0.48, 0.12, 0.67, 0.29, 0.88, 0.08, 0.52],
        "species": [
            "setosa",
            "virginica",
            "versicolor",
            "setosa",
            "virginica",
            "versicolor",
            "setosa",
            "virginica",
            "versicolor",
            "virginica",
            "setosa",
            "versicolor",
        ],
    }
)

# Map species to Okabe-Ito colors
species_colors = {"setosa": IMPRINT[0], "versicolor": IMPRINT[1], "virginica": IMPRINT[2]}
data["color"] = data["species"].map(species_colors)

# Create descriptive labels including species name
data["label"] = [f"{obs} ({sp})" for obs, sp in zip(data["observation"], data["species"], strict=True)]

# Grid positions for 12 faces (4 columns x 3 rows for better canvas utilization)
data["col"] = [i % 4 for i in range(12)]
data["row"] = [i // 4 for i in range(12)]
data["x_center"] = data["col"] * 200 + 130
data["y_center"] = (2 - data["row"]) * 240 + 160

# Calculate face feature dimensions based on variables with more pronounced variation
# face_width: sepal_length, face_height: sepal_width
# eye_size: petal_length, mouth_width: petal_width
# eyebrow_slant: derived from petal_length (maps to eyebrow angle)
data["face_width"] = 40 + data["sepal_length"] * 70  # 40-110
data["face_height"] = 50 + data["sepal_width"] * 80  # 50-130
data["eye_size"] = 6 + data["petal_length"] * 22  # 6-28
data["mouth_width"] = 15 + data["petal_width"] * 35  # 15-50
data["eyebrow_slant"] = -15 + data["petal_length"] * 30  # -15 to 15

# Build face components using layered shapes
face_records = []

for _, r in data.iterrows():
    xc, yc = r["x_center"], r["y_center"]
    fw, fh = r["face_width"], r["face_height"]
    es = r["eye_size"]
    mw = r["mouth_width"]
    eb_slant = r["eyebrow_slant"]

    # Face outline - single smooth ellipse using many small points on perimeter
    # This creates a clean ellipse shape instead of blobby overlapping circles
    for angle in np.linspace(0, 2 * np.pi, 48, endpoint=False):
        px = xc + (fw * 0.9) * np.cos(angle)
        py = yc + (fh * 0.75) * np.sin(angle)
        face_records.append(
            {
                "x": px,
                "y": py,
                "size": 350,
                "color": r["color"],
                "part": "outline",
                "observation": r["observation"],
                "species": r["species"],
                "opacity": 0.7,
            }
        )

    # Face fill - concentric rings of points to fill the ellipse smoothly
    for scale in [0.8, 0.6, 0.4, 0.2]:
        for angle in np.linspace(0, 2 * np.pi, int(36 * scale) + 8, endpoint=False):
            px = xc + (fw * 0.9 * scale) * np.cos(angle)
            py = yc + (fh * 0.75 * scale) * np.sin(angle)
            face_records.append(
                {
                    "x": px,
                    "y": py,
                    "size": 400,
                    "color": r["color"],
                    "part": "face_fill",
                    "observation": r["observation"],
                    "species": r["species"],
                    "opacity": 0.5,
                }
            )

    # Center fill point
    face_records.append(
        {
            "x": xc,
            "y": yc,
            "size": 600,
            "color": r["color"],
            "part": "face_fill",
            "observation": r["observation"],
            "species": r["species"],
            "opacity": 0.5,
        }
    )

    # Left eyebrow (line represented by two points)
    eyebrow_color = INK_SOFT
    face_records.append(
        {
            "x": xc - fw * 0.38,
            "y": yc + fh * 0.32 + eb_slant * 0.3,
            "size": 120,
            "color": eyebrow_color,
            "part": "eyebrow",
            "observation": r["observation"],
            "species": r["species"],
            "opacity": 0.9,
        }
    )
    face_records.append(
        {
            "x": xc - fw * 0.22,
            "y": yc + fh * 0.32 - eb_slant * 0.3,
            "size": 120,
            "color": eyebrow_color,
            "part": "eyebrow",
            "observation": r["observation"],
            "species": r["species"],
            "opacity": 0.9,
        }
    )
    # Right eyebrow
    face_records.append(
        {
            "x": xc + fw * 0.22,
            "y": yc + fh * 0.32 - eb_slant * 0.3,
            "size": 120,
            "color": eyebrow_color,
            "part": "eyebrow",
            "observation": r["observation"],
            "species": r["species"],
            "opacity": 0.9,
        }
    )
    face_records.append(
        {
            "x": xc + fw * 0.38,
            "y": yc + fh * 0.32 + eb_slant * 0.3,
            "size": 120,
            "color": eyebrow_color,
            "part": "eyebrow",
            "observation": r["observation"],
            "species": r["species"],
            "opacity": 0.9,
        }
    )
    # Left eye
    face_records.append(
        {
            "x": xc - fw * 0.30,
            "y": yc + fh * 0.15,
            "size": es * 45,
            "color": INK,
            "part": "eye",
            "observation": r["observation"],
            "species": r["species"],
            "opacity": 1.0,
        }
    )
    # Right eye
    face_records.append(
        {
            "x": xc + fw * 0.30,
            "y": yc + fh * 0.15,
            "size": es * 45,
            "color": INK,
            "part": "eye",
            "observation": r["observation"],
            "species": r["species"],
            "opacity": 1.0,
        }
    )
    # Left pupil (white/light highlight)
    pupil_color = PAGE_BG if THEME == "light" else INK_SOFT
    face_records.append(
        {
            "x": xc - fw * 0.30 + 3,
            "y": yc + fh * 0.15 + 3,
            "size": es * 12,
            "color": pupil_color,
            "part": "pupil",
            "observation": r["observation"],
            "species": r["species"],
            "opacity": 0.95,
        }
    )
    # Right pupil (white/light highlight)
    face_records.append(
        {
            "x": xc + fw * 0.30 + 3,
            "y": yc + fh * 0.15 + 3,
            "size": es * 12,
            "color": pupil_color,
            "part": "pupil",
            "observation": r["observation"],
            "species": r["species"],
            "opacity": 0.95,
        }
    )
    # Nose
    nose_color = INK_MUTED
    face_records.append(
        {
            "x": xc,
            "y": yc - fh * 0.05,
            "size": 90,
            "color": nose_color,
            "part": "nose",
            "observation": r["observation"],
            "species": r["species"],
            "opacity": 0.7,
        }
    )
    # Mouth - using horizontal ellipse shape for better representation
    mouth_color = IMPRINT[1] if THEME == "light" else IMPRINT[4]
    mouth_y = yc - fh * 0.30
    for dx in np.linspace(-mw * 0.4, mw * 0.4, 7):
        # Parabolic curve for mouth (smiling effect based on width)
        dy = -(dx**2) / (mw * 1.2) + mw * 0.08
        face_records.append(
            {
                "x": xc + dx,
                "y": mouth_y + dy,
                "size": 80 if abs(dx) < mw * 0.3 else 50,
                "color": mouth_color,
                "part": "mouth",
                "observation": r["observation"],
                "species": r["species"],
                "opacity": 0.9,
            }
        )

face_df = pd.DataFrame(face_records)

# Reorder facial features drawing order
part_order = {"outline": 0, "face_fill": 1, "eyebrow": 2, "nose": 3, "mouth": 4, "eye": 5, "pupil": 6}
face_df["order"] = face_df["part"].map(part_order)
face_df = face_df.sort_values("order")

# Create labels for each face - positioned below faces with descriptive text
label_df = data[["x_center", "y_center", "label", "face_height"]].copy()
label_df["y_label"] = label_df["y_center"] - label_df["face_height"] * 0.7 - 35

# Face features chart (includes outline, fill, and features)
features = (
    alt.Chart(face_df)
    .mark_point(filled=True)
    .encode(
        x=alt.X("x:Q", axis=None, scale=alt.Scale(domain=[0, 900])),
        y=alt.Y("y:Q", axis=None, scale=alt.Scale(domain=[0, 800])),
        size=alt.Size("size:Q", legend=None, scale=alt.Scale(range=[40, 1600])),
        color=alt.Color("color:N", legend=None, scale=None),
        opacity=alt.Opacity("opacity:Q", legend=None),
        order="order:O",
    )
)

# Labels with species info
labels = (
    alt.Chart(label_df)
    .mark_text(fontSize=13, fontWeight="bold", color=INK_SOFT)
    .encode(x=alt.X("x_center:Q", axis=None), y=alt.Y("y_label:Q", axis=None), text="label:N")
)

# Legend for species (positioned on right side, higher up to avoid overlap)
legend_data = pd.DataFrame(
    {
        "species": ["setosa", "versicolor", "virginica"],
        "x": [850, 850, 850],
        "y": [780, 730, 680],
        "color": [IMPRINT[0], IMPRINT[1], IMPRINT[2]],
    }
)

legend_points = (
    alt.Chart(legend_data)
    .mark_point(filled=True, size=600, opacity=0.5)
    .encode(x=alt.X("x:Q", axis=None), y=alt.Y("y:Q", axis=None), color=alt.Color("color:N", scale=None, legend=None))
)

legend_text = (
    alt.Chart(legend_data)
    .mark_text(align="right", fontSize=14, dx=-25, fontWeight="bold", color=INK_SOFT)
    .encode(x="x:Q", y="y:Q", text="species:N")
)

# Feature mapping explanation - positioned at top left to avoid overlap with faces
mapping_data = pd.DataFrame(
    {
        "text": [
            "Feature Mapping:",
            "Face width ← sepal length",
            "Face height ← sepal width",
            "Eye size ← petal length",
            "Mouth width ← petal width",
            "Eyebrow slant ← petal length",
        ],
        "x": [30, 30, 30, 30, 30, 30],
        "y": [785, 760, 735, 710, 685, 660],
    }
)

mapping_text = (
    alt.Chart(mapping_data)
    .mark_text(align="left", fontSize=12, color=INK_MUTED)
    .encode(x="x:Q", y="y:Q", text="text:N")
)

# Combine all layers
chart = (
    (features + labels + legend_points + legend_text + mapping_text)
    .properties(
        width=1600,
        height=900,
        background=PAGE_BG,
        title=alt.Title(
            "chernoff-basic · altair · anyplot.ai",
            fontSize=28,
            anchor="middle",
            color=INK,
            subtitle="Iris Dataset: Each face represents a flower sample with features encoding measurements",
            subtitleFontSize=16,
            subtitleColor=INK_SOFT,
        ),
    )
    .configure_view(strokeWidth=0, fill=PAGE_BG)
)

# Save as PNG and HTML
chart.save(f"plot-{THEME}.png", scale_factor=3.0)
chart.save(f"plot-{THEME}.html")
Runnable source as JSON, for any HTTP client: https://api.anyplot.ai/specs/chernoff-basic/altair/code. Any spec id and library id listed in llms-full.txt fit the same URL shape; every URL below is complete and callable.
{
  "spec_id": "chernoff-basic",
  "language": "python",
  "library": "altair",
  "page": "https://anyplot.ai/chernoff-basic/python/altair",
  "hub": "https://anyplot.ai/chernoff-basic",
  "code_json": "https://api.anyplot.ai/specs/chernoff-basic/altair/code",
  "spec_json": "https://api.anyplot.ai/specs/chernoff-basic",
  "render_light_png": "https://storage.googleapis.com/anyplot-images/plots/chernoff-basic/python/altair/plot-light.png",
  "render_dark_png": "https://storage.googleapis.com/anyplot-images/plots/chernoff-basic/python/altair/plot-dark.png",
  "interactive_light_html": "https://storage.googleapis.com/anyplot-images/plots/chernoff-basic/python/altair/plot-light.html",
  "interactive_dark_html": "https://storage.googleapis.com/anyplot-images/plots/chernoff-basic/python/altair/plot-dark.html",
  "quality_score": 89.0,
  "license": "MIT",
  "guide": "https://anyplot.ai/llms.txt"
}
Part of Chernoff Faces for Multivariate Data on anyplot.ai.