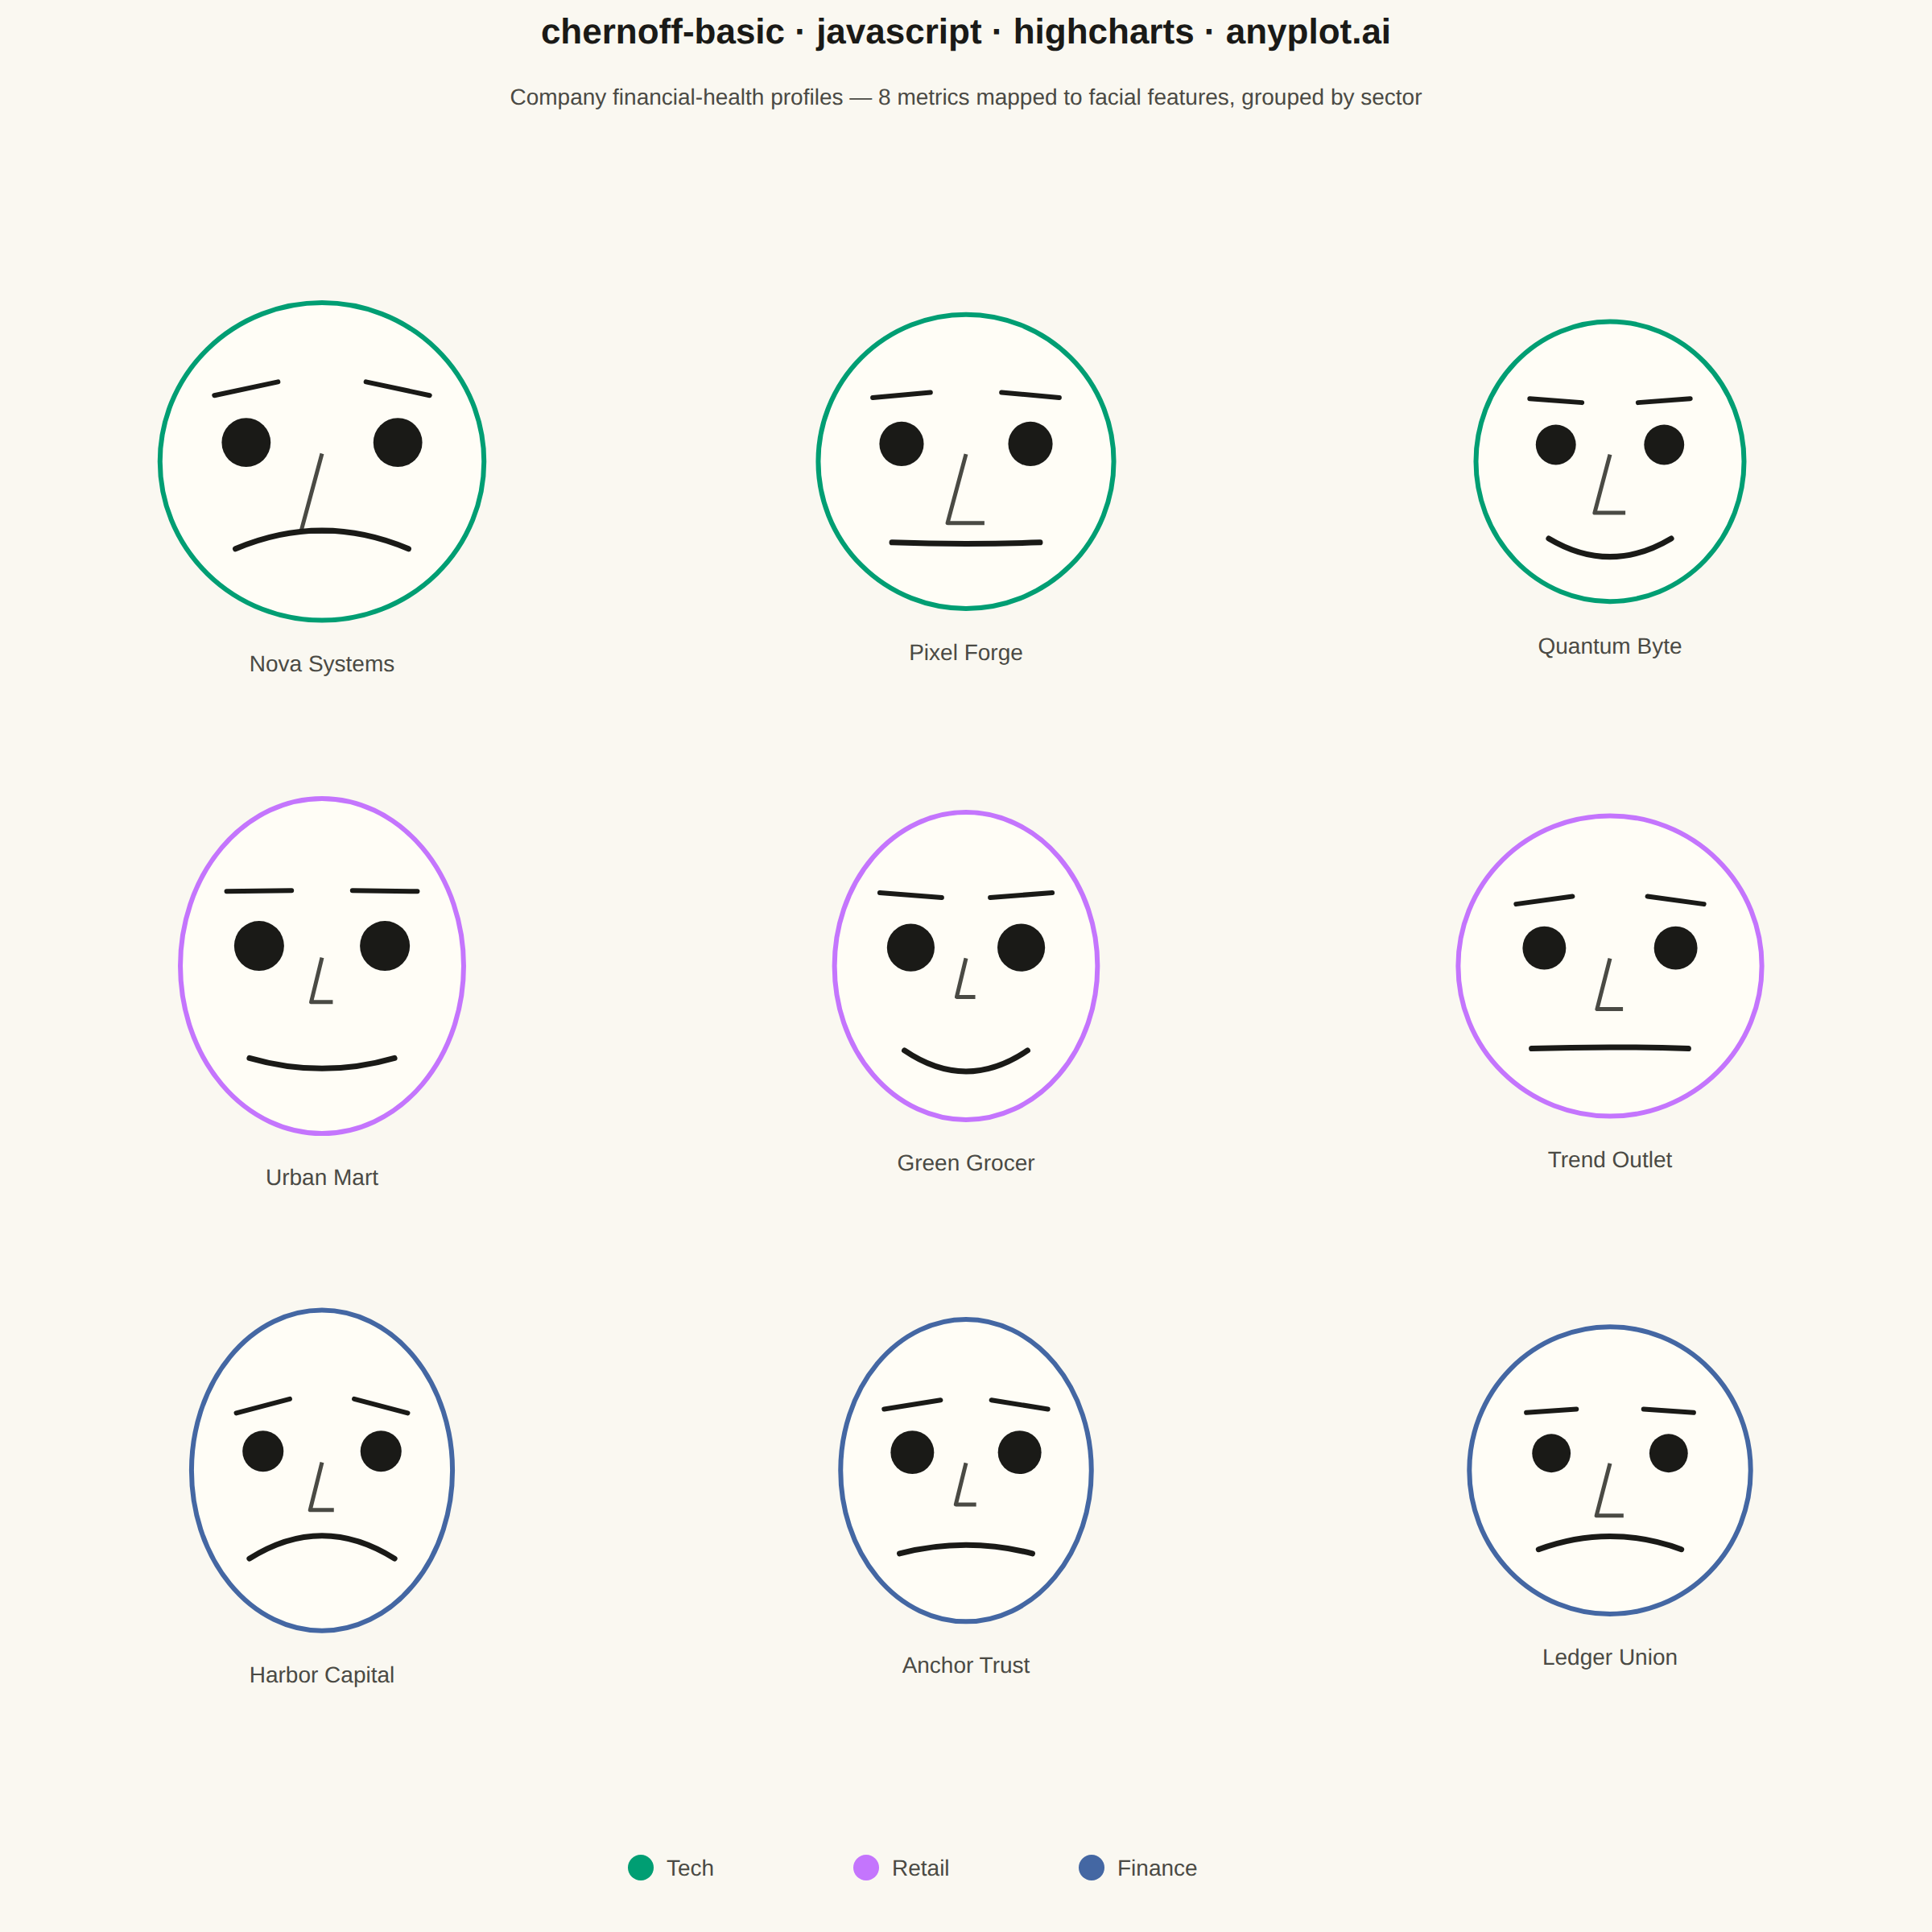
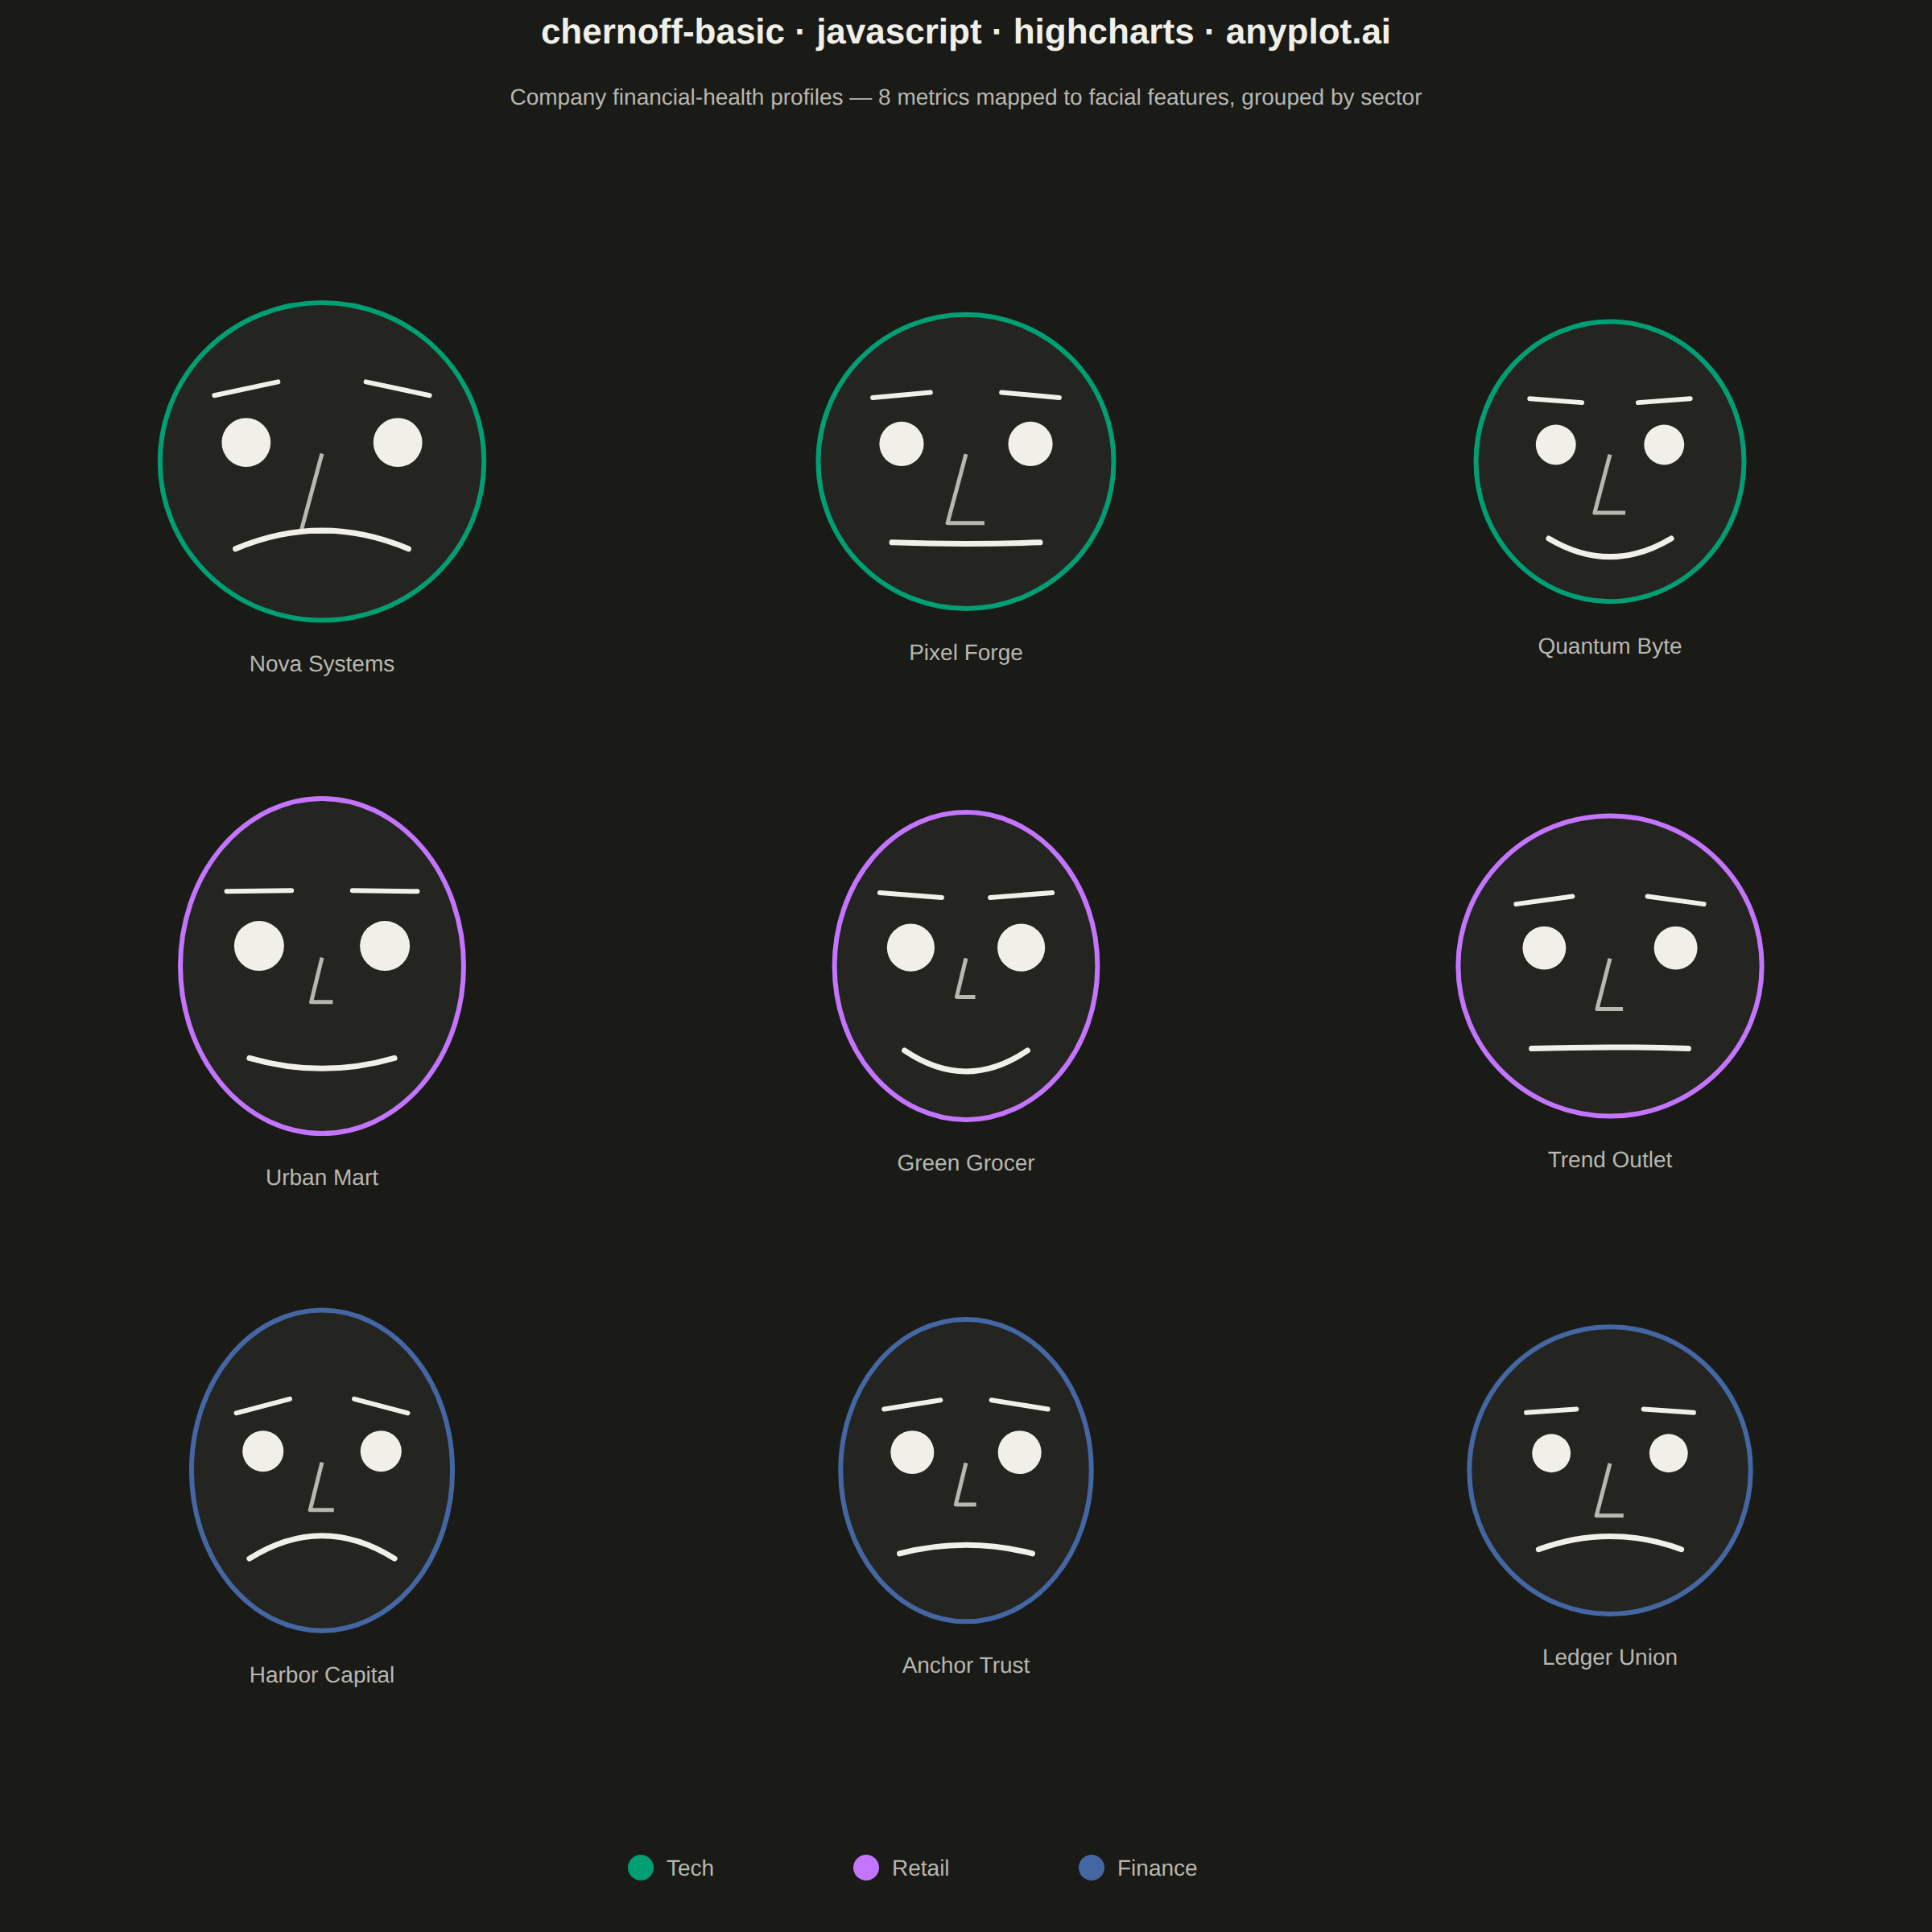
The same plot in 14 other libraries — JavaScript: Chart.js, D3.js, Apache ECharts, MUI X Charts; Python: Altair, Bokeh, lets-plot, Matplotlib, Plotly, plotnine, Pygal, Seaborn; R: ggplot2; Julia: Makie.jl. Compare all 15 side by side: Chernoff Faces for Multivariate Data in Python, R, Julia and JavaScript.
Chernoff faces visualize multivariate data by mapping each variable to a facial feature (eye size, mouth curvature, face width, nose length, etc.), transforming each observation into a unique cartoon face. This technique leverages humans' innate ability to recognize and distinguish faces, making it easier to identify patterns, clusters, and outliers across multiple dimensions simultaneously.
// anyplot.ai
// chernoff-basic: Chernoff Faces for Multivariate Data
// Library: highcharts 12.6.0 | JavaScript 22.23.2
// Quality: 89/100 | Created: 2026-09-02
//# anyplot-orientation: square

const t = window.ANYPLOT_TOKENS;

// --- Data (in-memory, deterministic) ----------------------------------------
// Eight financial-health metrics per company, each pre-normalized to 0-1, drive
// eight facial features. Companies are grouped by sector (colorizes the face
// outline) so clusters of similar profiles are easy to spot at a glance.
const sectorColor = { Tech: t.palette[0], Retail: t.palette[1], Finance: t.palette[2] };
const sectors = Object.keys(sectorColor);

const companies = [
  { name: "Nova Systems", sector: "Tech", revenue_growth: 0.9, market_share: 0.55, profit_margin: 0.78, customer_satisfaction: 0.72, debt_ratio: 0.22, innovation_index: 0.95, employee_engagement: 0.8, operating_efficiency: 0.7 },
  { name: "Pixel Forge", sector: "Tech", revenue_growth: 0.62, market_share: 0.32, profit_margin: 0.48, customer_satisfaction: 0.58, debt_ratio: 0.38, innovation_index: 0.78, employee_engagement: 0.6, operating_efficiency: 0.55 },
  { name: "Quantum Byte", sector: "Tech", revenue_growth: 0.35, market_share: 0.18, profit_margin: 0.22, customer_satisfaction: 0.45, debt_ratio: 0.6, innovation_index: 0.58, employee_engagement: 0.4, operating_efficiency: 0.35 },
  { name: "Urban Mart", sector: "Retail", revenue_growth: 0.5, market_share: 0.72, profit_margin: 0.34, customer_satisfaction: 0.75, debt_ratio: 0.48, innovation_index: 0.28, employee_engagement: 0.65, operating_efficiency: 0.6 },
  { name: "Green Grocer", sector: "Retail", revenue_growth: 0.3, market_share: 0.45, profit_margin: 0.18, customer_satisfaction: 0.68, debt_ratio: 0.62, innovation_index: 0.18, employee_engagement: 0.5, operating_efficiency: 0.4 },
  { name: "Trend Outlet", sector: "Retail", revenue_growth: 0.7, market_share: 0.38, profit_margin: 0.52, customer_satisfaction: 0.55, debt_ratio: 0.33, innovation_index: 0.42, employee_engagement: 0.58, operating_efficiency: 0.62 },
  { name: "Harbor Capital", sector: "Finance", revenue_growth: 0.28, market_share: 0.58, profit_margin: 0.85, customer_satisfaction: 0.48, debt_ratio: 0.14, innovation_index: 0.35, employee_engagement: 0.7, operating_efficiency: 0.8 },
  { name: "Anchor Trust", sector: "Finance", revenue_growth: 0.18, market_share: 0.4, profit_margin: 0.63, customer_satisfaction: 0.55, debt_ratio: 0.26, innovation_index: 0.24, employee_engagement: 0.55, operating_efficiency: 0.68 },
  { name: "Ledger Union", sector: "Finance", revenue_growth: 0.48, market_share: 0.25, profit_margin: 0.7, customer_satisfaction: 0.4, debt_ratio: 0.42, innovation_index: 0.46, employee_engagement: 0.48, operating_efficiency: 0.58 },
];

// --- Face drawing (Highcharts core SVGRenderer — no add-on module needed) ---
function ellipsePath(cx, cy, rx, ry) {
  return ["M", cx - rx, cy, "A", rx, ry, 0, 1, 0, cx + rx, cy, "A", rx, ry, 0, 1, 0, cx - rx, cy, "Z"];
}

function drawFace(renderer, cx, cy, size, d) {
  const faceRx = size * (0.32 + 0.14 * d.revenue_growth);
  const faceRy = size * (0.36 + 0.14 * d.market_share);
  const eyeR = size * (0.035 + 0.045 * d.customer_satisfaction);
  const eyeDx = faceRx * (0.34 + 0.16 * d.employee_engagement);
  const eyeDy = -faceRy * 0.12;
  const browSlant = (d.debt_ratio - 0.5) * faceRx * 0.5;
  const noseLen = size * (0.06 + 0.14 * d.innovation_index);
  const mouthCurve = (d.profit_margin - 0.5) * size * 0.36;
  const mouthHalfW = faceRx * (0.38 + 0.22 * d.operating_efficiency);
  const color = sectorColor[d.sector];
  const g = renderer.g().add();

  renderer
    .path(ellipsePath(cx, cy, faceRx, faceRy))
    .attr({ fill: t.elevatedBg, stroke: color, "stroke-width": 3 })
    .add(g);

  [-1, 1].forEach((side) => {
    renderer.circle(cx + side * eyeDx, cy + eyeDy, eyeR).attr({ fill: t.ink }).add(g);
  });

  [-1, 1].forEach((side) => {
    const bx = cx + side * eyeDx;
    const by = cy + eyeDy - eyeR * 2.2;
    const slant = side * browSlant * 0.3;
    renderer
      .path(["M", bx - eyeR * 1.3, by + slant, "L", bx + eyeR * 1.3, by - slant])
      .attr({ stroke: t.ink, "stroke-width": 3, "stroke-linecap": "round" })
      .add(g);
  });

  renderer
    .path(["M", cx, cy - faceRy * 0.05, "L", cx - noseLen * 0.3, cy + noseLen, "L", cx + noseLen * 0.3, cy + noseLen])
    .attr({ stroke: t.inkSoft, "stroke-width": 2.5, fill: "none", "stroke-linejoin": "round" })
    .add(g);

  const mouthY = cy + faceRy * 0.55;
  renderer
    .path(["M", cx - mouthHalfW, mouthY, "Q", cx, mouthY - mouthCurve, cx + mouthHalfW, mouthY])
    .attr({ stroke: t.ink, "stroke-width": 3.5, fill: "none", "stroke-linecap": "round" })
    .add(g);

  renderer
    .text(d.name, cx, cy + faceRy + 32)
    .attr({ align: "center" })
    .css({ color: t.inkSoft, fontSize: "14px" })
    .add(g);
}

// --- Chart -------------------------------------------------------------------
Highcharts.chart("container", {
  chart: {
    backgroundColor: "transparent",
    animation: false,
    style: { fontFamily: "inherit" },
    events: {
      load: function () {
        const renderer = this.renderer;
        const cols = 3;
        const rows = 3;
        const areaTop = 130;
        const legendAreaHeight = 130;
        const cellW = this.chartWidth / cols;
        const cellH = (this.chartHeight - areaTop - legendAreaHeight) / rows;
        const faceSize = Math.min(cellW, cellH) * 0.72;

        companies.forEach((d, i) => {
          const col = i % cols;
          const row = Math.floor(i / cols);
          const cx = cellW * (col + 0.5);
          const cy = areaTop + cellH * (row + 0.5);
          drawFace(renderer, cx, cy, faceSize, d);
        });

        const legendY = this.chartHeight - 40;
        let lx = this.chartWidth / 2 - (sectors.length * 140) / 2;
        sectors.forEach((s) => {
          renderer.circle(lx + 8, legendY, 8).attr({ fill: sectorColor[s] }).add();
          renderer.text(s, lx + 24, legendY + 5).css({ color: t.inkSoft, fontSize: "14px" }).add();
          lx += 140;
        });

        window.__anyplotReady = true;
      },
    },
  },
  title: {
    text: "chernoff-basic · javascript · highcharts · anyplot.ai",
    style: { color: t.ink, fontSize: "22px", fontWeight: "600" },
  },
  subtitle: {
    text: "Company financial-health profiles — 8 metrics mapped to facial features, grouped by sector",
    style: { color: t.inkSoft, fontSize: "14px" },
    y: 55,
  },
  credits: { enabled: false },
  xAxis: { visible: false },
  yAxis: { visible: false },
  legend: { enabled: false },
  plotOptions: { series: { animation: false } },
  series: [],
});
Runnable source as JSON, for any HTTP client: https://api.anyplot.ai/specs/chernoff-basic/highcharts/code. Any spec id and library id listed in llms-full.txt fit the same URL shape; every URL below is complete and callable.
{
  "spec_id": "chernoff-basic",
  "language": "javascript",
  "library": "highcharts",
  "page": "https://anyplot.ai/chernoff-basic/javascript/highcharts",
  "hub": "https://anyplot.ai/chernoff-basic",
  "code_json": "https://api.anyplot.ai/specs/chernoff-basic/highcharts/code",
  "spec_json": "https://api.anyplot.ai/specs/chernoff-basic",
  "render_light_png": "https://storage.googleapis.com/anyplot-images/plots/chernoff-basic/javascript/highcharts/plot-light.png",
  "render_dark_png": "https://storage.googleapis.com/anyplot-images/plots/chernoff-basic/javascript/highcharts/plot-dark.png",
  "interactive_light_html": "https://storage.googleapis.com/anyplot-images/plots/chernoff-basic/javascript/highcharts/plot-light.html",
  "interactive_dark_html": "https://storage.googleapis.com/anyplot-images/plots/chernoff-basic/javascript/highcharts/plot-dark.html",
  "quality_score": 89.0,
  "license": "MIT",
  "guide": "https://anyplot.ai/llms.txt"
}
Part of Chernoff Faces for Multivariate Data on anyplot.ai.