The same plot in 14 other libraries — JavaScript: D3.js, Apache ECharts, Highcharts, MUI X Charts; Python: Altair, Bokeh, lets-plot, Matplotlib, Plotly, plotnine, Pygal, Seaborn; R: ggplot2; Julia: Makie.jl. Compare all 15 side by side: Circos Plot in Python, R, Julia and JavaScript.
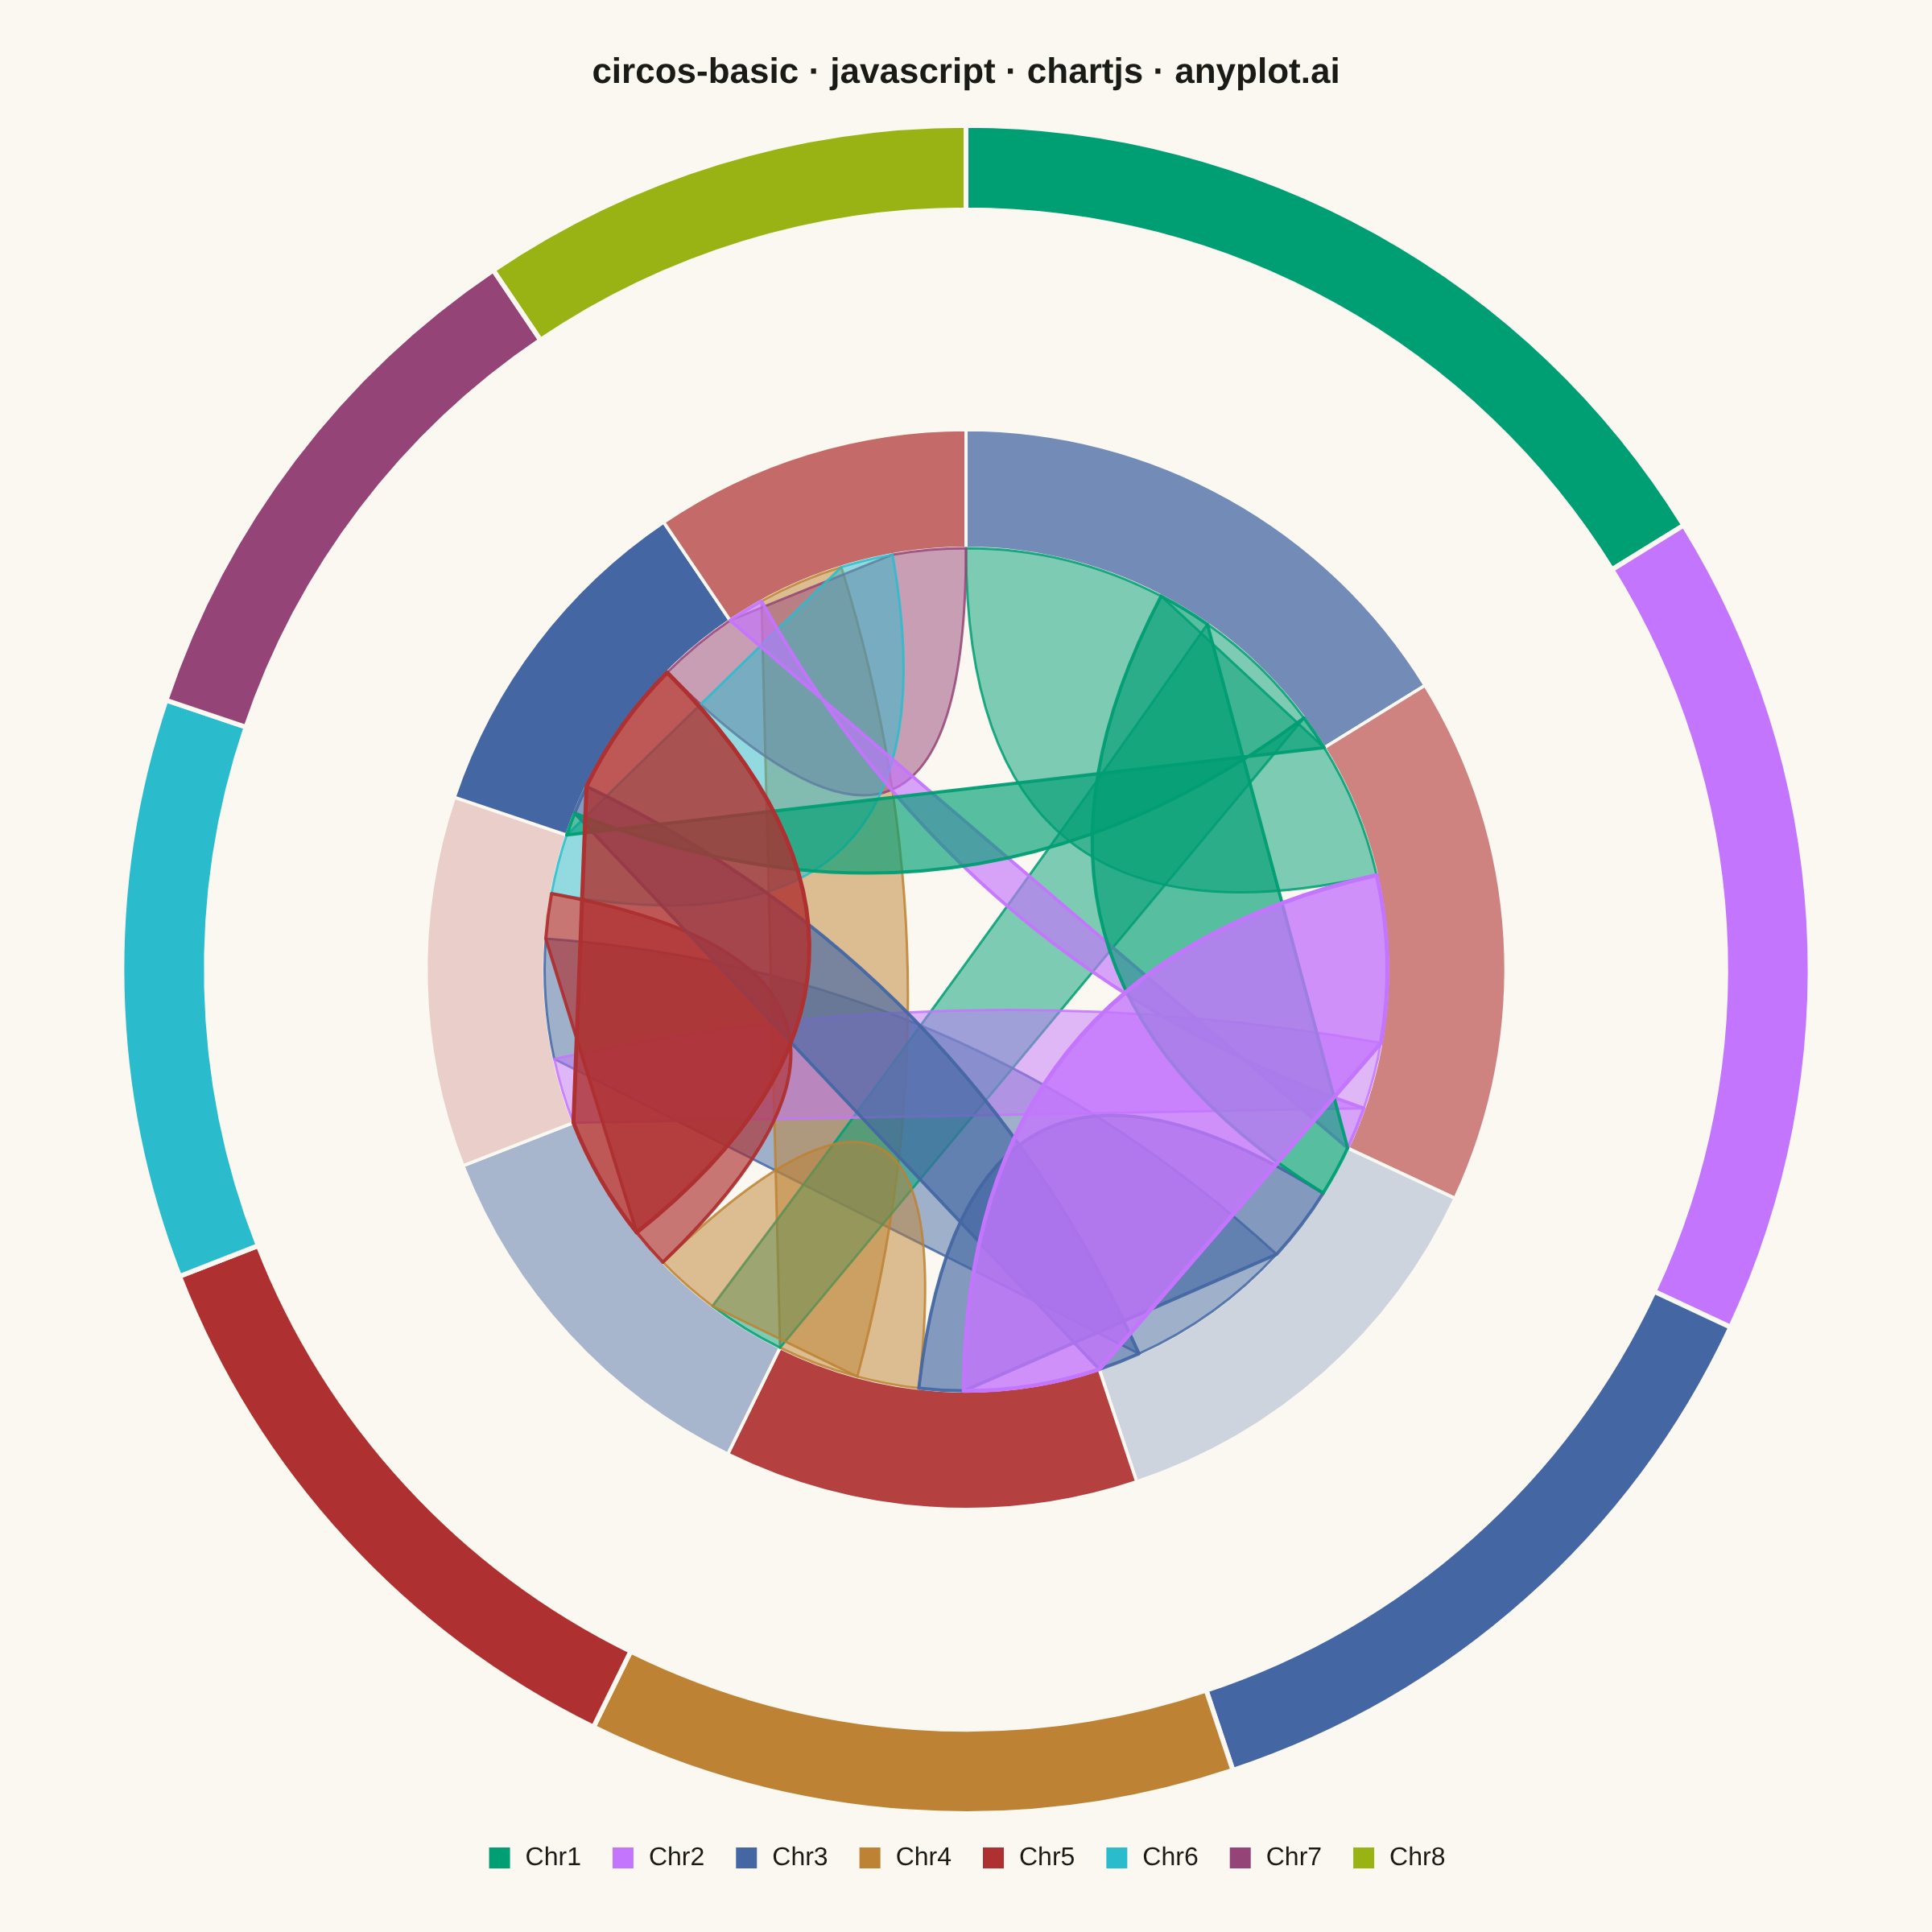
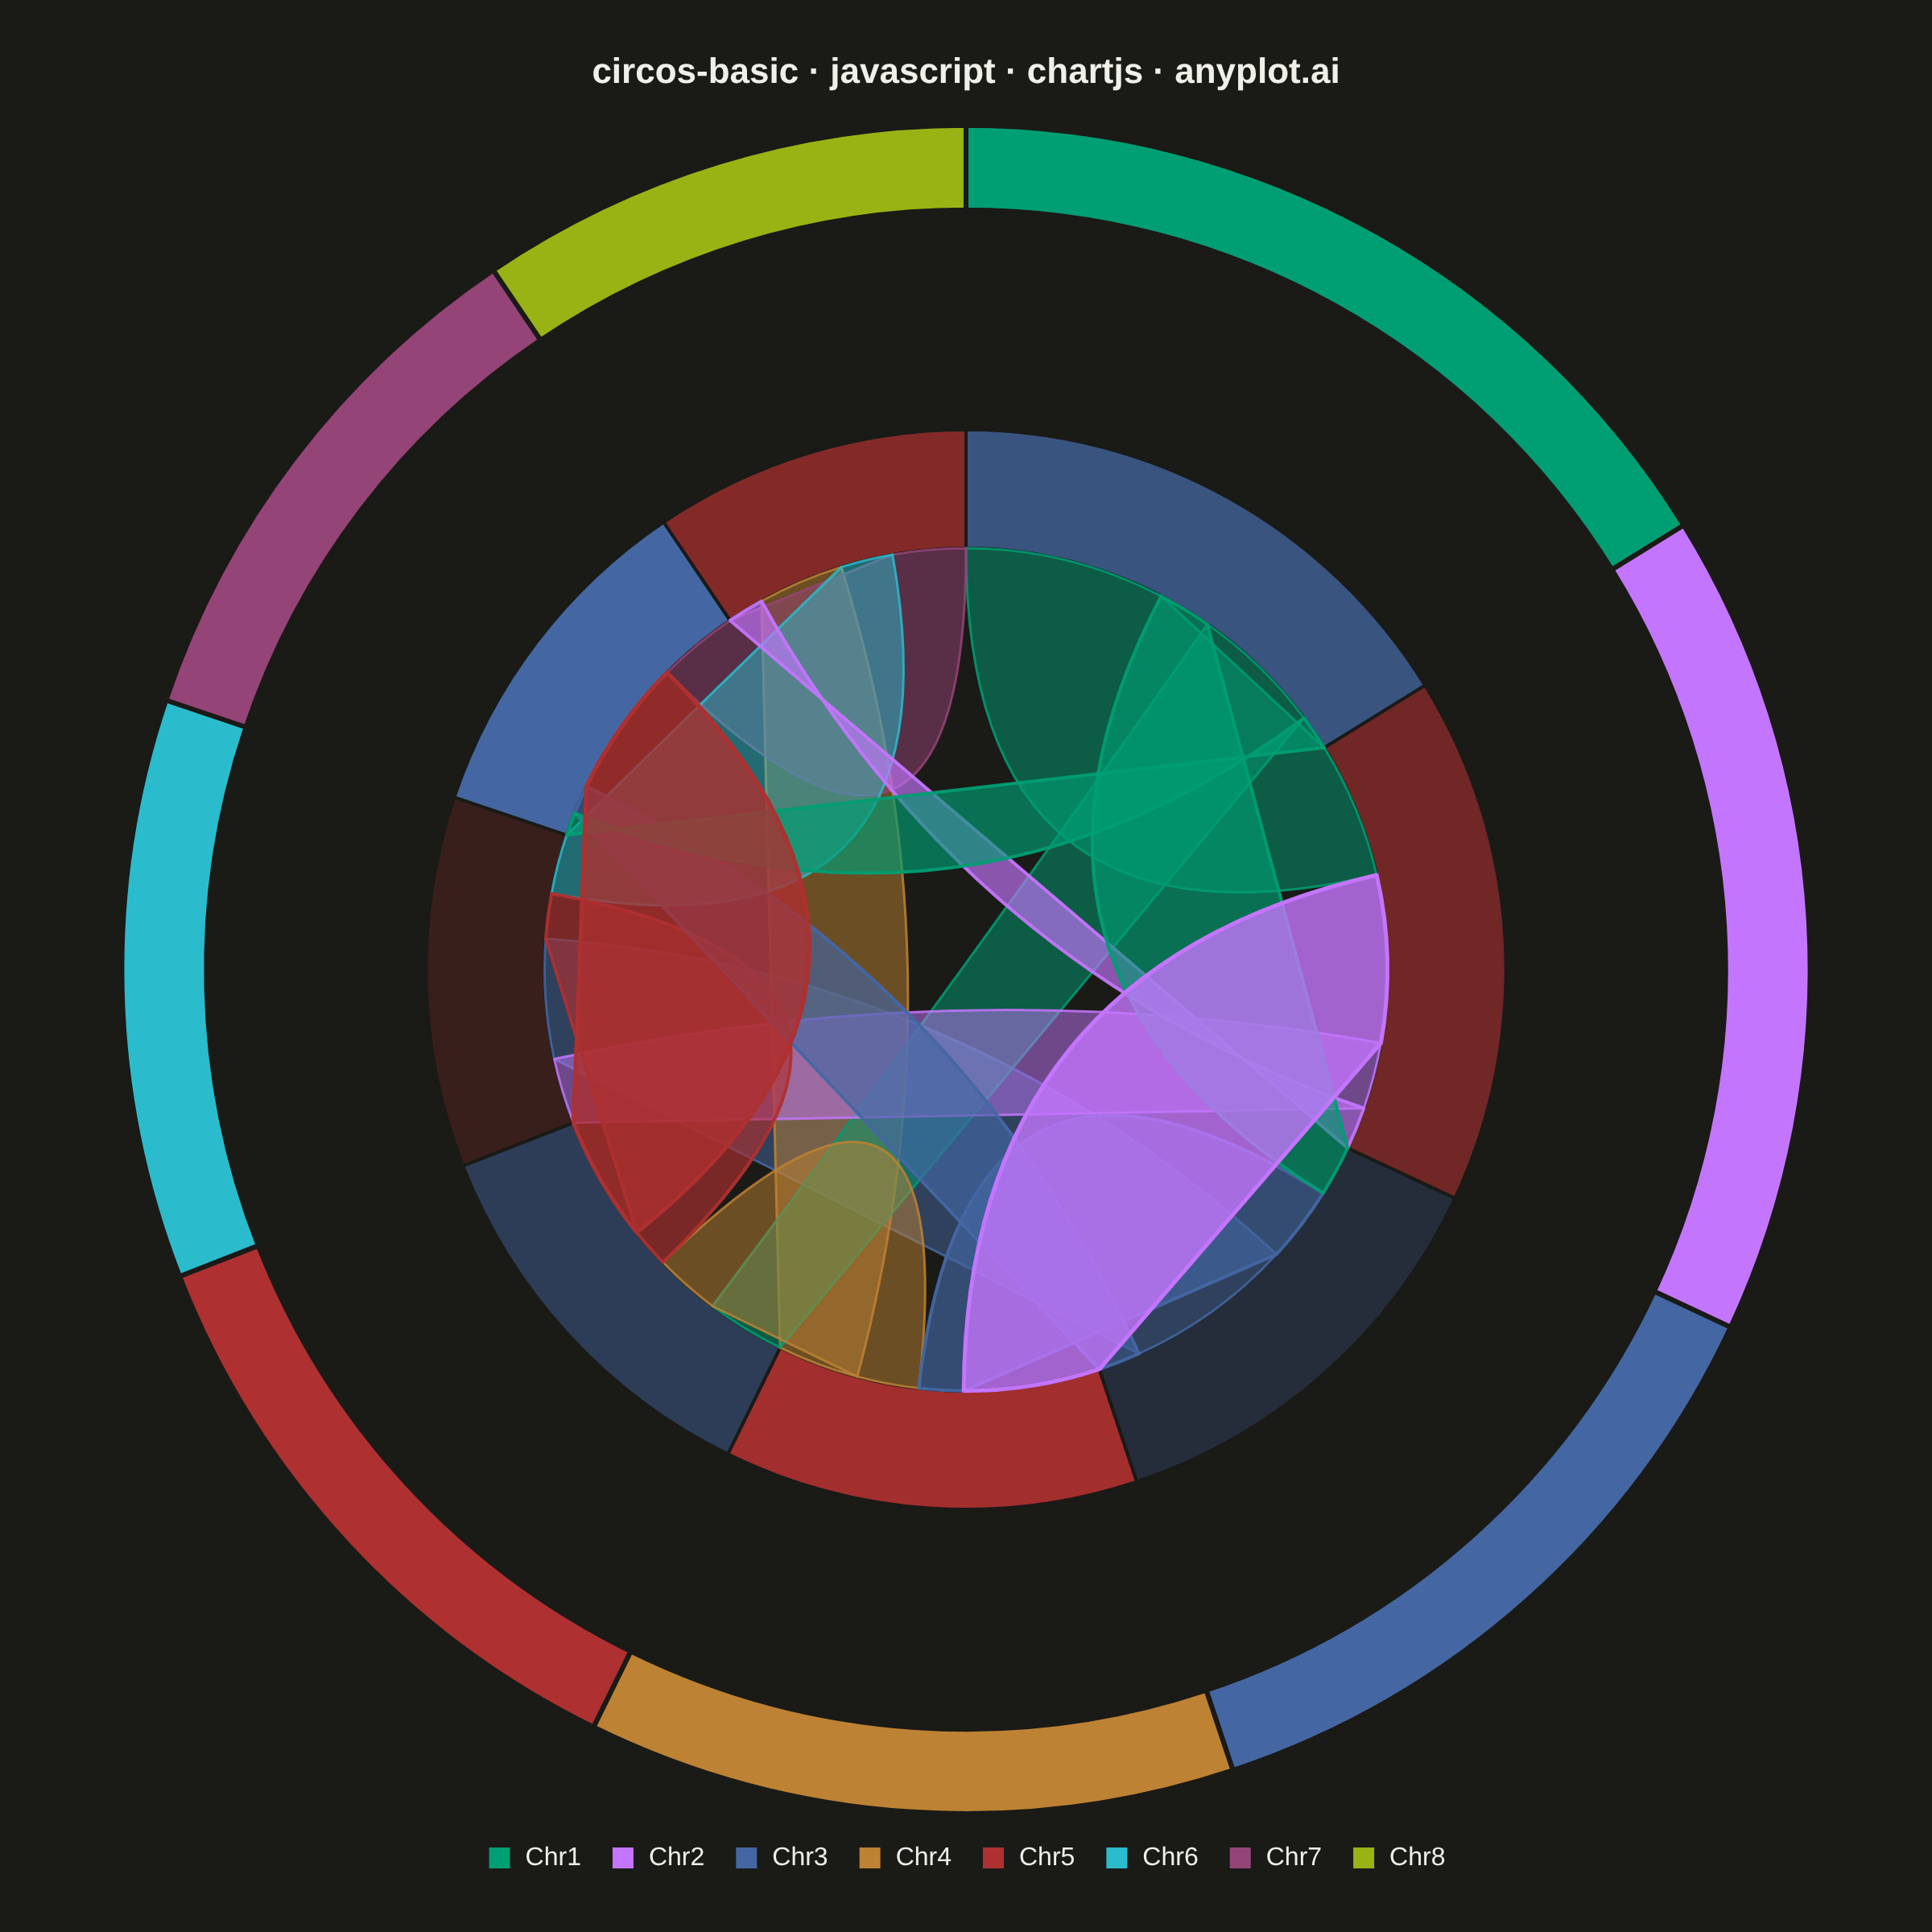
A Circos plot is a circular visualization that displays data on concentric tracks arranged around a circle, with ribbons or arcs connecting related segments across the circular layout. Originally designed for genomic data visualization, it excels at showing relationships between segments while simultaneously displaying multiple data attributes on different tracks. The circular arrangement makes efficient use of space and reveals patterns in complex relational data.
// anyplot.ai
// circos-basic: Circos Plot
// Library: chartjs 4.4.7 | JavaScript 22.23.2
// Quality: 93/100 | Created: 2026-09-04
//# anyplot-orientation: square

const t = window.ANYPLOT_TOKENS;

// --- Data: structural-variant links across 8 chromosome segments -----------
// Segment arc length is proportional to chromosome size (Mb, approximate
// human karyotype lengths for chr1-chr8). An inner track carries a second
// data layer (differential expression, log2 fold-change) rendered as a
// diverging-color band, and ribbons bow through the centre to show
// inter-chromosomal structural-variant links (supporting read count).
const chromNames = ["Chr1", "Chr2", "Chr3", "Chr4", "Chr5", "Chr6", "Chr7", "Chr8"];
const segmentSizes = [248, 242, 198, 190, 181, 170, 159, 145]; // Mb
const expression = [1.8, -1.4, 0.6, -2.2, 1.1, -0.5, 2.4, -1.7]; // log2FC

// [from, to, supportingReads] — undirected structural-variant links.
const links = [
  [0, 1, 45], [0, 2, 12], [0, 4, 30], [0, 6, 8],
  [1, 3, 55], [1, 5, 22], [1, 7, 14],
  [2, 3, 18], [2, 5, 40], [2, 6, 10],
  [3, 4, 25], [3, 7, 33],
  [4, 5, 15], [4, 6, 48],
  [5, 7, 20],
  [6, 7, 28],
];

const n = chromNames.length;
const linkMatrix = Array.from({ length: n }, () => new Array(n).fill(0));
for (const [i, j, value] of links) {
  linkMatrix[i][j] = value;
  linkMatrix[j][i] = value;
}
const nodeTotal = linkMatrix.map((row) => row.reduce((a, b) => a + b, 0));

// Each chromosome keeps a distinct Imprint hue (brand green leads at slot 0).
const segmentColors = chromNames.map((_, i) => t.palette[i % t.palette.length]);

// --- Diverging colormap (imprint_div) for the expression track --------------
const hexToRgb = (hex) => {
  const h = hex.replace("#", "");
  return [parseInt(h.slice(0, 2), 16), parseInt(h.slice(2, 4), 16), parseInt(h.slice(4, 6), 16)];
};
const rgbToHex = ([r, g, b]) =>
  `#${[r, g, b].map((v) => Math.round(v).toString(16).padStart(2, "0")).join("")}`;
const lerpRgb = (a, b, f) => a.map((v, i) => v + (b[i] - v) * f);

const [divNeg, divMid, divPos] = t.div.map(hexToRgb);
const maxAbsExpression = Math.max(...expression.map(Math.abs));
const divergingColor = (value) => {
  const u = 0.5 + 0.5 * (value / maxAbsExpression); // 0..1, 0.5 = midpoint
  return u < 0.5 ? rgbToHex(lerpRgb(divNeg, divMid, u / 0.5)) : rgbToHex(lerpRgb(divMid, divPos, (u - 0.5) / 0.5));
};
const trackColors = expression.map(divergingColor);

const hexToRgba = (hex, alpha) => {
  const [r, g, b] = hexToRgb(hex);
  return `rgba(${r}, ${g}, ${b}, ${alpha})`;
};

// --- Structural-variant ribbon plugin ---------------------------------------
// Chart.js has no native circos/chord type, but its plugin API exposes the
// live canvas plus the doughnut's computed arc geometry. Ribbons anchor to
// the inner edge of the expression track (dataset 1) and bow through the
// centre; ribbon end-width is proportional to link strength. Weak links get
// an opacity/stroke floor so they stay legible under denser overlaps, and
// the top 2 links by supporting-read count are redrawn last (on top of
// everything) with a heavier stroke so the strongest relationships read as
// a clear focal point. No external library, no community plugin: pure
// Chart.js extensibility (same technique used for chord-basic's ribbons,
// generalised here to a sparse link list plus a second concentric data
// track).
const linkValues = links.map(([, , value]) => value);
const lowValueThreshold = Math.min(...linkValues) + (Math.max(...linkValues) - Math.min(...linkValues)) * 0.25;
const focalLinkCount = 2;
const circosRibbons = {
  id: "circosRibbons",
  afterDatasetsDraw(chart) {
    const segmentArcs = chart.getDatasetMeta(0).data;
    const trackArcs = chart.getDatasetMeta(1).data;
    if (!segmentArcs.length || !trackArcs.length) return;

    const { x: cx, y: cy } = segmentArcs[0].getProps(["x", "y"], true);
    const innerR = trackArcs[0].getProps(["innerRadius"], true).innerRadius;

    // Angular interval [a0, a1] of every ordered slot (i -> j) inside arc i,
    // sized proportional to that link's share of node i's total link value.
    const slot = segmentArcs.map((arc, i) => {
      const { startAngle, endAngle } = arc.getProps(["startAngle", "endAngle"], true);
      const span = endAngle - startAngle;
      let acc = 0;
      return linkMatrix[i].map((value) => {
        const a0 = startAngle + (acc / nodeTotal[i]) * span;
        acc += value;
        const a1 = startAngle + (acc / nodeTotal[i]) * span;
        return [a0, a1];
      });
    });

    const pointAt = (angle, r) => [cx + r * Math.cos(angle), cy + r * Math.sin(angle)];

    const pairsByValue = links.map(([i, j, value]) => [i, j, value]).sort((a, b) => b[2] - a[2]);
    const focalPairs = pairsByValue.slice(0, focalLinkCount);
    const normalPairs = pairsByValue.slice(focalLinkCount);

    const ctx = chart.ctx;
    ctx.save();
    ctx.lineJoin = "round";

    const drawRibbon = (i, j, { fillAlpha, strokeAlpha, lineWidth }) => {
      const [si0, si1] = slot[i][j];
      const [sj0, sj1] = slot[j][i];
      const [xi, yi] = pointAt(si0, innerR);
      const [xj, yj] = pointAt(sj0, innerR);

      ctx.beginPath();
      ctx.moveTo(xi, yi);
      ctx.arc(cx, cy, innerR, si0, si1);    // ride segment i's inner edge
      ctx.lineTo(xj, yj);
      ctx.arc(cx, cy, innerR, sj0, sj1);    // ride segment j's inner edge
      ctx.quadraticCurveTo(cx, cy, xi, yi); // bow back through the centre
      ctx.closePath();

      const dominant = linkMatrix[i][j] >= linkMatrix[j][i] ? i : j;
      ctx.fillStyle = hexToRgba(segmentColors[dominant], fillAlpha);
      ctx.lineWidth = lineWidth;
      ctx.strokeStyle = hexToRgba(segmentColors[dominant], strokeAlpha);
      ctx.fill();
      ctx.stroke();
    };

    // Strongest-of-the-rest first, weakest last (so weak links sit on top of
    // the normal group); each weak link gets an opacity/stroke floor so it
    // does not disappear under denser overlaps.
    for (const [i, j, value] of normalPairs) {
      const isFaint = value <= lowValueThreshold;
      drawRibbon(i, j, {
        fillAlpha: isFaint ? 0.65 : 0.5,
        strokeAlpha: isFaint ? 0.95 : 0.85,
        lineWidth: isFaint ? 2 : 1.5,
      });
    }
    // Focal links redrawn last, on top of every other ribbon, with a
    // heavier stroke so the strongest relationships read as a clear story.
    for (const [i, j] of focalPairs) {
      drawRibbon(i, j, { fillAlpha: 0.8, strokeAlpha: 1, lineWidth: 2.5 });
    }
    ctx.restore();
  },
};

// --- Mount -------------------------------------------------------------------
const canvas = document.createElement("canvas");
document.getElementById("container").appendChild(canvas);

// --- Chart: two concentric doughnut rings (segments + expression track) ----
// plus the structural-variant ribbon plugin bowing through the centre.
new Chart(canvas, {
  type: "doughnut",
  data: {
    labels: chromNames,
    datasets: [
      {
        label: "Chromosome",
        data: segmentSizes,
        backgroundColor: segmentColors,
        borderColor: t.pageBg,
        borderWidth: 3,
        radius: "100%",
        cutout: "80%",
      },
      {
        label: "Differential expression",
        data: segmentSizes,
        backgroundColor: trackColors,
        borderColor: t.pageBg,
        borderWidth: 2,
        radius: "78%",
        cutout: "64%",
      },
    ],
  },
  options: {
    responsive: true,
    maintainAspectRatio: false,
    animation: false,
    layout: { padding: 28 },
    plugins: {
      title: {
        display: true,
        text: "circos-basic · javascript · chartjs · anyplot.ai",
        color: t.ink,
        font: { size: 22, weight: "600" },
        padding: { top: 4, bottom: 18 },
      },
      legend: {
        position: "bottom",
        labels: {
          color: t.ink,
          font: { size: 16 },
          padding: 18,
          boxWidth: 16,
          boxHeight: 16,
        },
      },
      tooltip: {
        callbacks: {
          label: (item) =>
            item.datasetIndex === 0
              ? `${item.label}: ${item.parsed} Mb`
              : `${item.label} expression: ${expression[item.dataIndex].toFixed(1)} log2FC`,
        },
      },
    },
  },
  plugins: [circosRibbons],
});
Runnable source as JSON, for any HTTP client: https://api.anyplot.ai/specs/circos-basic/chartjs/code. Any spec id and library id listed in llms-full.txt fit the same URL shape; every URL below is complete and callable.
{
  "spec_id": "circos-basic",
  "language": "javascript",
  "library": "chartjs",
  "page": "https://anyplot.ai/circos-basic/javascript/chartjs",
  "hub": "https://anyplot.ai/circos-basic",
  "code_json": "https://api.anyplot.ai/specs/circos-basic/chartjs/code",
  "spec_json": "https://api.anyplot.ai/specs/circos-basic",
  "render_light_png": "https://storage.googleapis.com/anyplot-images/plots/circos-basic/javascript/chartjs/plot-light.png",
  "render_dark_png": "https://storage.googleapis.com/anyplot-images/plots/circos-basic/javascript/chartjs/plot-dark.png",
  "interactive_light_html": "https://storage.googleapis.com/anyplot-images/plots/circos-basic/javascript/chartjs/plot-light.html",
  "interactive_dark_html": "https://storage.googleapis.com/anyplot-images/plots/circos-basic/javascript/chartjs/plot-dark.html",
  "quality_score": 93.0,
  "license": "MIT",
  "guide": "https://anyplot.ai/llms.txt"
}
Part of Circos Plot on anyplot.ai.