The same plot in 14 other libraries — JavaScript: Chart.js, Apache ECharts, Highcharts, MUI X Charts; Python: Altair, Bokeh, lets-plot, Matplotlib, Plotly, plotnine, Pygal, Seaborn; R: ggplot2; Julia: Makie.jl. Compare all 15 side by side: Circos Plot in Python, R, Julia and JavaScript.
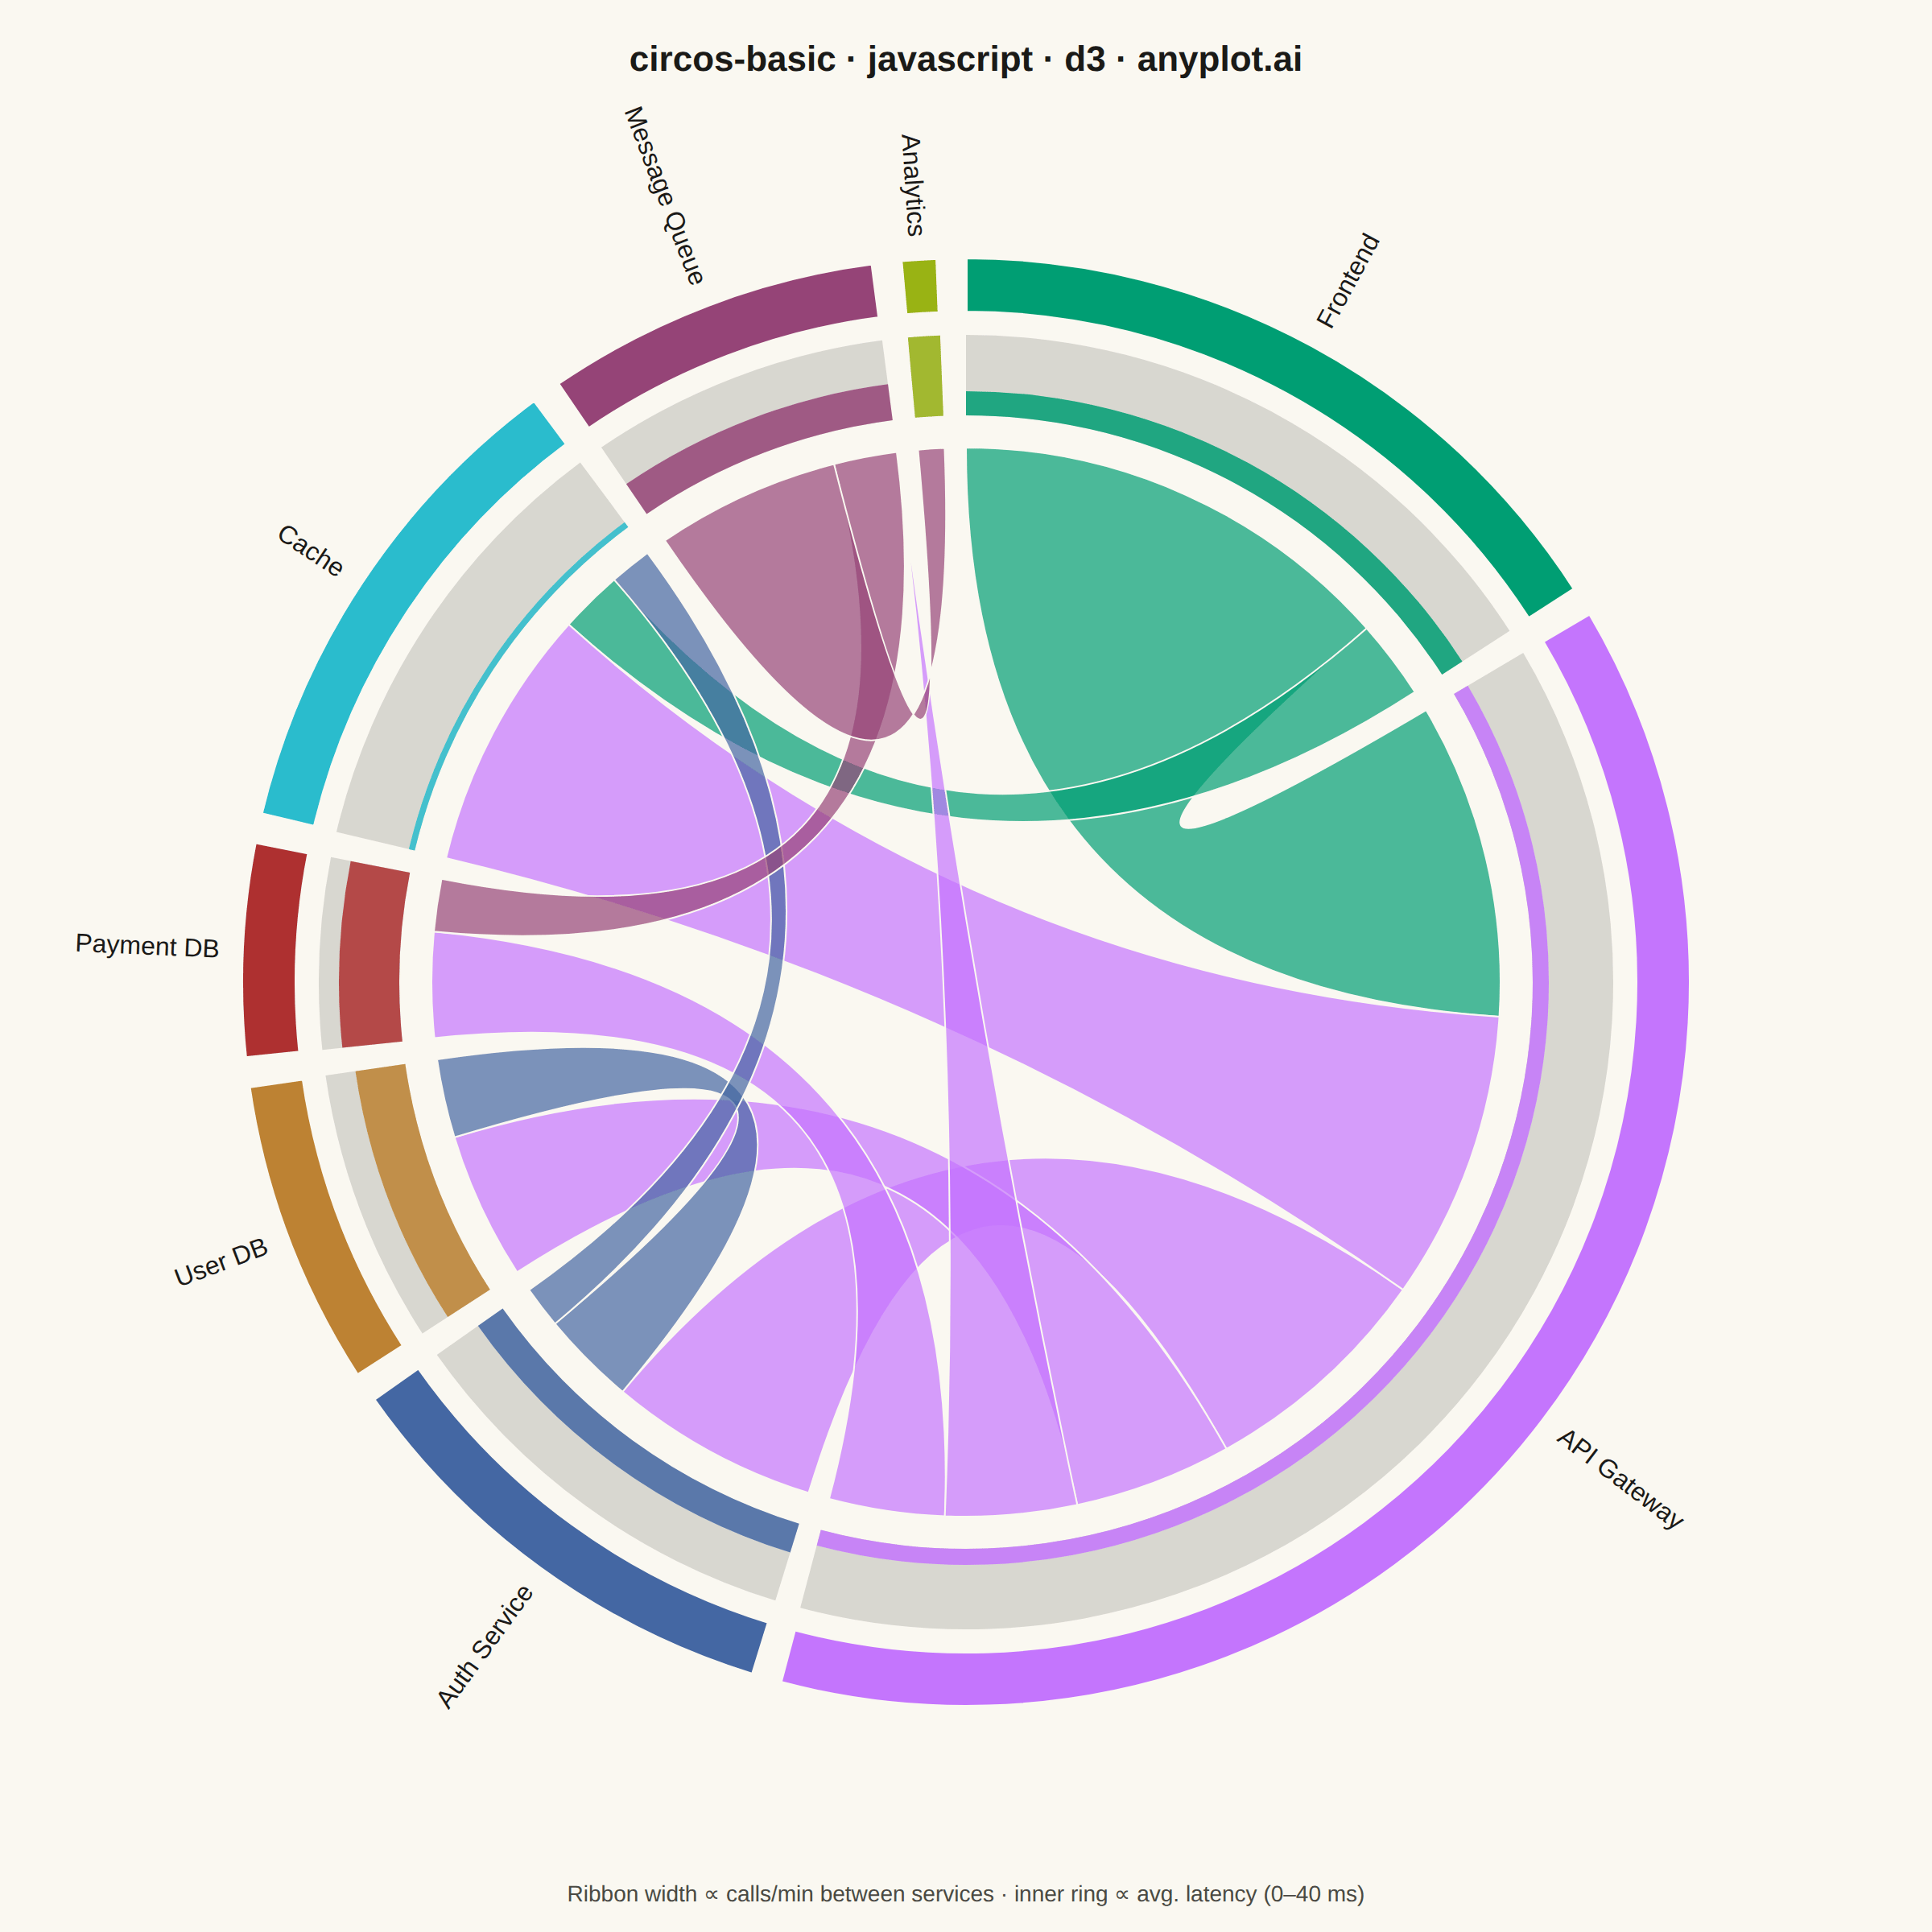
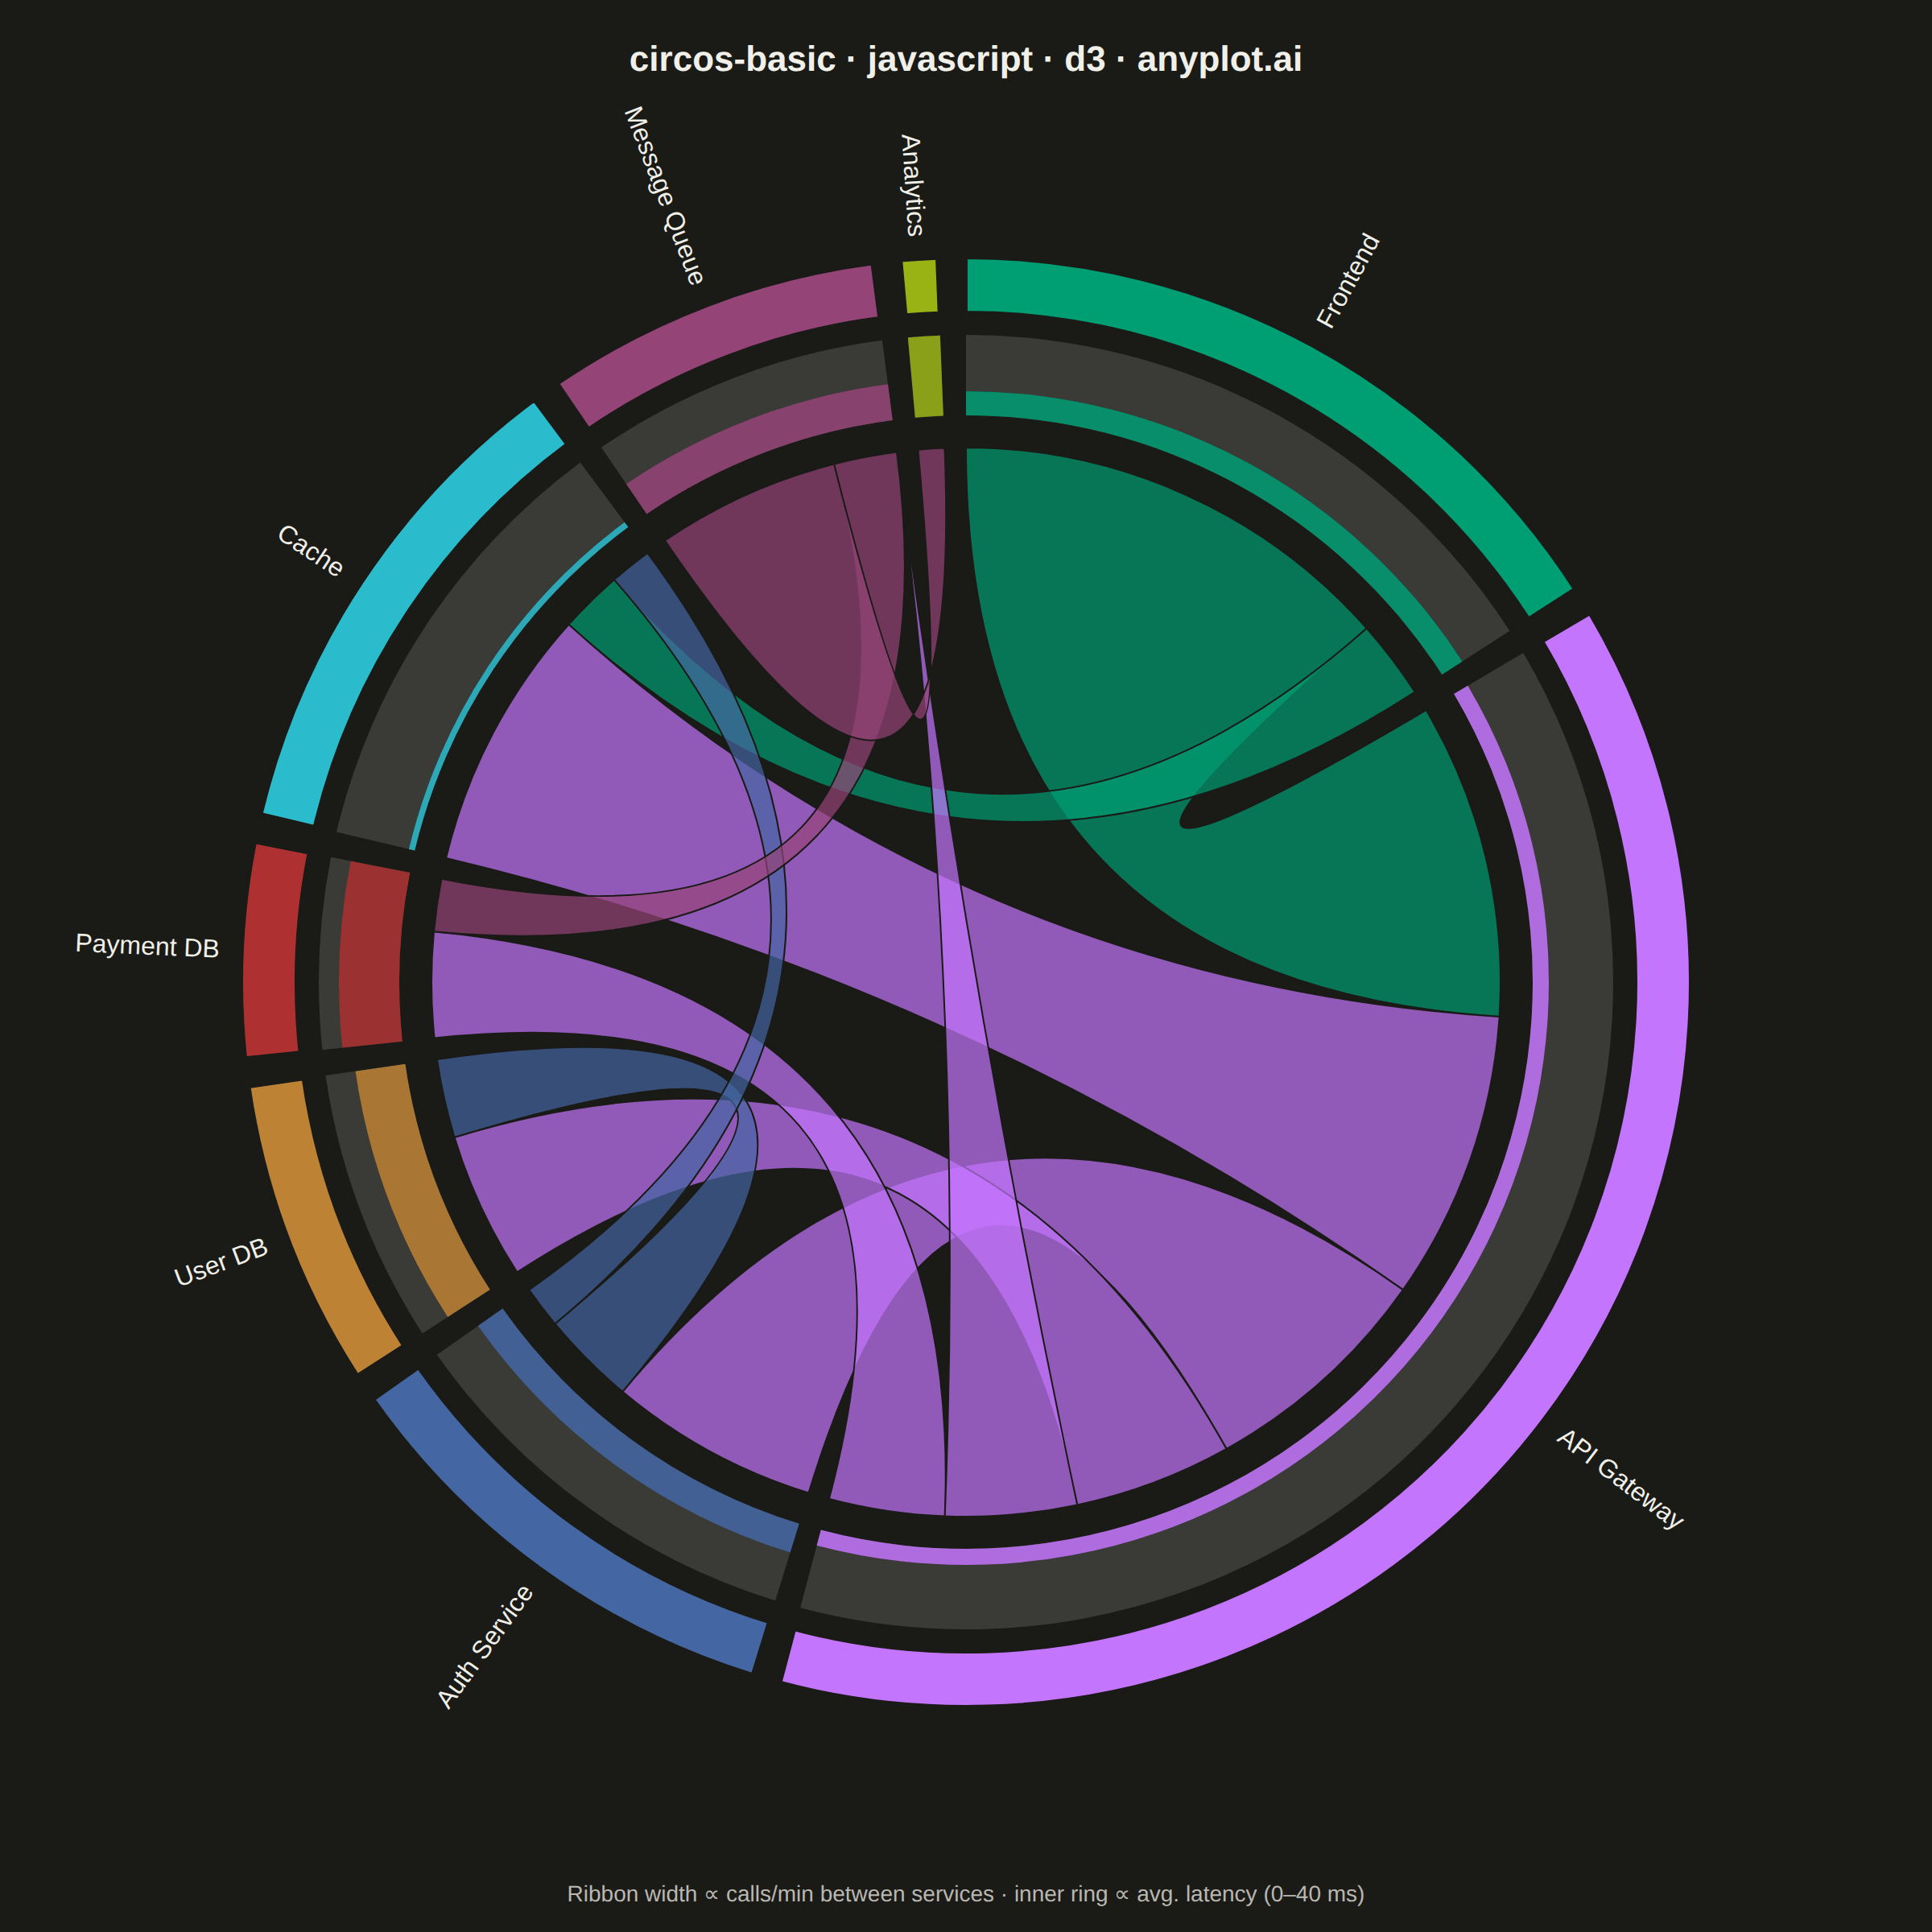
A Circos plot is a circular visualization that displays data on concentric tracks arranged around a circle, with ribbons or arcs connecting related segments across the circular layout. Originally designed for genomic data visualization, it excels at showing relationships between segments while simultaneously displaying multiple data attributes on different tracks. The circular arrangement makes efficient use of space and reveals patterns in complex relational data.
// anyplot.ai
// circos-basic: Circos Plot
// Library: d3 7.9.0 | JavaScript 22.23.2
// Quality: 90/100 | Created: 2026-09-04

//# anyplot-orientation: square

const t = window.ANYPLOT_TOKENS;
const { width, height } = window.ANYPLOT_SIZE;

// --- Data (in-memory, deterministic) ----------------------------------------
// Inter-service call volume (calls / minute) between microservice modules.
const services = [
  "Frontend",
  "API Gateway",
  "Auth Service",
  "User DB",
  "Payment DB",
  "Cache",
  "Message Queue",
  "Analytics",
];

// matrix[i][j] = calls/min routed from services[i] to services[j]
const matrix = [
  [0, 85, 0, 0, 0, 15, 0, 0],
  [60, 0, 45, 30, 22, 55, 25, 0],
  [0, 40, 0, 18, 0, 8, 0, 0],
  [0, 28, 15, 0, 0, 0, 0, 0],
  [0, 20, 0, 0, 0, 0, 10, 0],
  [12, 50, 8, 0, 0, 0, 0, 0],
  [0, 0, 0, 0, 12, 0, 0, 35],
  [0, 0, 0, 0, 0, 0, 5, 0],
];

// Inner track: average response latency (ms) per service.
const latencyMs = [12, 8, 15, 25, 30, 3, 18, 40];
const maxLatency = d3.max(latencyMs);

// --- Layout -------------------------------------------------------------
const titleSpace = 70;
const captionSpace = 50;
const sideMargin = 40;
const labelPad = 90;

const drawableW = width - sideMargin * 2;
const drawableH = height - titleSpace - captionSpace;
const outerRadius = Math.min(drawableW, drawableH) / 2 - labelPad;
const cx = width / 2;
const cy = titleSpace + drawableH / 2;

const segmentOuter = outerRadius;
const segmentInner = outerRadius - 34;
const trackOuter = segmentInner - 14;
const trackInner = trackOuter - 50;
const ribbonRadius = trackInner - 20;

const trackScale = d3.scaleLinear().domain([0, maxLatency]).range([0, trackOuter - trackInner]);

// --- Chord layout ------------------------------------------------------
const chordLayout = d3.chord().padAngle(0.04).sortSubgroups(d3.descending);
const chords = chordLayout(matrix);

// --- SVG mount -----------------------------------------------------------
const svg = d3.select("#container").append("svg").attr("width", width).attr("height", height);
const g = svg.append("g").attr("transform", `translate(${cx},${cy})`);

// --- Ribbons (connections between segments) -------------------------------
const ribbon = d3.ribbon().radius(ribbonRadius);
g.append("g")
  .attr("fill-opacity", 0.7)
  .selectAll("path")
  .data(chords)
  .join("path")
  .attr("d", ribbon)
  .attr("fill", (d) => t.palette[d.source.index])
  .attr("stroke", t.pageBg)
  .attr("stroke-width", 1);

// --- Segment groups ----------------------------------------------------
const group = g.append("g").selectAll("g").data(chords.groups).join("g");

// track background (full-scale reference band)
const trackArc = d3.arc().innerRadius(trackInner).outerRadius(trackOuter);
group.append("path").attr("d", trackArc).attr("fill", t.grid);

// track value (latency, scaled from the shared baseline)
group
  .append("path")
  .attr(
    "d",
    (d) => d3.arc().innerRadius(trackInner).outerRadius(trackInner + trackScale(latencyMs[d.index]))(d),
  )
  .attr("fill", (d) => t.palette[d.index])
  .attr("fill-opacity", 0.85);

// outer segment arc
const segmentArc = d3.arc().innerRadius(segmentInner).outerRadius(segmentOuter);
group
  .append("path")
  .attr("d", segmentArc)
  .attr("fill", (d) => t.palette[d.index])
  .attr("stroke", t.pageBg)
  .attr("stroke-width", 2);

// segment labels
group
  .append("text")
  .each((d) => {
    d.midAngle = (d.startAngle + d.endAngle) / 2;
  })
  .attr("dy", "0.35em")
  .attr(
    "transform",
    (d) => `
      rotate(${(d.midAngle * 180) / Math.PI - 90})
      translate(${segmentOuter + 14})
      ${d.midAngle > Math.PI ? "rotate(180)" : ""}
    `,
  )
  .attr("text-anchor", (d) => (d.midAngle > Math.PI ? "end" : "start"))
  .attr("fill", t.ink)
  .style("font-size", "16px")
  .style("font-weight", "500")
  .text((d) => services[d.index]);

// --- Title ---------------------------------------------------------------
svg
  .append("text")
  .attr("x", width / 2)
  .attr("y", 44)
  .attr("text-anchor", "middle")
  .attr("fill", t.ink)
  .style("font-size", "22px")
  .style("font-weight", "600")
  .text("circos-basic · javascript · d3 · anyplot.ai");

// --- Caption (encoding legend) ---------------------------------------------
svg
  .append("text")
  .attr("x", width / 2)
  .attr("y", height - captionSpace / 2 + 6)
  .attr("text-anchor", "middle")
  .attr("fill", t.inkSoft)
  .style("font-size", "14px")
  .text(`Ribbon width ∝ calls/min between services · inner ring ∝ avg. latency (0–${maxLatency} ms)`);
Runnable source as JSON, for any HTTP client: https://api.anyplot.ai/specs/circos-basic/d3/code. Any spec id and library id listed in llms-full.txt fit the same URL shape; every URL below is complete and callable.
{
  "spec_id": "circos-basic",
  "language": "javascript",
  "library": "d3",
  "page": "https://anyplot.ai/circos-basic/javascript/d3",
  "hub": "https://anyplot.ai/circos-basic",
  "code_json": "https://api.anyplot.ai/specs/circos-basic/d3/code",
  "spec_json": "https://api.anyplot.ai/specs/circos-basic",
  "render_light_png": "https://storage.googleapis.com/anyplot-images/plots/circos-basic/javascript/d3/plot-light.png",
  "render_dark_png": "https://storage.googleapis.com/anyplot-images/plots/circos-basic/javascript/d3/plot-dark.png",
  "interactive_light_html": "https://storage.googleapis.com/anyplot-images/plots/circos-basic/javascript/d3/plot-light.html",
  "interactive_dark_html": "https://storage.googleapis.com/anyplot-images/plots/circos-basic/javascript/d3/plot-dark.html",
  "quality_score": 90.0,
  "license": "MIT",
  "guide": "https://anyplot.ai/llms.txt"
}
Part of Circos Plot on anyplot.ai.