The same plot in 14 other libraries — JavaScript: Chart.js, D3.js, Highcharts, MUI X Charts; Python: Altair, Bokeh, lets-plot, Matplotlib, Plotly, plotnine, Pygal, Seaborn; R: ggplot2; Julia: Makie.jl. Compare all 15 side by side: Circos Plot in Python, R, Julia and JavaScript.
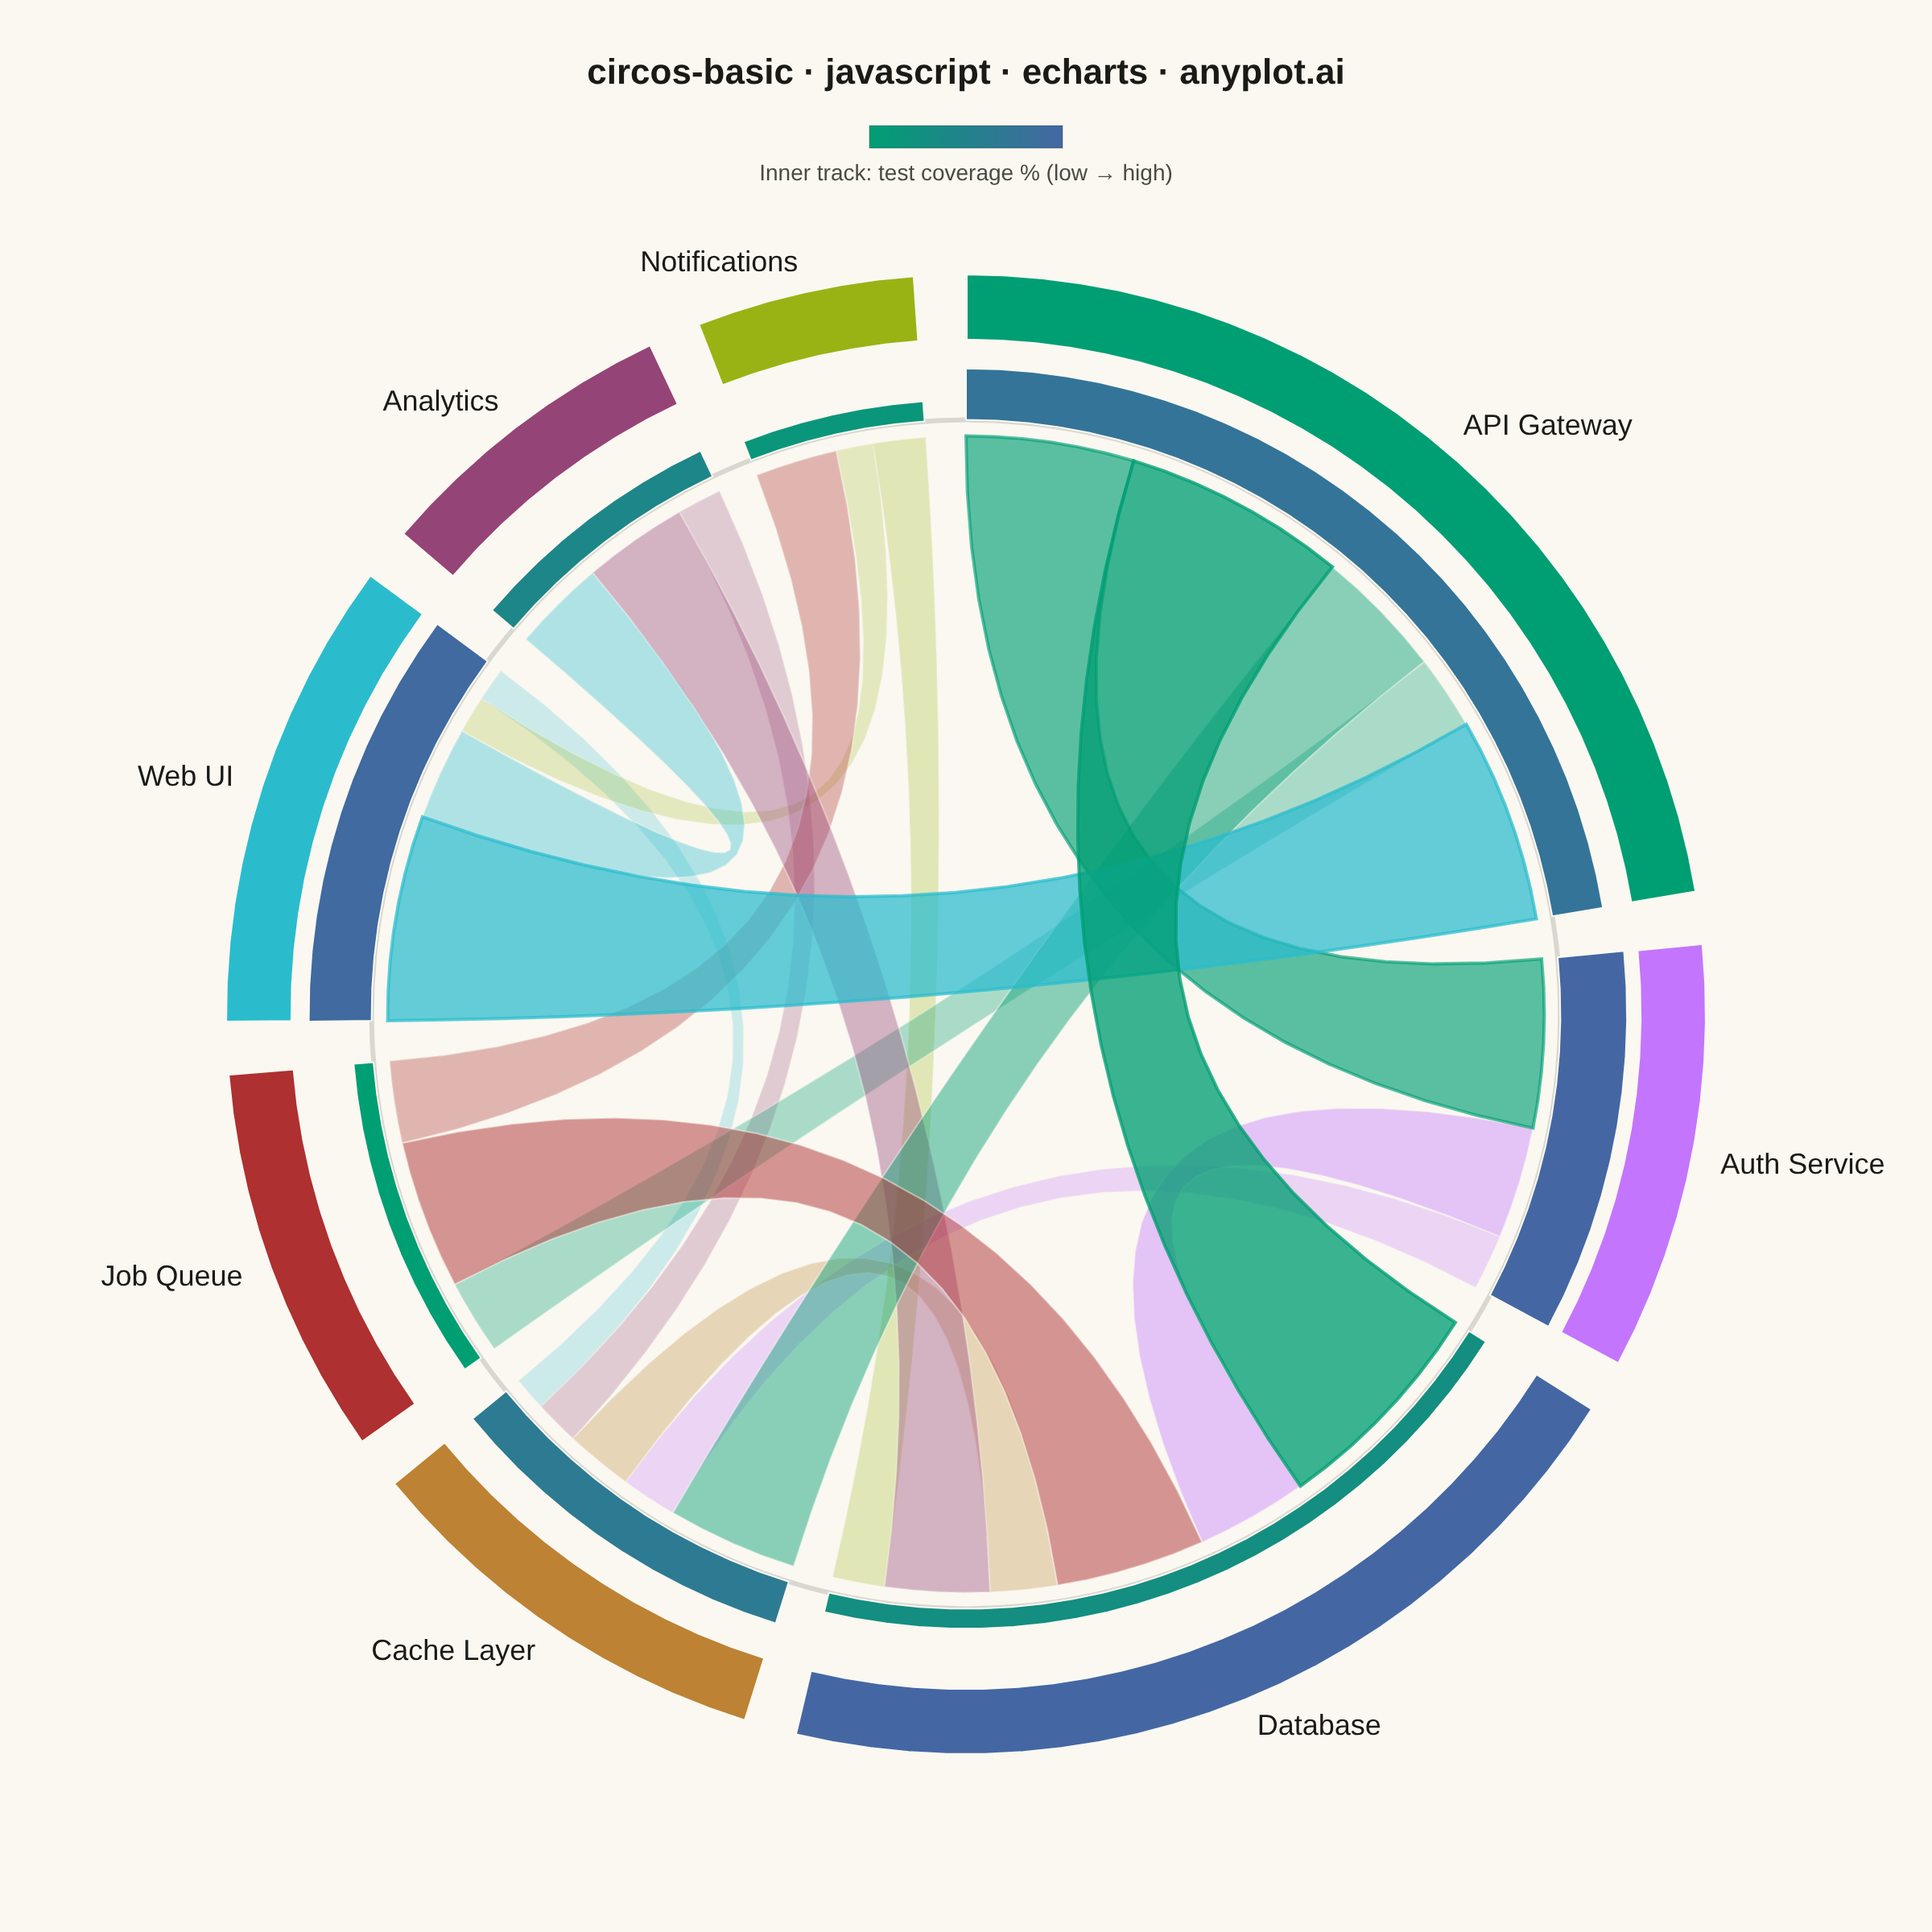
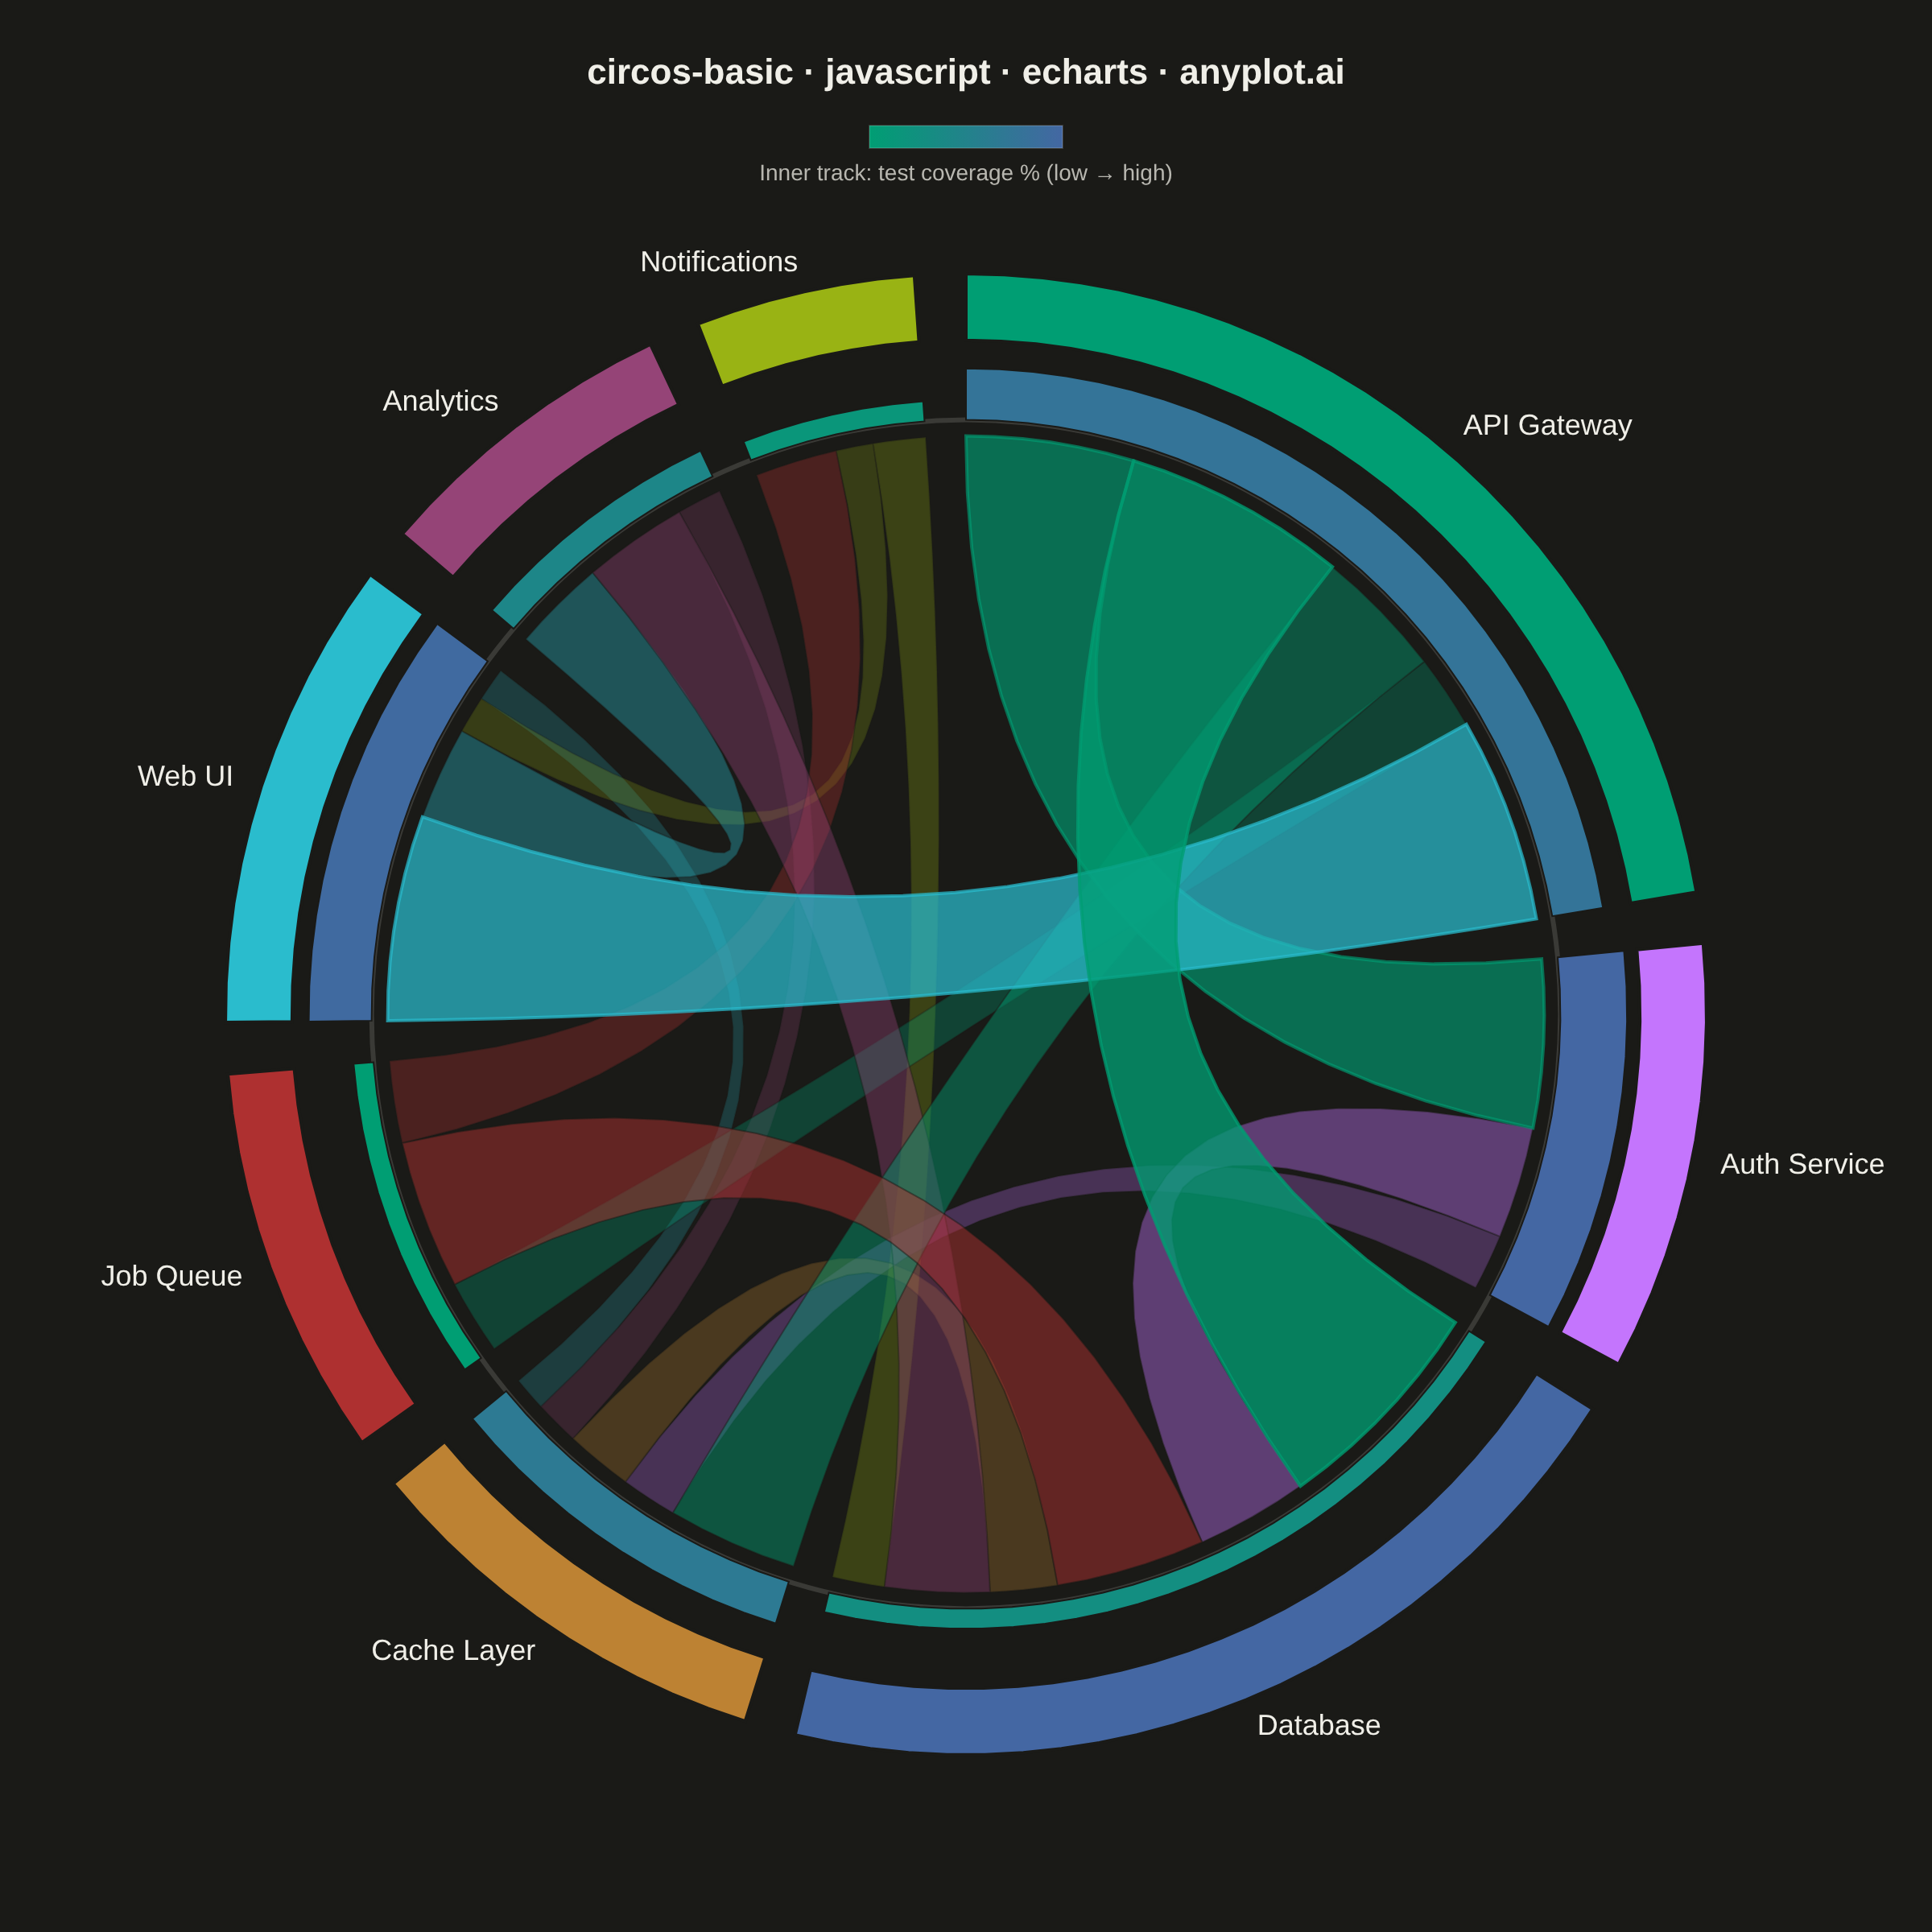
A Circos plot is a circular visualization that displays data on concentric tracks arranged around a circle, with ribbons or arcs connecting related segments across the circular layout. Originally designed for genomic data visualization, it excels at showing relationships between segments while simultaneously displaying multiple data attributes on different tracks. The circular arrangement makes efficient use of space and reveals patterns in complex relational data.
// anyplot.ai
// circos-basic: Circos Plot
// Library: echarts 6.1.0 | JavaScript 22.23.2
// Quality: 90/100 | Created: 2026-09-04
//# anyplot-orientation: square

const t = window.ANYPLOT_TOKENS;
const { width: W, height: H } = window.ANYPLOT_SIZE;

// --- Data (in-memory, deterministic) ----------------------------------------
// Software-module call graph: which service talks to which, and how often
// (calls/sec, thousands). The inner track shows each module's test-coverage %.
const modules = [
  "API Gateway",
  "Auth Service",
  "Database",
  "Cache Layer",
  "Job Queue",
  "Web UI",
  "Analytics",
  "Notifications",
];

const connections = [
  ["API Gateway", "Auth Service", 45],
  ["API Gateway", "Database", 60],
  ["API Gateway", "Cache Layer", 35],
  ["API Gateway", "Job Queue", 20],
  ["Auth Service", "Database", 30],
  ["Auth Service", "Cache Layer", 15],
  ["Web UI", "API Gateway", 55],
  ["Web UI", "Analytics", 25],
  ["Job Queue", "Database", 40],
  ["Job Queue", "Notifications", 22],
  ["Cache Layer", "Database", 18],
  ["Analytics", "Database", 28],
  ["Analytics", "Cache Layer", 12],
  ["Notifications", "Web UI", 10],
  ["Notifications", "Database", 14],
  ["Web UI", "Cache Layer", 9],
];

const coverage = {
  "API Gateway": 82,
  "Auth Service": 90,
  Database: 65,
  "Cache Layer": 78,
  "Job Queue": 55,
  "Web UI": 88,
  Analytics: 70,
  Notifications: 60,
};

// --- Layout geometry ---------------------------------------------------------
const cx = W / 2;
const cy = H / 2 + 30; // nudge down to leave room for the title
const outerLimit = Math.min(W, H) / 2 - 60;
const labelBand = 80;
const segmentOuter = outerLimit - labelBand;
const ringWidth = segmentOuter * 0.09;
const segmentInner = segmentOuter - ringWidth;
const trackOuter = segmentInner - 8;
const trackBandHeight = ringWidth;
const trackBase = trackOuter - trackBandHeight;
const ribbonRadius = trackBase - 10;

const GAP_DEG = 4;
const moduleColor = Object.fromEntries(
  modules.map((m, i) => [m, t.palette[i]]),
);

// --- Angle allocation (chord-diagram convention: arc span ∝ total connection
// value touching each module) --------------------------------------------
const segmentTotal = Object.fromEntries(modules.map((m) => [m, 0]));
connections.forEach(([source, target, value]) => {
  segmentTotal[source] += value;
  segmentTotal[target] += value;
});

const totalGap = GAP_DEG * modules.length;
const totalValue = modules.reduce((sum, m) => sum + segmentTotal[m], 0);
const degPerValue = (360 - totalGap) / totalValue;

const segmentAngle = {};
let cursor = 0;
modules.forEach((m) => {
  const span = segmentTotal[m] * degPerValue;
  segmentAngle[m] = { start: cursor, end: cursor + span };
  cursor += span + GAP_DEG;
});

const segmentCursor = Object.fromEntries(
  modules.map((m) => [m, segmentAngle[m].start]),
);
const ribbons = connections.map(([source, target, value]) => {
  const width = value * degPerValue;
  const sStart = segmentCursor[source];
  const sEnd = sStart + width;
  segmentCursor[source] = sEnd;
  const tStart = segmentCursor[target];
  const tEnd = tStart + width;
  segmentCursor[target] = tEnd;
  return { source, target, value, sStart, sEnd, tStart, tEnd };
});

// --- Geometry helpers --------------------------------------------------------
function polar(r, deg) {
  const rad = (deg * Math.PI) / 180;
  return [cx + r * Math.sin(rad), cy - r * Math.cos(rad)];
}

// The declarative `graphic` component only ships a handful of registered shape
// types (circle/sector/ring/polygon/polyline/rect/line/bezierCurve/arc/text) —
// no generic SVG-path type. Donut wedges and chord ribbons are built instead as
// sampled-point polygons, dense enough to read as smooth curves.
function arcPoints(r, startDeg, endDeg, steps) {
  const pts = [];
  for (let i = 0; i <= steps; i++) {
    pts.push(polar(r, startDeg + (endDeg - startDeg) * (i / steps)));
  }
  return pts;
}

function quadBezierPoints(p0, pControl, p1, steps) {
  const pts = [];
  for (let i = 1; i <= steps; i++) {
    const u = i / steps;
    const x =
      (1 - u) * (1 - u) * p0[0] + 2 * (1 - u) * u * pControl[0] + u * u * p1[0];
    const y =
      (1 - u) * (1 - u) * p0[1] + 2 * (1 - u) * u * pControl[1] + u * u * p1[1];
    pts.push([x, y]);
  }
  return pts;
}

function sectorPoints(rOuter, rInner, startDeg, endDeg) {
  const steps = Math.max(4, Math.round((endDeg - startDeg) / 3));
  return arcPoints(rOuter, startDeg, endDeg, steps).concat(
    arcPoints(rInner, endDeg, startDeg, steps),
  );
}

function ribbonPoints(r, sStart, sEnd, tStart, tEnd) {
  const curveSteps = 20;
  const arcS = arcPoints(
    r,
    sStart,
    sEnd,
    Math.max(4, Math.round((sEnd - sStart) / 3)),
  );
  const arcT = arcPoints(
    r,
    tStart,
    tEnd,
    Math.max(4, Math.round((tEnd - tStart) / 3)),
  );
  const curve1 = quadBezierPoints(
    arcS[arcS.length - 1],
    [cx, cy],
    arcT[0],
    curveSteps,
  );
  const curve2 = quadBezierPoints(
    arcT[arcT.length - 1],
    [cx, cy],
    arcS[0],
    curveSteps,
  );
  return arcS.concat(curve1, arcT, curve2);
}

function hexToRgb(hex) {
  const n = parseInt(hex.slice(1), 16);
  return [(n >> 16) & 255, (n >> 8) & 255, n & 255];
}

function lerpColor(a, b, frac) {
  const [r1, g1, b1] = hexToRgb(a);
  const [r2, g2, b2] = hexToRgb(b);
  const r = Math.round(r1 + (r2 - r1) * frac);
  const g = Math.round(g1 + (g2 - g1) * frac);
  const bl = Math.round(b1 + (b2 - b1) * frac);
  return `rgb(${r}, ${g}, ${bl})`;
}

// --- Graphic elements: ribbons (bottom) → track → segment ring → labels -----
const covValues = Object.values(coverage);
const covMin = Math.min(...covValues);
const covMax = Math.max(...covValues);

// Visual hierarchy: weaker connections fade back, the 3 strongest are drawn
// last (so they layer on top) and get a brighter fill + colored outline —
// giving the reader a focal point instead of a uniform hairball.
const connectionValues = ribbons.map((rb) => rb.value);
const valueMin = Math.min(...connectionValues);
const valueMax = Math.max(...connectionValues);
const emphasisCutoff = [...connectionValues].sort((a, b) => b - a)[2];

const ribbonElements = [...ribbons]
  .sort((a, b) => a.value - b.value)
  .map((rb) => {
    const frac = (rb.value - valueMin) / (valueMax - valueMin);
    const emphasized = rb.value >= emphasisCutoff;
    return {
      type: "polygon",
      shape: {
        points: ribbonPoints(
          ribbonRadius,
          rb.sStart,
          rb.sEnd,
          rb.tStart,
          rb.tEnd,
        ),
      },
      style: {
        fill: moduleColor[rb.source],
        opacity: 0.22 + frac * 0.45 + (emphasized ? 0.1 : 0),
        stroke: emphasized ? moduleColor[rb.source] : t.pageBg,
        lineWidth: emphasized ? 2 : 1,
      },
      silent: true,
    };
  });

const trackBaseline = {
  type: "ring",
  shape: { cx, cy, r: trackBase + 1.5, r0: trackBase - 1.5 },
  style: { fill: t.grid },
  silent: true,
};

const trackElements = modules.map((m) => {
  const { start, end } = segmentAngle[m];
  const frac = (coverage[m] - covMin) / (covMax - covMin);
  const barOuter = trackBase + trackBandHeight * Math.max(frac, 0.3);
  return {
    type: "polygon",
    shape: { points: sectorPoints(barOuter, trackBase, start, end) },
    style: {
      fill: lerpColor(t.seq[0], t.seq[1], frac),
      stroke: t.pageBg,
      lineWidth: 1,
    },
    silent: true,
  };
});

const segmentElements = modules.map((m) => {
  const { start, end } = segmentAngle[m];
  return {
    type: "polygon",
    shape: { points: sectorPoints(segmentOuter, segmentInner, start, end) },
    style: { fill: moduleColor[m], stroke: t.pageBg, lineWidth: 2 },
    silent: true,
  };
});

const labelElements = modules.map((m) => {
  const { start, end } = segmentAngle[m];
  const mid = (start + end) / 2;
  const [lx, ly] = polar(segmentOuter + 18, mid);
  const rightHalf = mid < 180;
  return {
    type: "text",
    style: {
      text: m,
      x: lx,
      y: ly,
      fill: t.ink,
      fontSize: 18,
      fontWeight: 500,
      align: rightHalf ? "left" : "right",
      verticalAlign: "middle",
    },
    silent: true,
  };
});

// A small swatch + caption identifying the inner ring, so its meaning reads
// from the static image alone (no need to inspect the source for what the
// green→blue gradient track encodes).
const circleTop = cy - segmentOuter;
const legendSwatchY = Math.max(70, circleTop / 2 - 7);
const legendSwatchWidth = 120;
const legendSwatchHeight = 14;
const coverageGradient = new echarts.graphic.LinearGradient(0, 0, 1, 0, [
  { offset: 0, color: t.seq[0] },
  { offset: 1, color: t.seq[1] },
]);

const legendElements = [
  {
    type: "rect",
    shape: {
      x: cx - legendSwatchWidth / 2,
      y: legendSwatchY,
      width: legendSwatchWidth,
      height: legendSwatchHeight,
    },
    style: { fill: coverageGradient, stroke: t.grid, lineWidth: 1 },
    silent: true,
  },
  {
    type: "text",
    style: {
      text: "Inner track: test coverage % (low → high)",
      x: cx,
      y: legendSwatchY + legendSwatchHeight + 16,
      fill: t.inkSoft,
      fontSize: 14,
      align: "center",
      verticalAlign: "middle",
    },
    silent: true,
  },
];

// --- Init & option ------------------------------------------------------------
const chart = echarts.init(document.getElementById("container"));

chart.setOption({
  animation: false,
  backgroundColor: "transparent",
  title: {
    text: "circos-basic · javascript · echarts · anyplot.ai",
    left: "center",
    top: 30,
    textStyle: { color: t.ink, fontSize: 22 },
  },
  graphic: [
    ...ribbonElements,
    trackBaseline,
    ...trackElements,
    ...segmentElements,
    ...labelElements,
    ...legendElements,
  ],
});

chart.on("finished", () => {
  window.__anyplotReady = true;
});
Runnable source as JSON, for any HTTP client: https://api.anyplot.ai/specs/circos-basic/echarts/code. Any spec id and library id listed in llms-full.txt fit the same URL shape; every URL below is complete and callable.
{
  "spec_id": "circos-basic",
  "language": "javascript",
  "library": "echarts",
  "page": "https://anyplot.ai/circos-basic/javascript/echarts",
  "hub": "https://anyplot.ai/circos-basic",
  "code_json": "https://api.anyplot.ai/specs/circos-basic/echarts/code",
  "spec_json": "https://api.anyplot.ai/specs/circos-basic",
  "render_light_png": "https://storage.googleapis.com/anyplot-images/plots/circos-basic/javascript/echarts/plot-light.png",
  "render_dark_png": "https://storage.googleapis.com/anyplot-images/plots/circos-basic/javascript/echarts/plot-dark.png",
  "interactive_light_html": "https://storage.googleapis.com/anyplot-images/plots/circos-basic/javascript/echarts/plot-light.html",
  "interactive_dark_html": "https://storage.googleapis.com/anyplot-images/plots/circos-basic/javascript/echarts/plot-dark.html",
  "quality_score": 90.0,
  "license": "MIT",
  "guide": "https://anyplot.ai/llms.txt"
}
Part of Circos Plot on anyplot.ai.