The same plot in 14 other libraries — Python: Altair, Bokeh, lets-plot, Matplotlib, Plotly, plotnine, Pygal, Seaborn; R: ggplot2; JavaScript: Chart.js, D3.js, Apache ECharts, Highcharts, MUI X Charts. Compare all 15 side by side: Circos Plot in Python, R, Julia and JavaScript.
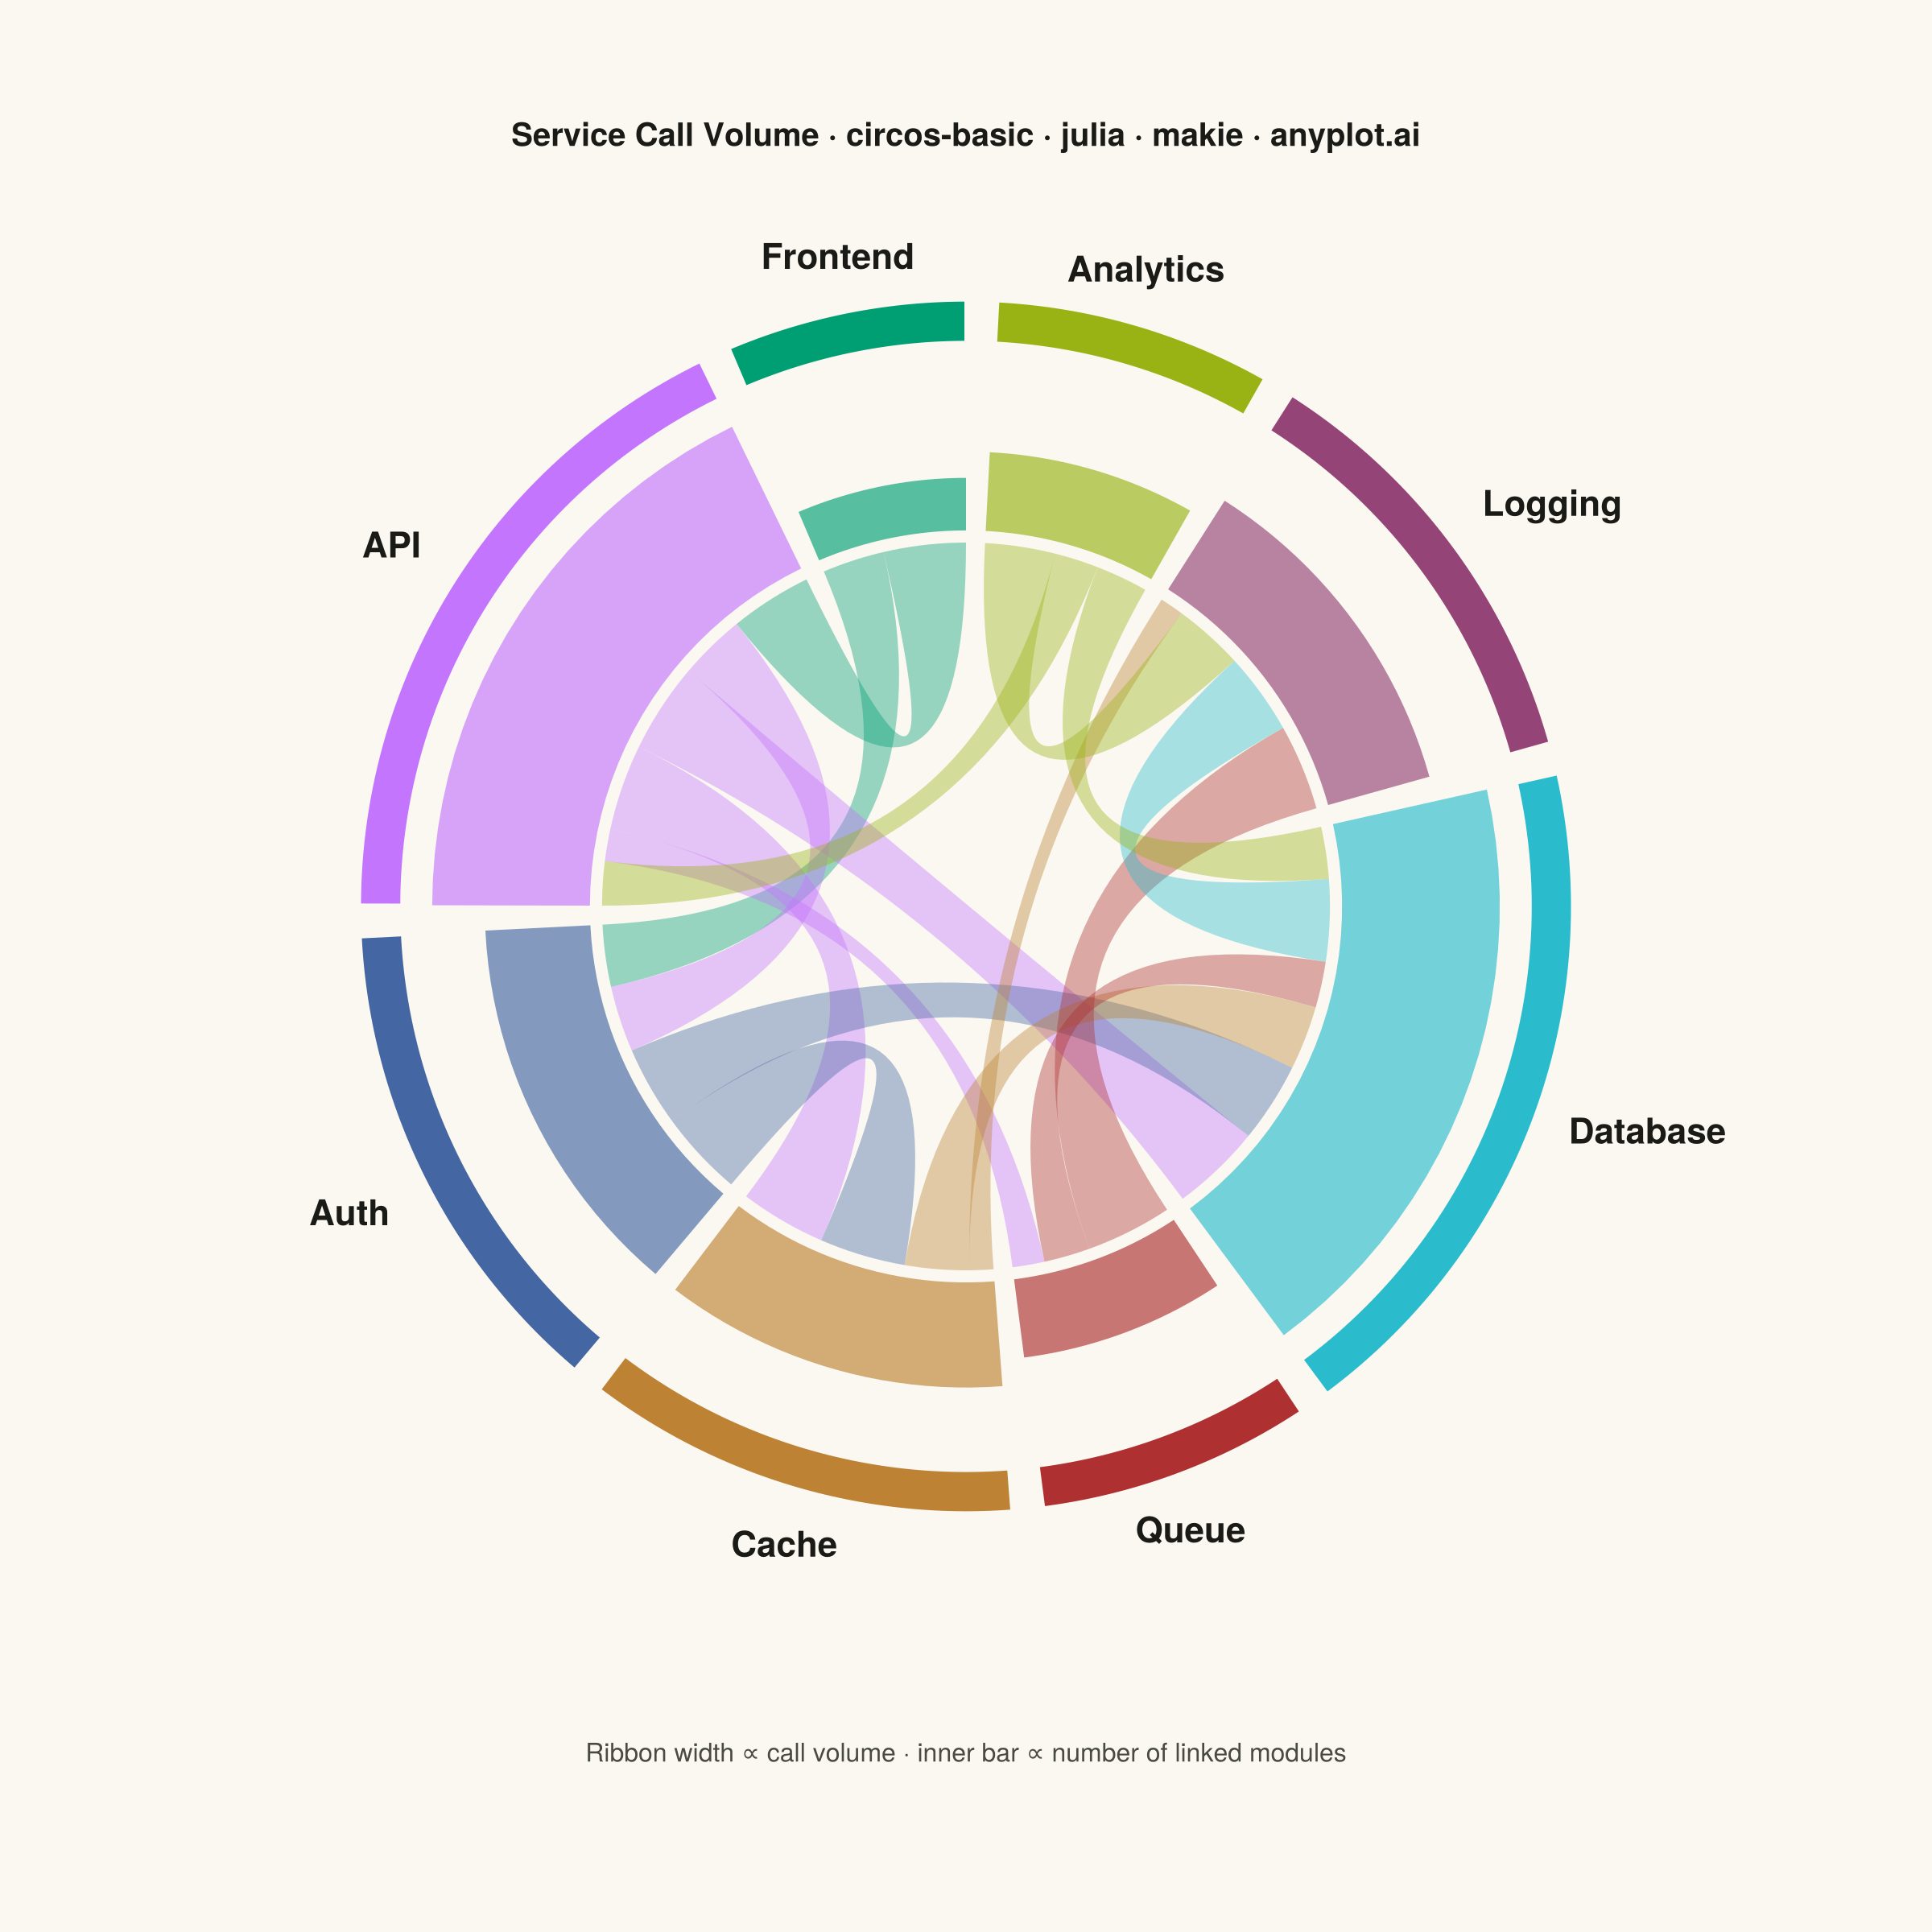
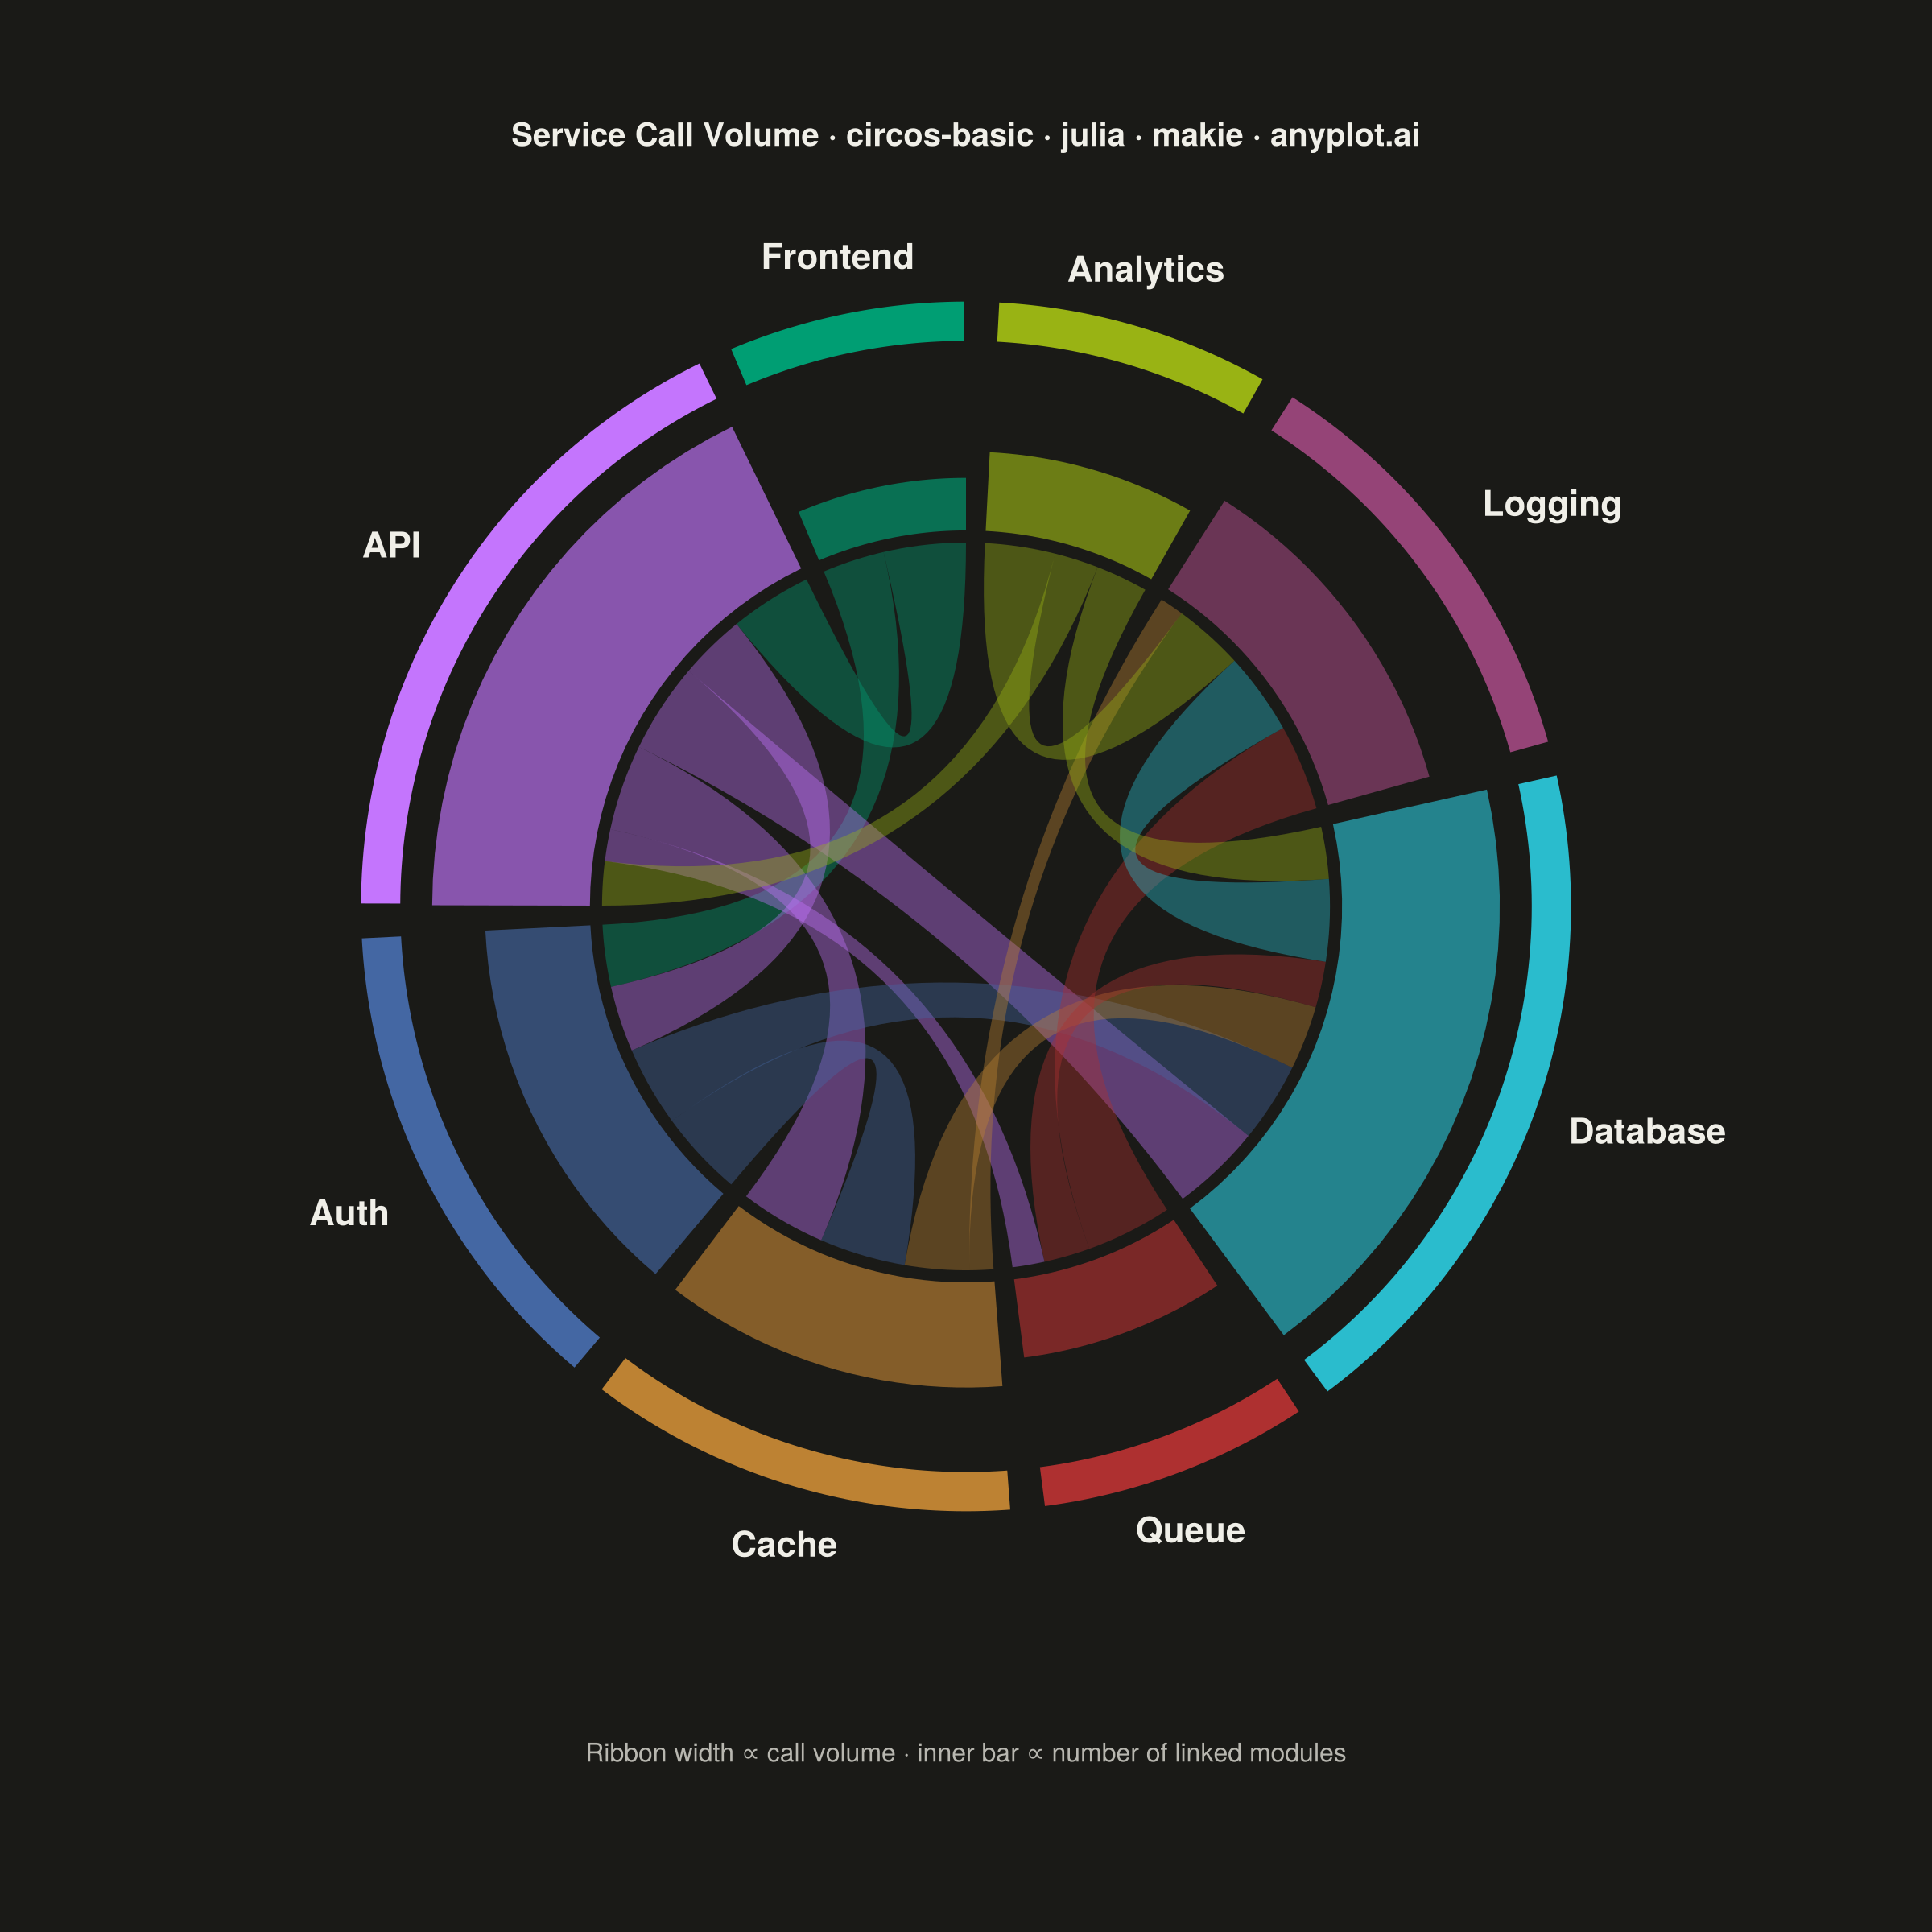
A Circos plot is a circular visualization that displays data on concentric tracks arranged around a circle, with ribbons or arcs connecting related segments across the circular layout. Originally designed for genomic data visualization, it excels at showing relationships between segments while simultaneously displaying multiple data attributes on different tracks. The circular arrangement makes efficient use of space and reveals patterns in complex relational data.
# anyplot.ai
# circos-basic: Circos Plot
# Library: makie 0.21.9 | Julia 1.11.9
# Quality: 94/100 | Created: 2026-09-04

using CairoMakie
using Makie
using Colors
using Random

# --- Theme tokens (see prompts/default-style-guide.md "Theme-adaptive Chrome") ---
const THEME    = get(ENV, "ANYPLOT_THEME", "light")
const PAGE_BG  = THEME == "light" ? colorant"#FAF8F1" : colorant"#1A1A17"
const INK      = THEME == "light" ? colorant"#1A1A17" : colorant"#F0EFE8"
const INK_SOFT = THEME == "light" ? colorant"#4A4A44" : colorant"#B8B7B0"

# Imprint palette — one hue per module, first series is brand green.
const IMPRINT_PALETTE = [
    colorant"#009E73", colorant"#C475FD", colorant"#4467A3", colorant"#BD8233",
    colorant"#AE3030", colorant"#2ABCCD", colorant"#954477", colorant"#99B314",
]

# --- Data: request volume between backend service modules over one day ---
Random.seed!(42)
modules = ["Frontend", "API", "Auth", "Cache", "Queue", "Database", "Logging", "Analytics"]

edges = [
    ("Frontend", "API"), ("Frontend", "Auth"), ("API", "Auth"), ("API", "Database"),
    ("API", "Cache"), ("API", "Queue"), ("Auth", "Database"), ("Auth", "Cache"),
    ("Cache", "Database"), ("Queue", "Database"), ("Queue", "Logging"),
    ("Database", "Logging"), ("Analytics", "Database"), ("Analytics", "API"),
    ("Analytics", "Logging"), ("Cache", "Logging"),
]
weight = rand(8:60, length(edges))  # thousands of calls / day

# --- Geometry: one arc per module, sized by total call volume touching it ---
n            = length(modules)
idx          = Dict(m => i for (i, m) in enumerate(modules))
gap          = deg2rad(3.0)
degree       = zeros(Int, n)                 # number of distinct links per module (track data)
mod_total    = zeros(Float64, n)              # sum of call volume touching each module
for (k, (s, t)) in enumerate(edges)
    mod_total[idx[s]] += weight[k]
    mod_total[idx[t]] += weight[k]
    degree[idx[s]]    += 1
    degree[idx[t]]    += 1
end

available = 2π - n * gap
per_unit  = available / sum(mod_total)
span      = mod_total .* per_unit
arc_start = [π / 2 + sum(span[1:i-1]) + (i - 1) * gap for i in 1:n]
arc_stop  = arc_start .+ span

# Sub-divide each module's arc into one foot per edge touching it (in edge order).
foot = Dict{Tuple{Int, Int}, Tuple{Float64, Float64}}()  # (edge_index, module_index) -> (a0, a1)
sub_cursor = copy(arc_start)
for (k, (s, t)) in enumerate(edges)
    si, ti = idx[s], idx[t]
    w = weight[k] * per_unit
    foot[(k, si)] = (sub_cursor[si], sub_cursor[si] + w)
    sub_cursor[si] += w
    foot[(k, ti)] = (sub_cursor[ti], sub_cursor[ti] + w)
    sub_cursor[ti] += w
end

# Radii, outer to inner: module ring, degree track, ribbon attachment point.
r_out         = 1.00
r_band_inner  = 0.93
r_track_outer = 0.88
r_track_inner = 0.62
r_ribbon      = 0.60

on_ring = (t, rad) -> Point2f(rad * cos(t), rad * sin(t))

# Custom Makie recipe (Makie.@recipe): a circos chord is its own plot type,
# not a bare poly! call — it owns its point-generation pipeline behind
# `circoschord!`, in the same spirit as Makie's built-in recipes (e.g. band!).
@recipe(CircosChord) do scene
    Theme(a0 = 0.0, a1 = 0.0, b0 = 0.0, b1 = 0.0, radius = 0.6, color = :gray)
end

function Makie.plot!(chord::CircosChord)
    @extract(chord, (a0, a1, b0, b1, radius, color))
    points = lift(chord, a0, a1, b0, b1, radius) do a0, a1, b0, b1, r
        curve(p0, p2) = [Point2f((1 - t)^2 * p0[1] + t^2 * p2[1],
                                  (1 - t)^2 * p0[2] + t^2 * p2[2]) for t in range(0, 1; length = 40)]
        edge_i = [on_ring(t, r) for t in range(a0, a1; length = 10)]
        edge_j = [on_ring(t, r) for t in range(b0, b1; length = 10)]
        vcat(edge_i, curve(edge_i[end], edge_j[1]), edge_j, curve(edge_j[end], edge_i[1]))
    end
    poly!(chord, points; color = color, strokewidth = 0)
    chord
end

title       = "Service Call Volume · circos-basic · julia · makie · anyplot.ai"
title_ratio = length(title) > 67 ? 67 / length(title) : 1.0
titlesize   = max(14, round(Int, 20 * title_ratio))

# --- Plot ---
fig = Figure(size = (1200, 1200), backgroundcolor = PAGE_BG)

ax = Axis(
    fig[1, 1];
    title           = title,
    titlesize       = titlesize,
    titlecolor      = INK,
    titlegap        = 16,
    backgroundcolor = PAGE_BG,
    aspect          = DataAspect(),
)
hidespines!(ax)
hidedecorations!(ax)
limits!(ax, -1.55, 1.55, -1.5, 1.2)

# Ribbons: one per edge, tinted by its source module. Drawn grouped by source
# module (hue family) so overlapping regions blend within a family rather
# than criss-crossing many unrelated hues; heavier flows within a family
# drawn first so thin flows stay visible on top.
order = sort(1:length(edges); by = k -> (idx[edges[k][1]], -weight[k]))
for k in order
    s, t   = edges[k]
    si, ti = idx[s], idx[t]
    a0, a1 = foot[(k, si)]
    b0, b1 = foot[(k, ti)]
    circoschord!(ax; a0 = a0, a1 = a1, b0 = b0, b1 = b1, radius = r_ribbon,
        color = (IMPRINT_PALETTE[si], 0.4))
end

# Degree track: inner bar per module, height proportional to number of links.
max_degree = maximum(degree)
for i in 1:n
    ang    = range(arc_start[i], arc_stop[i]; length = 24)
    r_bar  = r_track_inner + (r_track_outer - r_track_inner) * degree[i] / max_degree
    outer  = [on_ring(t, r_bar) for t in ang]
    inner  = [on_ring(t, r_track_inner) for t in reverse(ang)]
    poly!(ax, vcat(outer, inner); color = (IMPRINT_PALETTE[i], 0.65), strokewidth = 0)
end

# Module ring: colored arc segment per module.
for i in 1:n
    ang   = range(arc_start[i], arc_stop[i]; length = 64)
    outer = [on_ring(t, r_out) for t in ang]
    inner = [on_ring(t, r_band_inner) for t in reverse(ang)]
    poly!(ax, vcat(outer, inner);
        color = IMPRINT_PALETTE[i], strokecolor = PAGE_BG, strokewidth = 2)
end

# Module labels, placed just outside the ring and anchored by quadrant.
for i in 1:n
    mid    = (arc_start[i] + arc_stop[i]) / 2
    cx, cy = cos(mid), sin(mid)
    ha = abs(cx) < 0.35 ? :center : (cx > 0 ? :left : :right)
    va = abs(cy) < 0.35 ? :center : (cy > 0 ? :bottom : :top)
    text!(ax, 1.06 * cx, 1.06 * cy;
        text = modules[i], align = (ha, va), color = INK, fontsize = 22, font = :bold)
end

# Footnote: clarify the encoding without faking interactivity.
text!(ax, 0.0, -1.42;
    text = "Ribbon width ∝ call volume · inner bar ∝ number of linked modules",
    align = (:center, :bottom), color = INK_SOFT, fontsize = 16)

# --- Save ---
save("plot-$(THEME).png", fig; px_per_unit = 2)
Runnable source as JSON, for any HTTP client: https://api.anyplot.ai/specs/circos-basic/makie/code. Any spec id and library id listed in llms-full.txt fit the same URL shape; every URL below is complete and callable.
{
  "spec_id": "circos-basic",
  "language": "julia",
  "library": "makie",
  "page": "https://anyplot.ai/circos-basic/julia/makie",
  "hub": "https://anyplot.ai/circos-basic",
  "code_json": "https://api.anyplot.ai/specs/circos-basic/makie/code",
  "spec_json": "https://api.anyplot.ai/specs/circos-basic",
  "render_light_png": "https://storage.googleapis.com/anyplot-images/plots/circos-basic/julia/makie/plot-light.png",
  "render_dark_png": "https://storage.googleapis.com/anyplot-images/plots/circos-basic/julia/makie/plot-dark.png",
  "quality_score": 94.0,
  "license": "MIT",
  "guide": "https://anyplot.ai/llms.txt"
}
Part of Circos Plot on anyplot.ai.