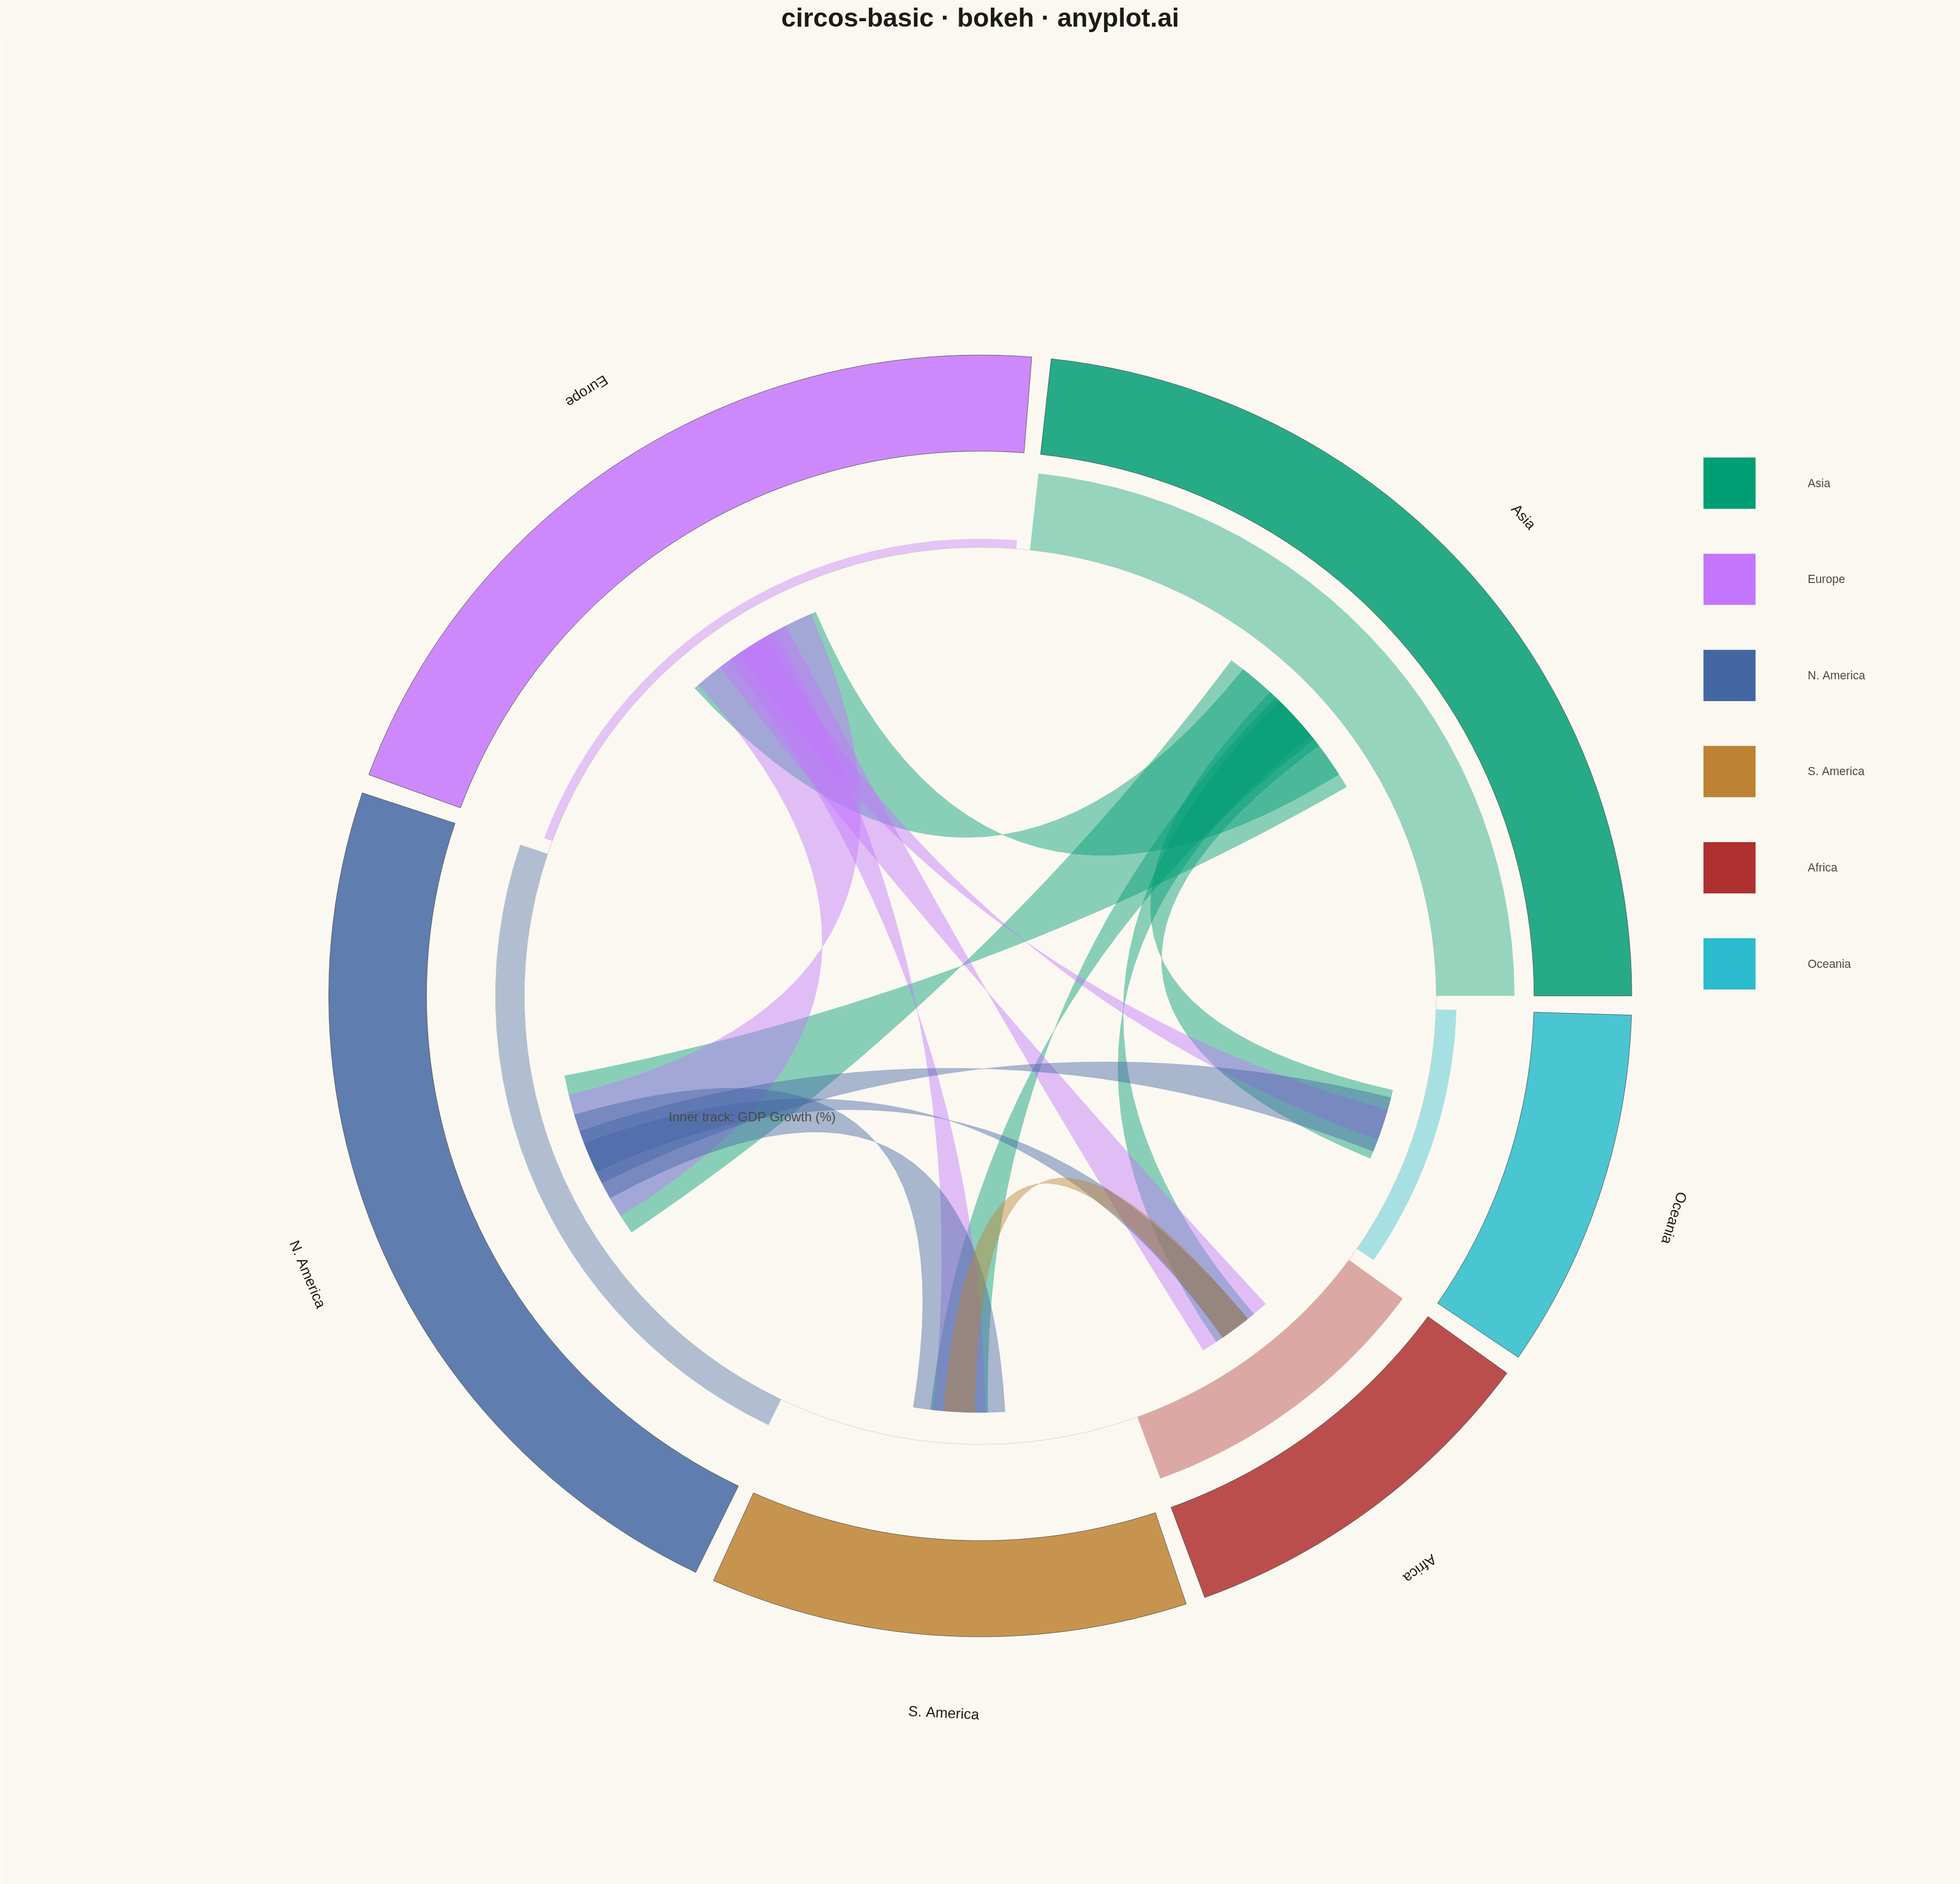
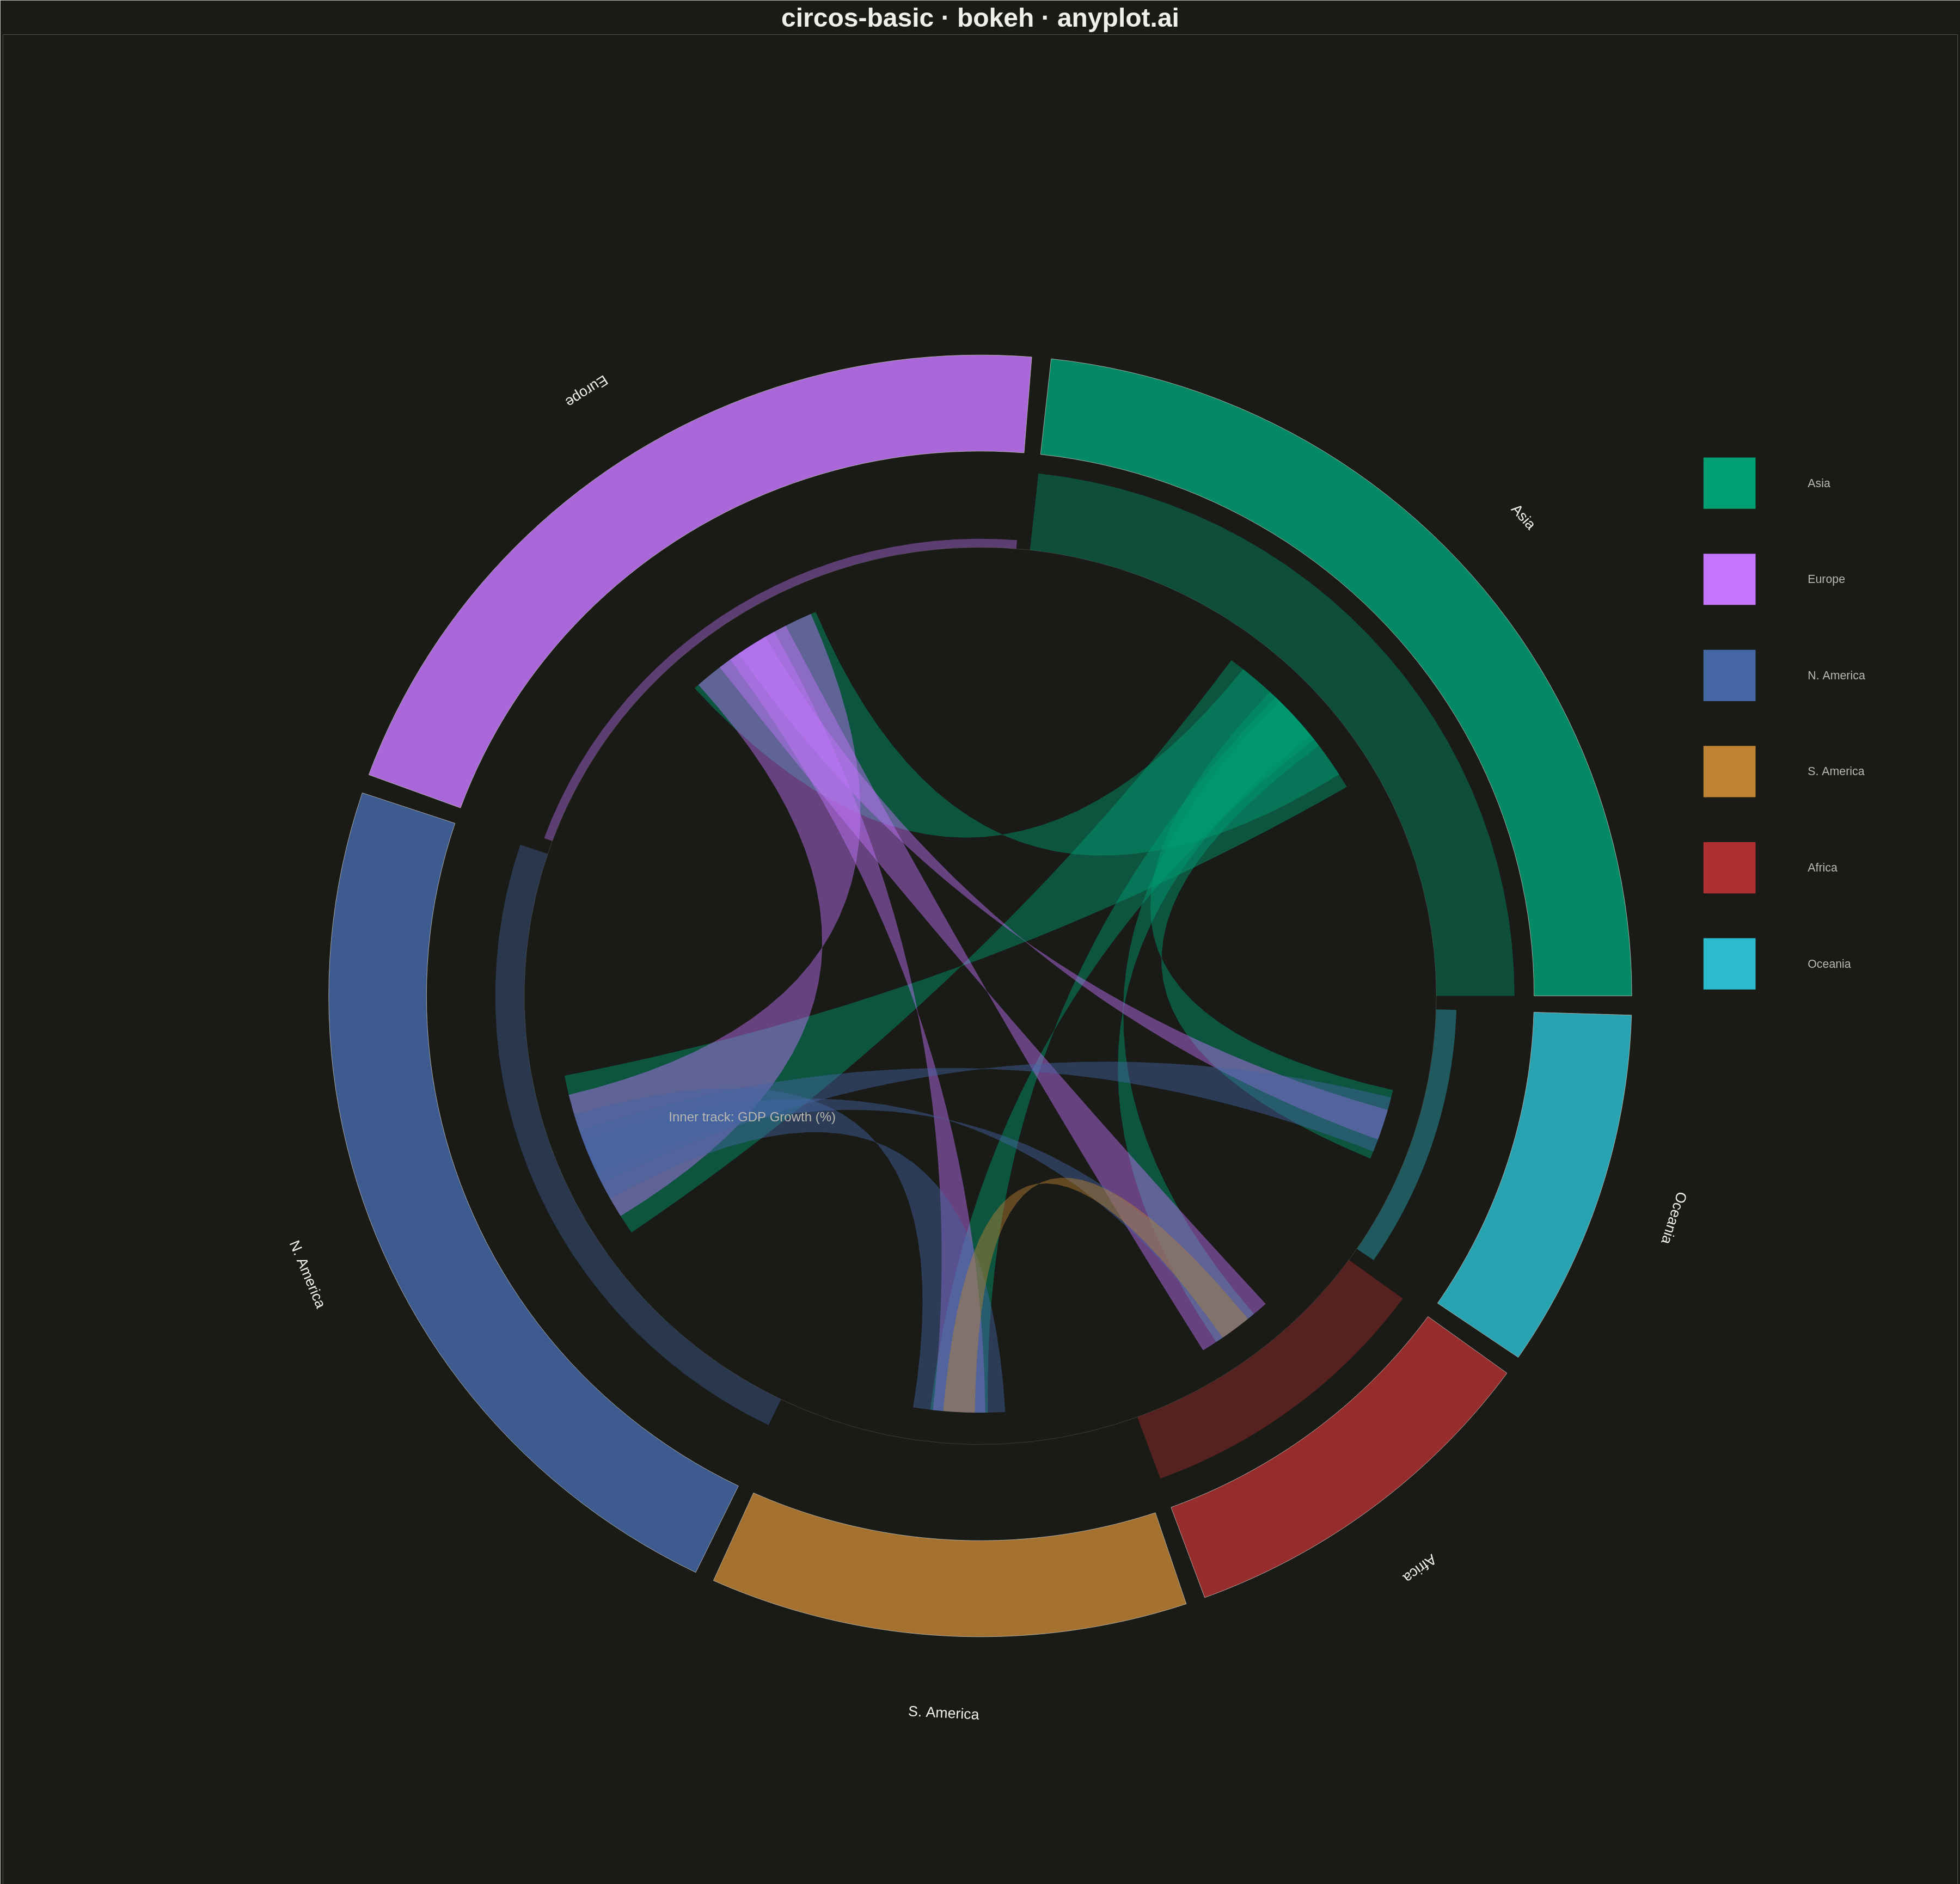
A Circos plot is a circular visualization that displays data on concentric tracks arranged around a circle, with ribbons or arcs connecting related segments across the circular layout. Originally designed for genomic data visualization, it excels at showing relationships between segments while simultaneously displaying multiple data attributes on different tracks. The circular arrangement makes efficient use of space and reveals patterns in complex relational data.
""" anyplot.ai
circos-basic: Circos Plot
Library: bokeh 3.9.0 | Python 3.13.13
Quality: 94/100 | Updated: 2026-05-15
"""

import sys
from pathlib import Path


script_dir = str(Path(__file__).parent.absolute())
sys.path = [p for p in sys.path if p != script_dir and p != ""]

import os
import time

import numpy as np
from bokeh.io import output_file, save
from bokeh.models import ColumnDataSource
from bokeh.plotting import figure
from selenium import webdriver
from selenium.webdriver.chrome.options import Options


THEME = os.getenv("ANYPLOT_THEME", "light")
PAGE_BG = "#FAF8F1" if THEME == "light" else "#1A1A17"
ELEVATED_BG = "#FFFDF6" if THEME == "light" else "#242420"
INK = "#1A1A17" if THEME == "light" else "#F0EFE8"
INK_SOFT = "#4A4A44" if THEME == "light" else "#B8B7B0"

IMPRINT = ["#009E73", "#C475FD", "#4467A3", "#BD8233", "#AE3030", "#2ABCCD", "#954477"]

np.random.seed(42)

regions = ["Asia", "Europe", "N. America", "S. America", "Africa", "Oceania"]
n_regions = len(regions)

flow_matrix = np.array(
    [
        [0, 45, 52, 18, 15, 22],
        [38, 0, 35, 12, 20, 8],
        [48, 42, 0, 28, 10, 15],
        [15, 18, 25, 0, 8, 5],
        [12, 25, 8, 10, 0, 3],
        [20, 10, 18, 6, 4, 0],
    ]
)

segment_sizes = flow_matrix.sum(axis=0) + flow_matrix.sum(axis=1)
track_values = np.array([4.2, 1.8, 2.5, 1.5, 3.8, 2.2])

total_size = segment_sizes.sum()
gap = 0.03
total_gap = gap * n_regions
available_angle = 2 * np.pi - total_gap

segment_angles = []
current_angle = 0
for size in segment_sizes:
    angle_span = (size / total_size) * available_angle
    start = current_angle
    end = current_angle + angle_span
    segment_angles.append((start, end))
    current_angle = end + gap

p = figure(
    width=3600,
    height=3600,
    title="circos-basic · bokeh · anyplot.ai",
    x_range=(-1.5, 1.5),
    y_range=(-1.5, 1.5),
    tools="",
    toolbar_location=None,
)

p.title.text_font_size = "36pt"
p.title.align = "center"
p.title.text_color = INK

p.xaxis.visible = False
p.yaxis.visible = False
p.xgrid.visible = False
p.ygrid.visible = False
p.outline_line_color = None
p.background_fill_color = PAGE_BG
p.border_fill_color = PAGE_BG

outer_radius = 1.0
inner_radius = 0.85
track_outer = 0.82
track_inner = 0.70
ribbon_radius = 0.65

for i, (start, end) in enumerate(segment_angles):
    theta = np.linspace(start, end, 50)
    outer_x = outer_radius * np.cos(theta)
    outer_y = outer_radius * np.sin(theta)
    inner_x = inner_radius * np.cos(theta[::-1])
    inner_y = inner_radius * np.sin(theta[::-1])

    xs = np.concatenate([outer_x, inner_x, [outer_x[0]]])
    ys = np.concatenate([outer_y, inner_y, [outer_y[0]]])

    source = ColumnDataSource(data={"xs": [xs], "ys": [ys]})
    color = IMPRINT[i % len(IMPRINT)]
    p.patches(xs="xs", ys="ys", source=source, fill_color=color, line_color=INK_SOFT, line_width=1, alpha=0.85)

    mid_angle = (start + end) / 2
    label_radius = outer_radius + 0.12
    label_x = label_radius * np.cos(mid_angle)
    label_y = label_radius * np.sin(mid_angle)

    angle = mid_angle * 180 / np.pi
    if 90 < angle < 270:
        angle += 180

    p.text(
        x=[label_x],
        y=[label_y],
        text=[regions[i]],
        text_font_size="20pt",
        text_align="center",
        text_baseline="middle",
        text_color=INK,
        angle=[np.radians(angle - 90)],
    )

max_track = track_values.max()
min_track = track_values.min()
track_range = max_track - min_track

for i, (start, end) in enumerate(segment_angles):
    norm_val = (track_values[i] - min_track) / track_range if track_range > 0 else 0.5
    bar_radius = track_inner + norm_val * (track_outer - track_inner)

    theta = np.linspace(start, end, 30)
    outer_x = bar_radius * np.cos(theta)
    outer_y = bar_radius * np.sin(theta)
    inner_x = track_inner * np.cos(theta[::-1])
    inner_y = track_inner * np.sin(theta[::-1])

    xs = np.concatenate([outer_x, inner_x, [outer_x[0]]])
    ys = np.concatenate([outer_y, inner_y, [outer_y[0]]])

    source = ColumnDataSource(data={"xs": [xs], "ys": [ys]})
    color = IMPRINT[i % len(IMPRINT)]
    p.patches(xs="xs", ys="ys", source=source, fill_color=color, line_color=None, alpha=0.4)

track_ref_theta = np.linspace(0, 2 * np.pi, 100)
track_ref_x = track_inner * np.cos(track_ref_theta)
track_ref_y = track_inner * np.sin(track_ref_theta)
p.line(track_ref_x, track_ref_y, line_color=INK_SOFT, line_width=1, line_alpha=0.2)

flow_threshold = 15

for i in range(n_regions):
    for j in range(i + 1, n_regions):
        flow_ij = flow_matrix[i, j]
        flow_ji = flow_matrix[j, i]
        total_flow = flow_ij + flow_ji

        if total_flow < flow_threshold:
            continue

        start_i, end_i = segment_angles[i]
        seg_span_i = end_i - start_i
        ribbon_width_i = (total_flow / segment_sizes[i]) * seg_span_i * 0.8

        start_j, end_j = segment_angles[j]
        seg_span_j = end_j - start_j
        ribbon_width_j = (total_flow / segment_sizes[j]) * seg_span_j * 0.8

        mid_i = (start_i + end_i) / 2
        mid_j = (start_j + end_j) / 2

        theta_i_start = mid_i - ribbon_width_i / 2
        theta_i_end = mid_i + ribbon_width_i / 2

        theta_j_start = mid_j - ribbon_width_j / 2
        theta_j_end = mid_j + ribbon_width_j / 2

        n_curve = 30
        t = np.linspace(0, 1, n_curve)
        ctrl_x, ctrl_y = 0, 0

        x1_start = ribbon_radius * np.cos(theta_i_start)
        y1_start = ribbon_radius * np.sin(theta_i_start)
        x1_end = ribbon_radius * np.cos(theta_j_start)
        y1_end = ribbon_radius * np.sin(theta_j_start)

        curve1_x = (1 - t) ** 2 * x1_start + 2 * (1 - t) * t * ctrl_x + t**2 * x1_end
        curve1_y = (1 - t) ** 2 * y1_start + 2 * (1 - t) * t * ctrl_y + t**2 * y1_end

        arc_j_theta = np.linspace(theta_j_start, theta_j_end, 10)
        arc_j_x = ribbon_radius * np.cos(arc_j_theta)
        arc_j_y = ribbon_radius * np.sin(arc_j_theta)

        x2_start = ribbon_radius * np.cos(theta_j_end)
        y2_start = ribbon_radius * np.sin(theta_j_end)
        x2_end = ribbon_radius * np.cos(theta_i_end)
        y2_end = ribbon_radius * np.sin(theta_i_end)

        curve2_x = (1 - t) ** 2 * x2_start + 2 * (1 - t) * t * ctrl_x + t**2 * x2_end
        curve2_y = (1 - t) ** 2 * y2_start + 2 * (1 - t) * t * ctrl_y + t**2 * y2_end

        arc_i_theta = np.linspace(theta_i_end, theta_i_start, 10)
        arc_i_x = ribbon_radius * np.cos(arc_i_theta)
        arc_i_y = ribbon_radius * np.sin(arc_i_theta)

        ribbon_x = np.concatenate([curve1_x, arc_j_x, curve2_x, arc_i_x])
        ribbon_y = np.concatenate([curve1_y, arc_j_y, curve2_y, arc_i_y])

        ribbon_color = IMPRINT[i % len(IMPRINT)]

        source = ColumnDataSource(data={"xs": [ribbon_x], "ys": [ribbon_y]})
        p.patches(
            xs="xs",
            ys="ys",
            source=source,
            fill_color=ribbon_color,
            line_color=ribbon_color,
            line_width=0.5,
            alpha=0.45,
        )

legend_x = 1.15
legend_y_start = 0.8
legend_spacing = 0.15

for i, region in enumerate(regions):
    y_pos = legend_y_start - i * legend_spacing
    color = IMPRINT[i % len(IMPRINT)]
    p.rect(x=[legend_x], y=[y_pos], width=0.08, height=0.08, fill_color=color, line_color=None)
    p.text(
        x=[legend_x + 0.12],
        y=[y_pos],
        text=[region],
        text_font_size="16pt",
        text_align="left",
        text_baseline="middle",
        text_color=INK_SOFT,
    )

p.text(
    x=[-0.35],
    y=[-0.20],
    text=["Inner track: GDP Growth (%)"],
    text_font_size="18pt",
    text_color=INK_SOFT,
    text_align="center",
)

output_file(f"plot-{THEME}.html")
save(p)

W, H = 3600, 3600
opts = Options()
for arg in (
    "--headless=new",
    "--no-sandbox",
    "--disable-dev-shm-usage",
    "--disable-gpu",
    f"--window-size={W},{H}",
    "--hide-scrollbars",
):
    opts.add_argument(arg)
driver = webdriver.Chrome(options=opts)
driver.set_window_size(W, H)
driver.get(f"file://{Path(f'plot-{THEME}.html').resolve()}")
time.sleep(3)
driver.save_screenshot(f"plot-{THEME}.png")
driver.quit()
Runnable source as JSON, for any HTTP client: https://api.anyplot.ai/specs/circos-basic/bokeh/code. Any spec id and library id listed in llms-full.txt fit the same URL shape; every URL below is complete and callable.
{
  "spec_id": "circos-basic",
  "language": "python",
  "library": "bokeh",
  "page": "https://anyplot.ai/circos-basic/python/bokeh",
  "hub": "https://anyplot.ai/circos-basic",
  "code_json": "https://api.anyplot.ai/specs/circos-basic/bokeh/code",
  "spec_json": "https://api.anyplot.ai/specs/circos-basic",
  "render_light_png": "https://storage.googleapis.com/anyplot-images/plots/circos-basic/python/bokeh/plot-light.png",
  "render_dark_png": "https://storage.googleapis.com/anyplot-images/plots/circos-basic/python/bokeh/plot-dark.png",
  "interactive_light_html": "https://storage.googleapis.com/anyplot-images/plots/circos-basic/python/bokeh/plot-light.html",
  "interactive_dark_html": "https://storage.googleapis.com/anyplot-images/plots/circos-basic/python/bokeh/plot-dark.html",
  "quality_score": 94.0,
  "license": "MIT",
  "guide": "https://anyplot.ai/llms.txt"
}
Part of Circos Plot on anyplot.ai.