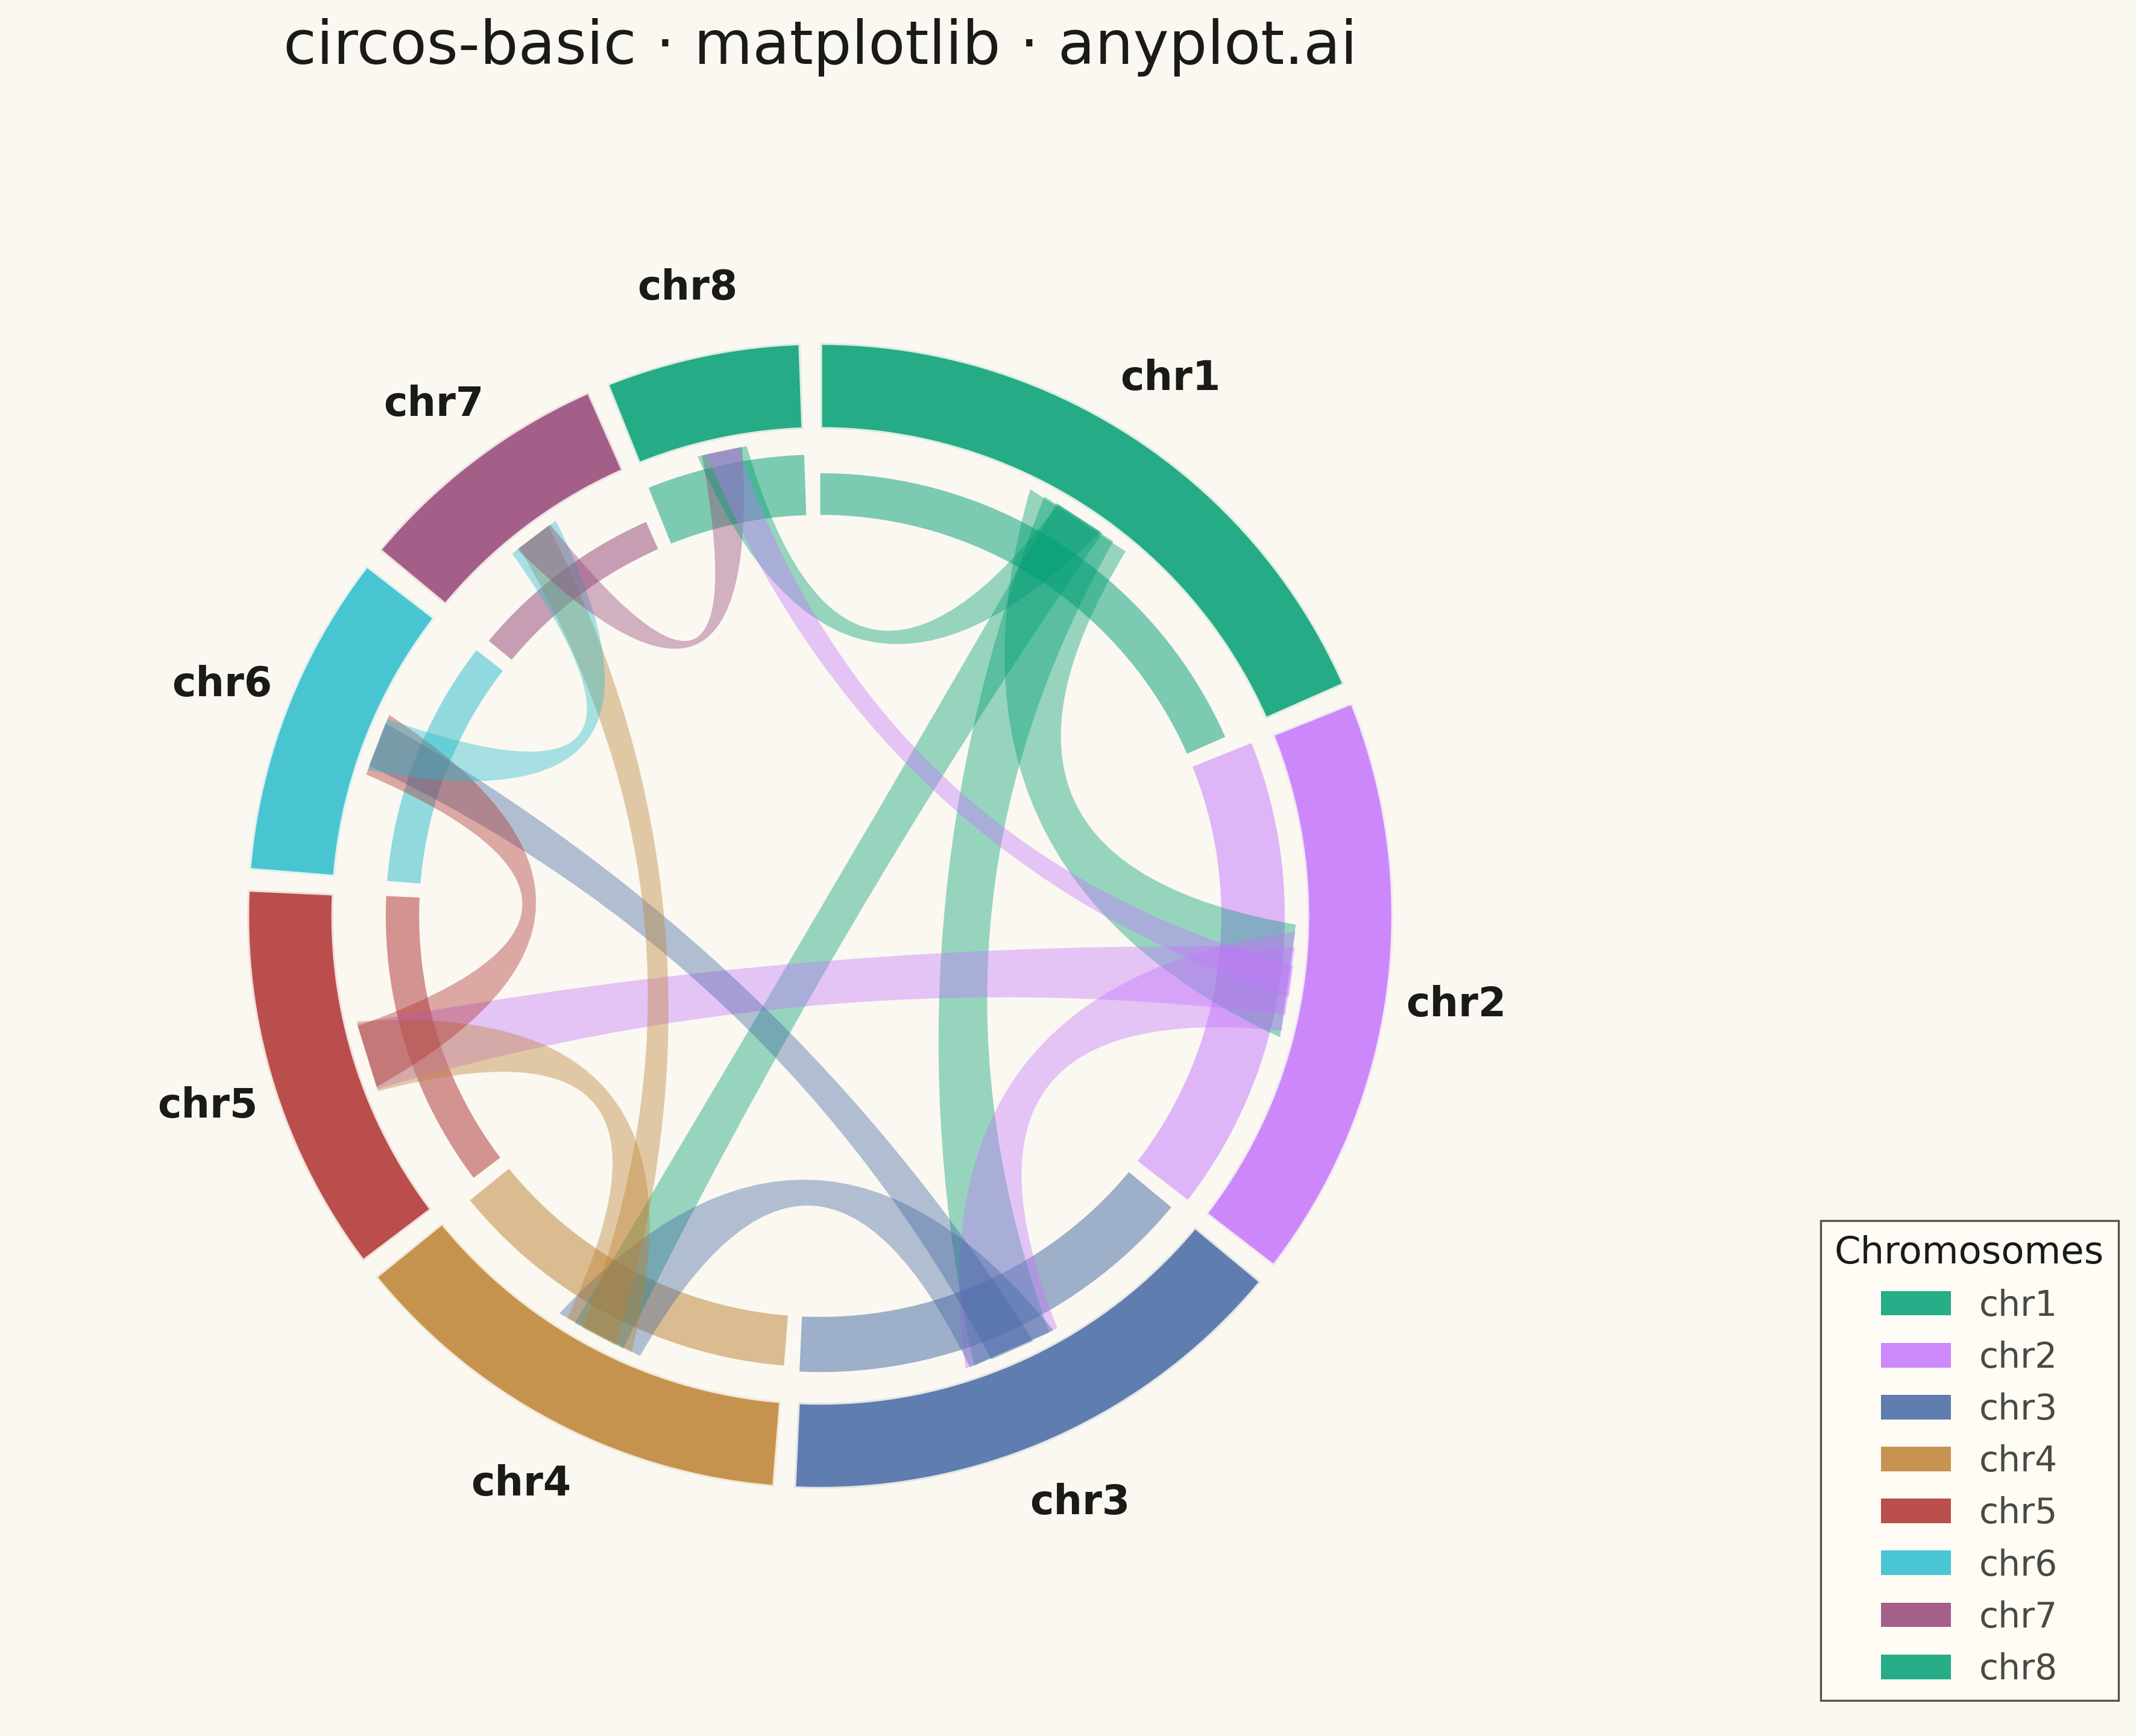
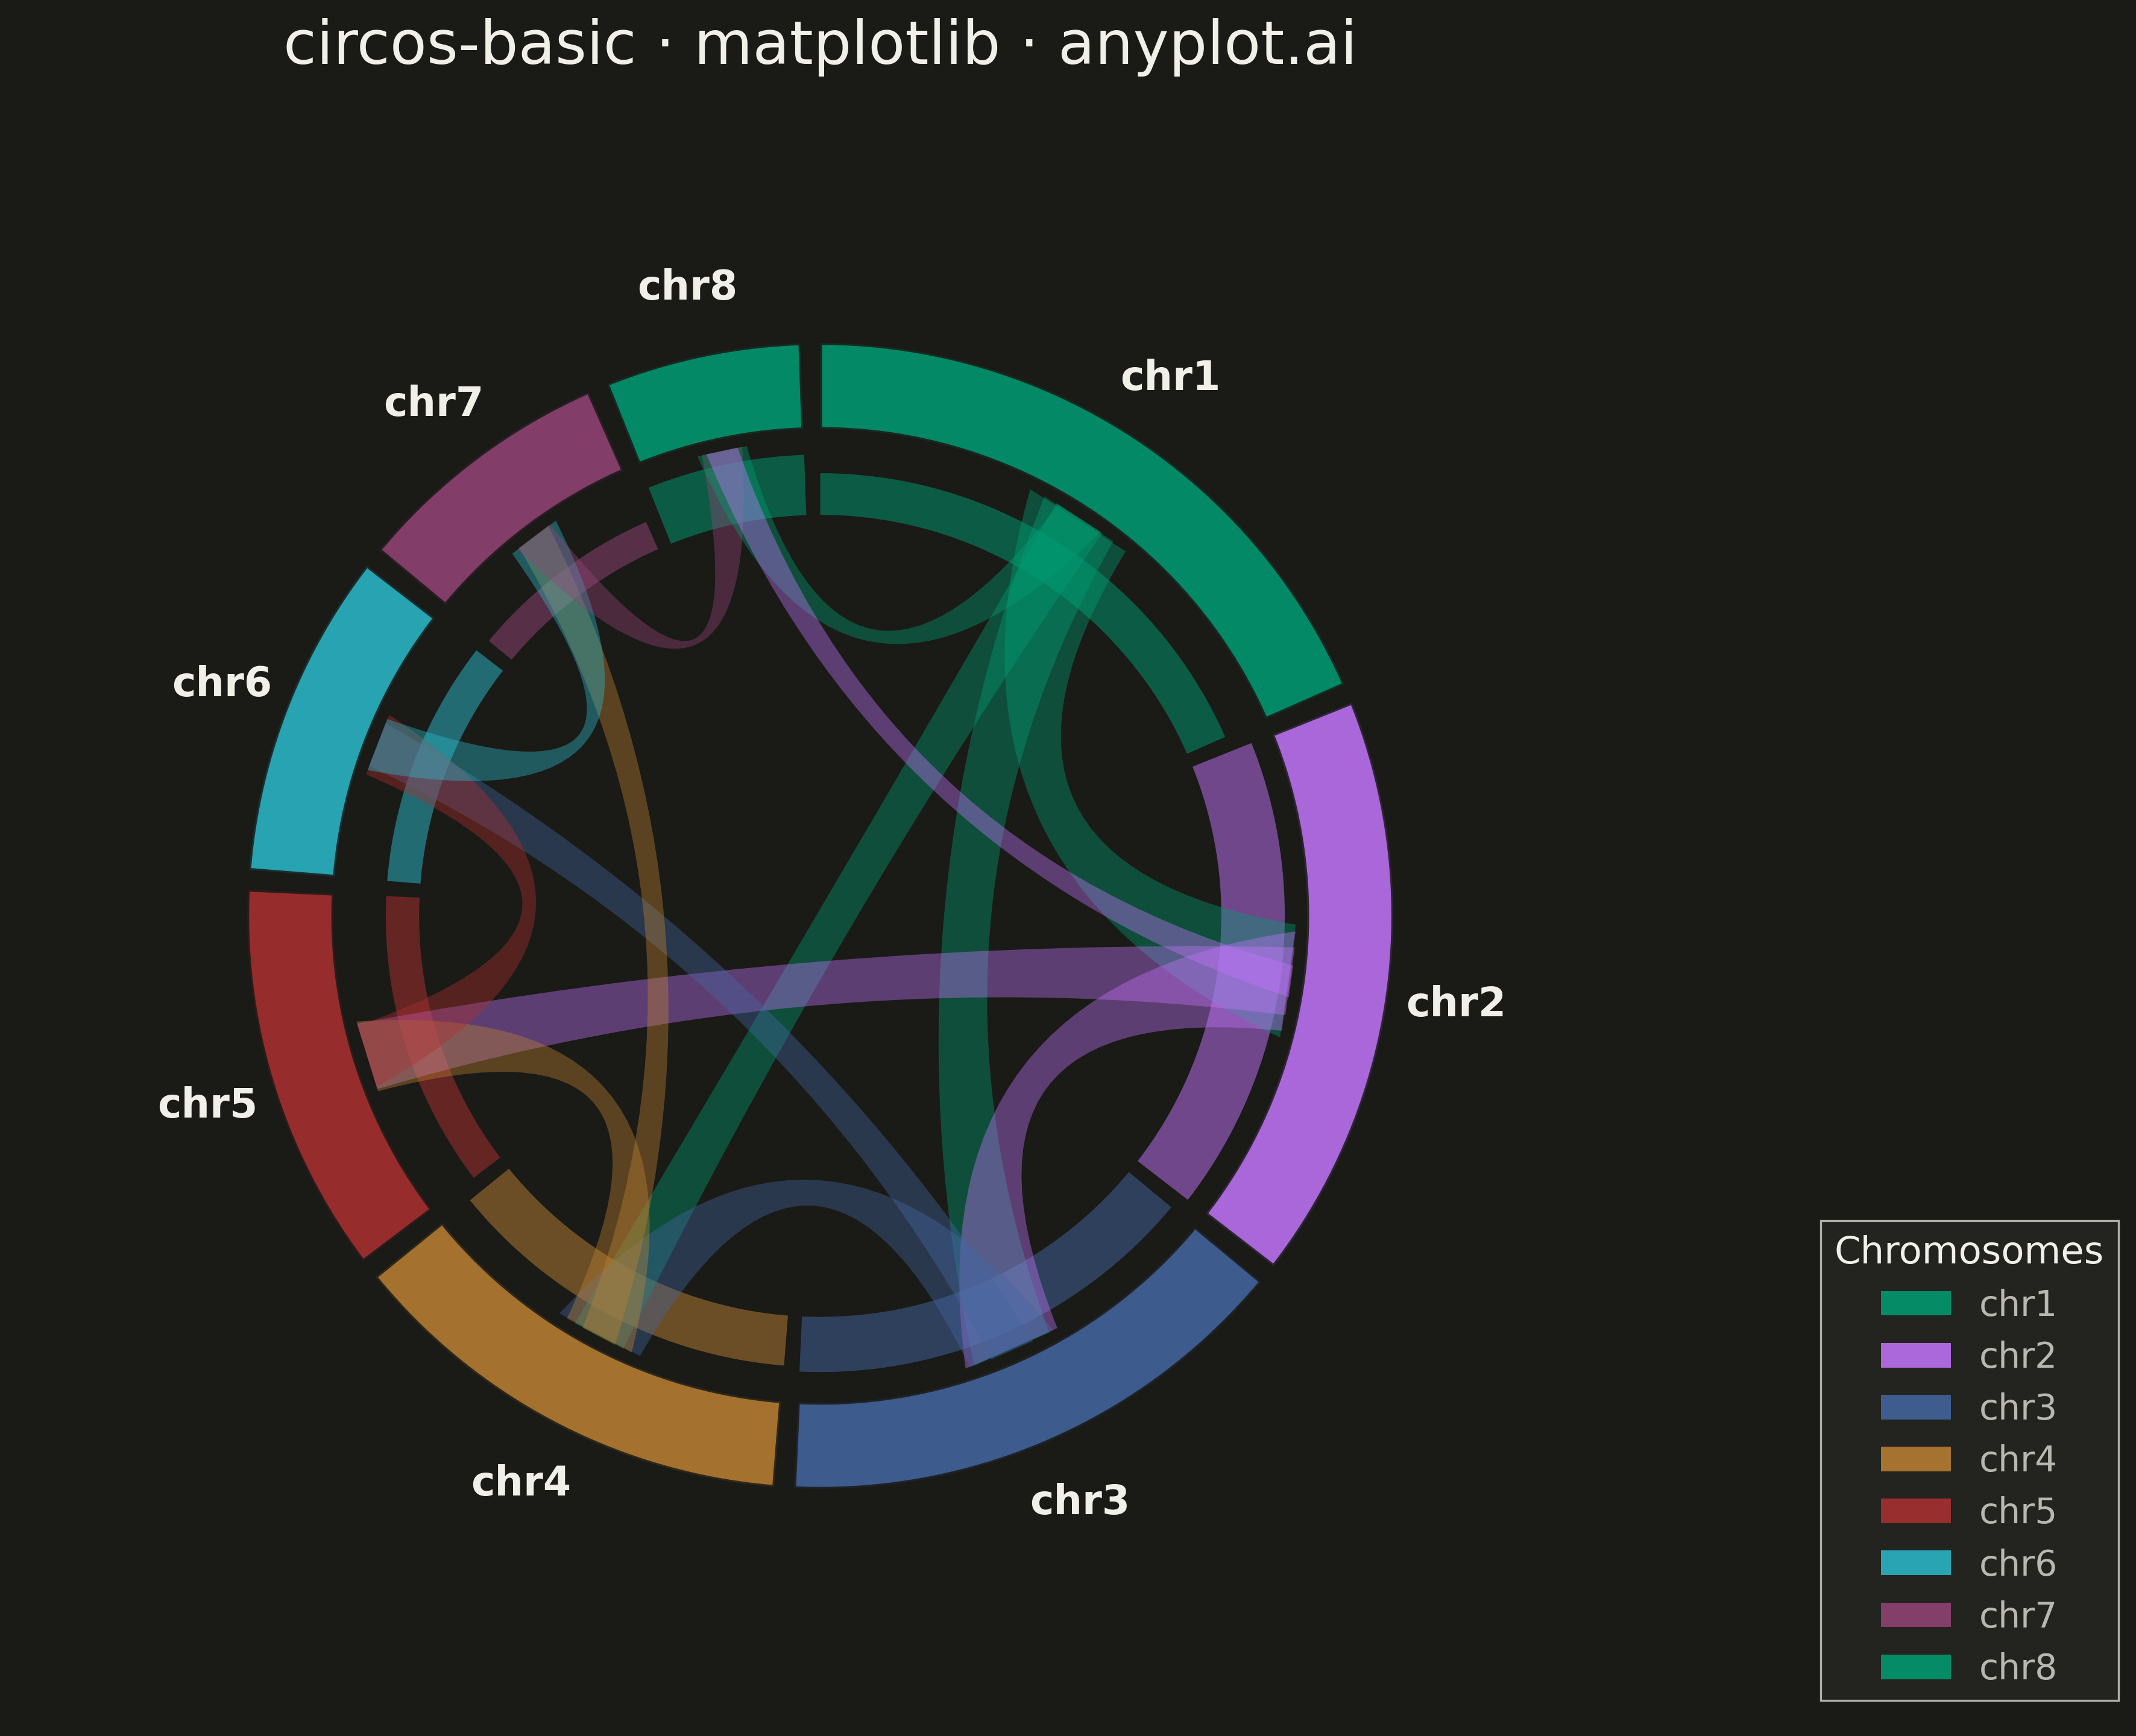
A Circos plot is a circular visualization that displays data on concentric tracks arranged around a circle, with ribbons or arcs connecting related segments across the circular layout. Originally designed for genomic data visualization, it excels at showing relationships between segments while simultaneously displaying multiple data attributes on different tracks. The circular arrangement makes efficient use of space and reveals patterns in complex relational data.
""" anyplot.ai
circos-basic: Circos Plot
Library: matplotlib 3.10.9 | Python 3.13.13
Quality: 91/100 | Updated: 2026-05-15
"""

import os
import sys


# Remove current directory from path to avoid name collision with this script
sys.path = [p for p in sys.path if p != ""]

import matplotlib.patches as mpatches
import matplotlib.pyplot as plt
import numpy as np
from matplotlib.path import Path


# Theme tokens
THEME = os.getenv("ANYPLOT_THEME", "light")
PAGE_BG = "#FAF8F1" if THEME == "light" else "#1A1A17"
ELEVATED_BG = "#FFFDF6" if THEME == "light" else "#242420"
INK = "#1A1A17" if THEME == "light" else "#F0EFE8"
INK_SOFT = "#4A4A44" if THEME == "light" else "#B8B7B0"

# Okabe-Ito palette (positions 1-7, plus position 8 for neutral)
IMPRINT = [
    "#009E73",  # 1: bluish green (brand)
    "#C475FD",  # 2: vermillion
    "#4467A3",  # 3: blue
    "#BD8233",  # 4: reddish purple
    "#AE3030",  # 5: orange
    "#2ABCCD",  # 6: sky blue
    "#954477",  # 7: yellow
]

# Data: Genomic chromosome interactions
np.random.seed(42)

# Define chromosomes
chromosomes = ["chr1", "chr2", "chr3", "chr4", "chr5", "chr6", "chr7", "chr8"]
n_chroms = len(chromosomes)

# Chromosome sizes (relative size on outer ring)
chrom_sizes = np.array([200, 180, 160, 140, 120, 100, 80, 60])
chrom_sizes = chrom_sizes / chrom_sizes.sum() * 360  # Convert to degrees

# Inter-chromosomal connections (synteny blocks)
connections = [
    ("chr1", "chr2", 25),
    ("chr1", "chr3", 18),
    ("chr1", "chr4", 12),
    ("chr2", "chr3", 22),
    ("chr2", "chr5", 15),
    ("chr3", "chr4", 20),
    ("chr3", "chr6", 10),
    ("chr4", "chr5", 16),
    ("chr4", "chr7", 8),
    ("chr5", "chr6", 14),
    ("chr6", "chr7", 12),
    ("chr7", "chr8", 9),
    ("chr1", "chr8", 11),
    ("chr2", "chr8", 7),
]

# Create figure (square for circular plot)
fig, ax = plt.subplots(figsize=(12, 12), facecolor=PAGE_BG)
ax.set_aspect("equal")
ax.axis("off")

# Calculate segment positions
gap = 2  # Gap between segments in degrees
total_gap = gap * n_chroms
available = 360 - total_gap
segment_angles = chrom_sizes / 360 * available

# Calculate start and end angles for each segment
starts = []
ends = []
current = 90  # Start at top

for angle in segment_angles:
    starts.append(current)
    ends.append(current - angle)
    current = current - angle - gap

chrom_dict = {name: i for i, name in enumerate(chromosomes)}

# Draw outer ring segments
r_outer = 1.0
r_inner = 0.85
n_arc_points = 50

for i in range(n_chroms):
    start, end = starts[i], ends[i]
    theta1_rad = np.radians(end)
    theta2_rad = np.radians(start)
    theta = np.linspace(theta1_rad, theta2_rad, n_arc_points)

    # Outer arc
    x_outer = r_outer * np.cos(theta)
    y_outer = r_outer * np.sin(theta)
    # Inner arc (reversed)
    x_inner = r_inner * np.cos(theta[::-1])
    y_inner = r_inner * np.sin(theta[::-1])
    # Combine into closed polygon
    x = np.concatenate([x_outer, x_inner])
    y = np.concatenate([y_outer, y_inner])

    color_idx = i % len(IMPRINT)
    ax.fill(x, y, color=IMPRINT[color_idx], alpha=0.85, edgecolor=PAGE_BG, linewidth=1.5)

    # Add segment label
    mid_angle = np.radians((start + end) / 2)
    label_r = r_outer + 0.12
    lx = label_r * np.cos(mid_angle)
    ly = label_r * np.sin(mid_angle)
    ax.text(lx, ly, chromosomes[i], fontsize=16, fontweight="bold", ha="center", va="center", color=INK)

# Draw inner data track (simulated expression values)
track_data = np.random.uniform(0.4, 0.95, n_chroms)
r_track_outer = 0.82
r_track_inner = 0.70

for i in range(n_chroms):
    start, end = starts[i], ends[i]
    track_height = (r_track_outer - r_track_inner) * track_data[i]
    theta1_rad = np.radians(end)
    theta2_rad = np.radians(start)
    theta = np.linspace(theta1_rad, theta2_rad, n_arc_points)

    x_outer = (r_track_inner + track_height) * np.cos(theta)
    y_outer = (r_track_inner + track_height) * np.sin(theta)
    x_inner = r_track_inner * np.cos(theta[::-1])
    y_inner = r_track_inner * np.sin(theta[::-1])
    x = np.concatenate([x_outer, x_inner])
    y = np.concatenate([y_outer, y_inner])

    color_idx = i % len(IMPRINT)
    ax.fill(x, y, color=IMPRINT[color_idx], alpha=0.5, edgecolor="none")

# Draw connections (ribbons for synteny blocks)
max_value = max(c[2] for c in connections)
r_ribbon = r_inner - 0.02

for source, target, value in connections:
    idx1 = chrom_dict[source]
    idx2 = chrom_dict[target]

    # Calculate positions within segments
    mid1 = np.radians((starts[idx1] + ends[idx1]) / 2)
    mid2 = np.radians((starts[idx2] + ends[idx2]) / 2)

    # Ribbon width proportional to value
    width_factor = value / max_value * 0.12

    # Points for segment 1
    angle1_start = mid1 - width_factor
    angle1_end = mid1 + width_factor
    x1_start = r_ribbon * np.cos(angle1_start)
    y1_start = r_ribbon * np.sin(angle1_start)
    x1_end = r_ribbon * np.cos(angle1_end)
    y1_end = r_ribbon * np.sin(angle1_end)

    # Points for segment 2
    angle2_start = mid2 - width_factor
    angle2_end = mid2 + width_factor
    x2_start = r_ribbon * np.cos(angle2_start)
    y2_start = r_ribbon * np.sin(angle2_start)
    x2_end = r_ribbon * np.cos(angle2_end)
    y2_end = r_ribbon * np.sin(angle2_end)

    # Control points at center for bezier curves
    ctrl_factor = 0.3
    ctrl1_x = ctrl_factor * (x1_start + x2_end) / 2
    ctrl1_y = ctrl_factor * (y1_start + y2_end) / 2
    ctrl2_x = ctrl_factor * (x1_end + x2_start) / 2
    ctrl2_y = ctrl_factor * (y1_end + y2_start) / 2

    # Path vertices
    verts = [
        (x1_start, y1_start),
        (ctrl1_x, ctrl1_y),
        (x2_end, y2_end),
        (x2_start, y2_start),
        (ctrl2_x, ctrl2_y),
        (x1_end, y1_end),
        (x1_start, y1_start),
    ]
    codes = [Path.MOVETO, Path.CURVE3, Path.CURVE3, Path.LINETO, Path.CURVE3, Path.CURVE3, Path.CLOSEPOLY]

    path = Path(verts, codes)
    color_idx = idx1 % len(IMPRINT)
    patch = mpatches.PathPatch(path, facecolor=IMPRINT[color_idx], alpha=0.4, edgecolor="none")
    ax.add_patch(patch)

# Title
ax.set_title("circos-basic · matplotlib · anyplot.ai", fontsize=24, fontweight="medium", color=INK, pad=20)

# Set limits with padding
ax.set_xlim(-1.4, 1.4)
ax.set_ylim(-1.4, 1.4)

# Legend (outside the plot)
legend_elements = [
    mpatches.Patch(facecolor=IMPRINT[i % len(IMPRINT)], label=chromosomes[i], alpha=0.85) for i in range(n_chroms)
]
leg = ax.legend(
    handles=legend_elements,
    loc="lower right",
    fontsize=14,
    frameon=True,
    fancybox=False,
    framealpha=0.95,
    ncol=1,
    bbox_to_anchor=(1.32, 0.0),
    title="Chromosomes",
    title_fontsize=15,
)

# Style legend
if leg:
    leg.get_frame().set_facecolor(ELEVATED_BG)
    leg.get_frame().set_edgecolor(INK_SOFT)
    leg.get_frame().set_linewidth(0.8)
    plt.setp(leg.get_texts(), color=INK_SOFT)
    plt.setp(leg.get_title(), color=INK)

plt.tight_layout()
plt.savefig(f"plot-{THEME}.png", dpi=300, bbox_inches="tight", facecolor=PAGE_BG)
Runnable source as JSON, for any HTTP client: https://api.anyplot.ai/specs/circos-basic/matplotlib/code. Any spec id and library id listed in llms-full.txt fit the same URL shape; every URL below is complete and callable.
{
  "spec_id": "circos-basic",
  "language": "python",
  "library": "matplotlib",
  "page": "https://anyplot.ai/circos-basic/python/matplotlib",
  "hub": "https://anyplot.ai/circos-basic",
  "code_json": "https://api.anyplot.ai/specs/circos-basic/matplotlib/code",
  "spec_json": "https://api.anyplot.ai/specs/circos-basic",
  "render_light_png": "https://storage.googleapis.com/anyplot-images/plots/circos-basic/python/matplotlib/plot-light.png",
  "render_dark_png": "https://storage.googleapis.com/anyplot-images/plots/circos-basic/python/matplotlib/plot-dark.png",
  "quality_score": 91.0,
  "license": "MIT",
  "guide": "https://anyplot.ai/llms.txt"
}
Part of Circos Plot on anyplot.ai.