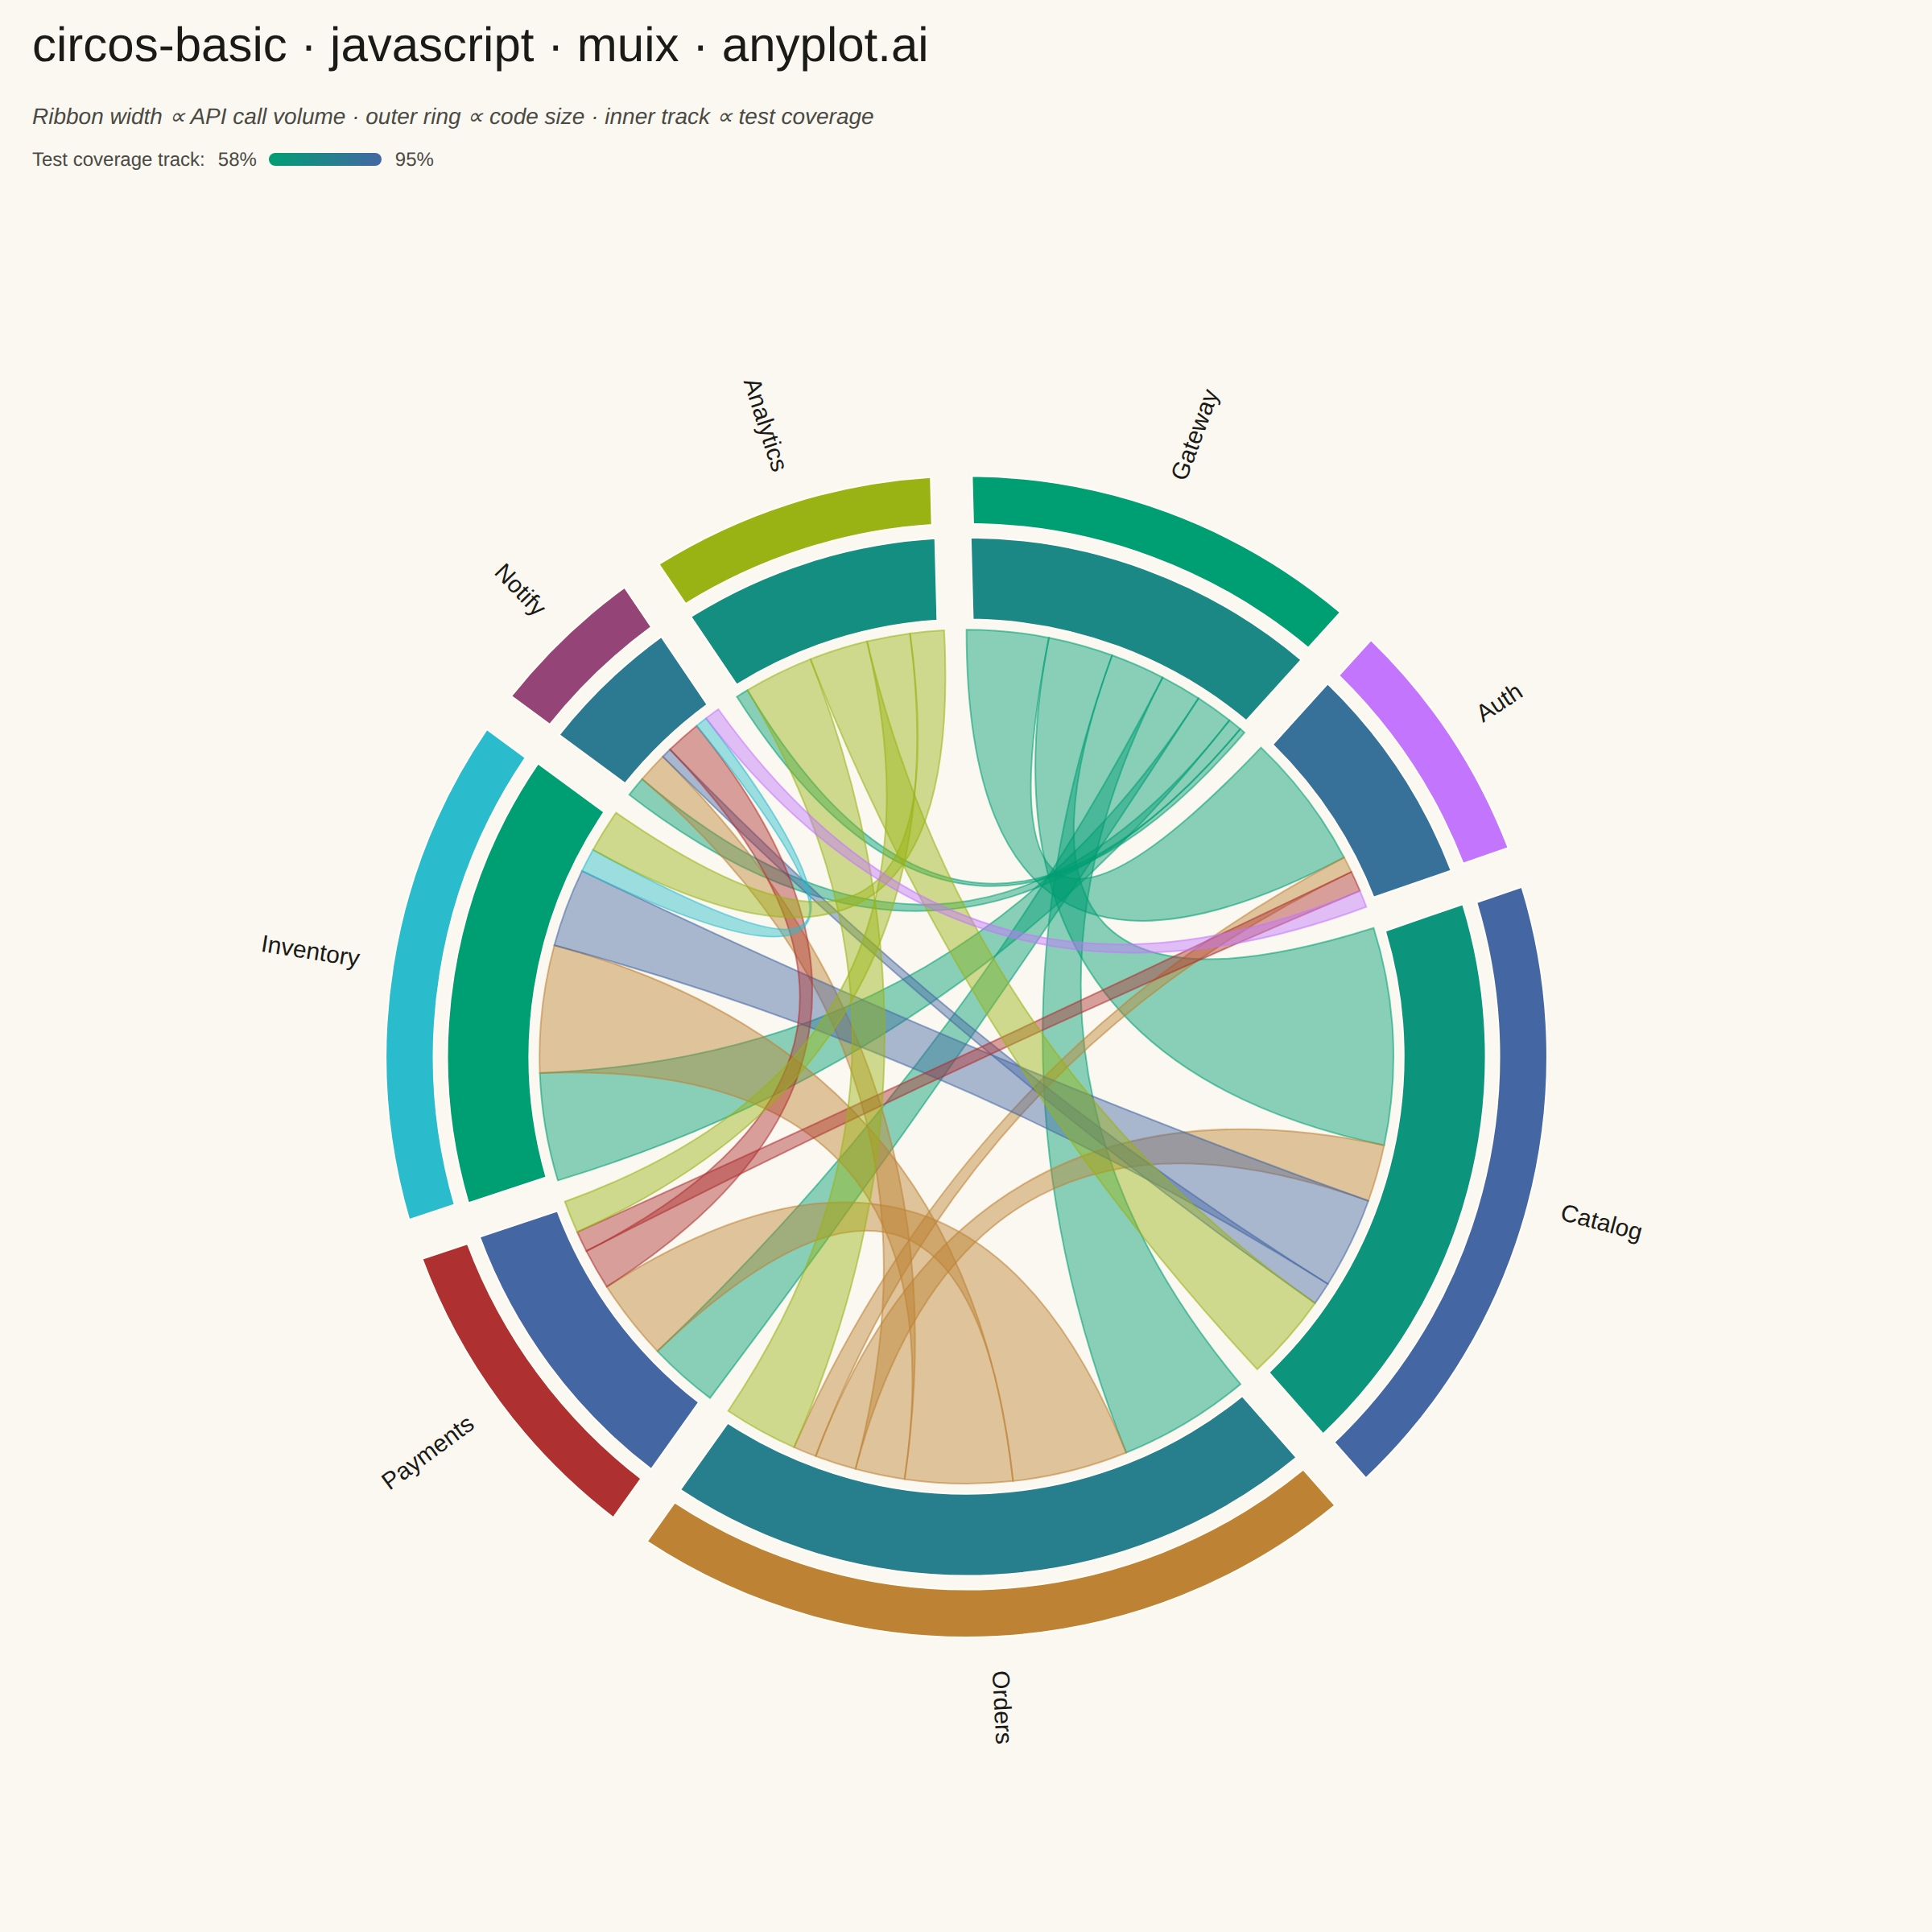
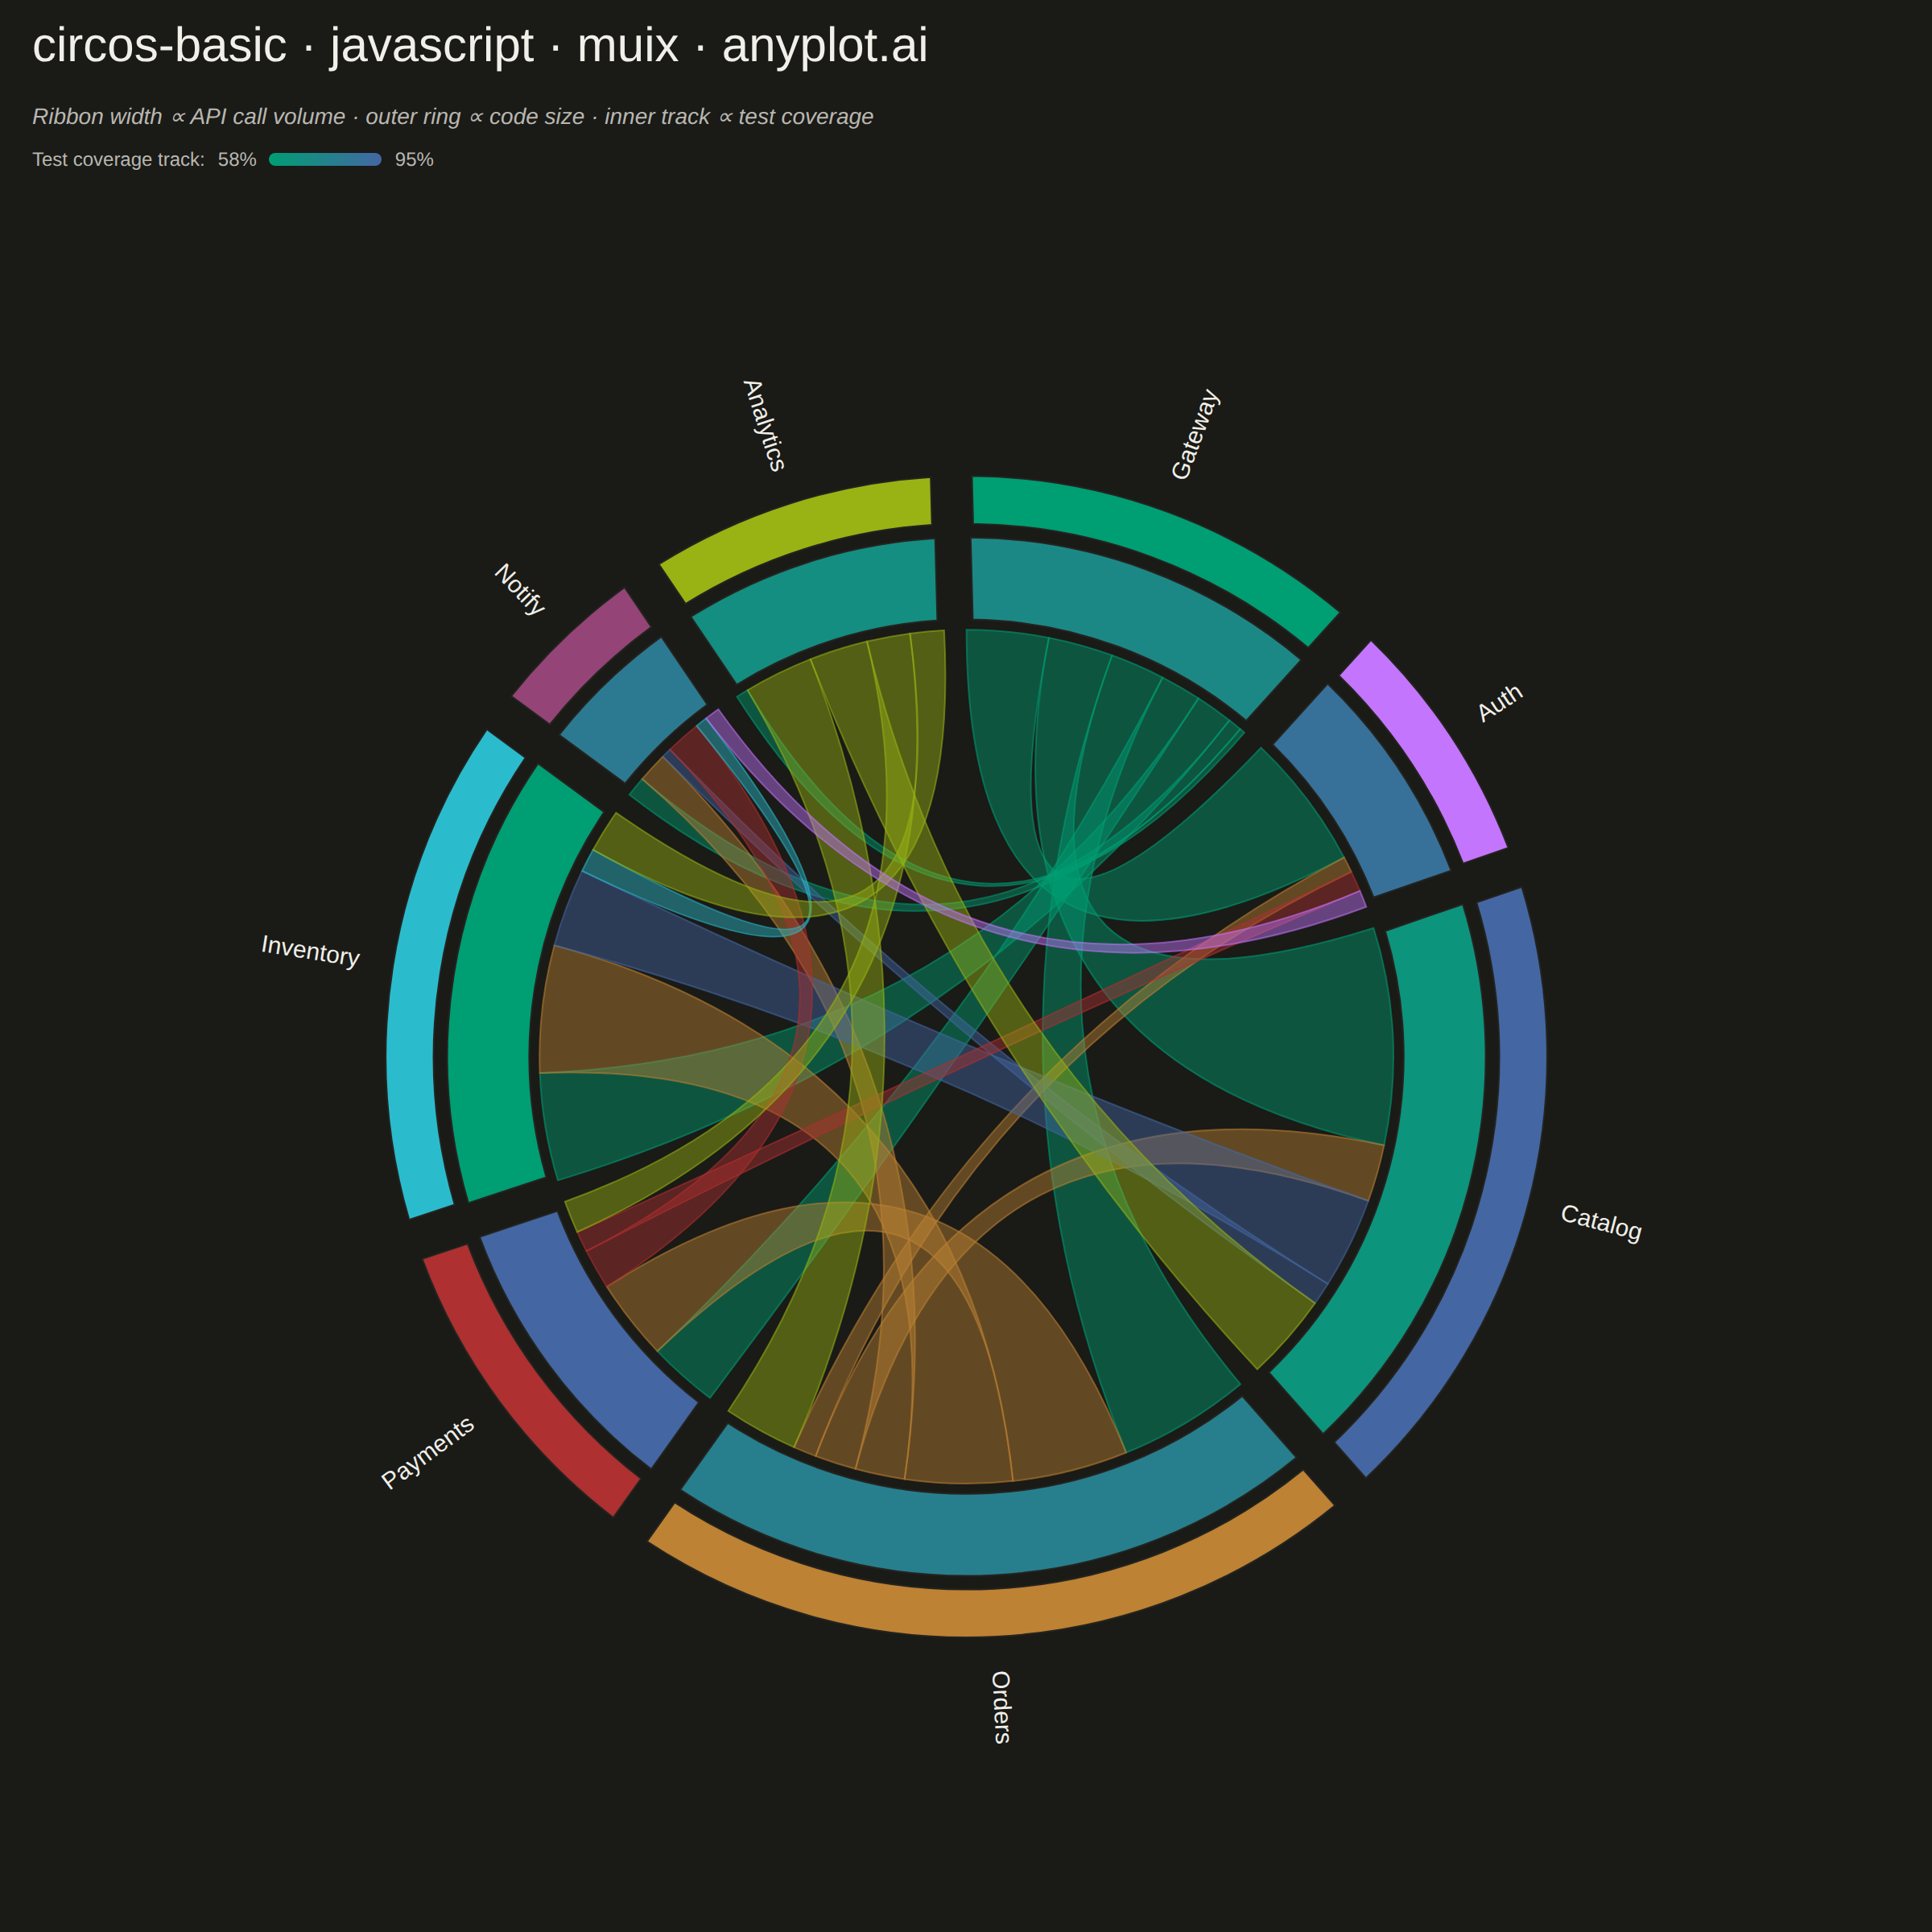
The same plot in 14 other libraries — JavaScript: Chart.js, D3.js, Apache ECharts, Highcharts; Python: Altair, Bokeh, lets-plot, Matplotlib, Plotly, plotnine, Pygal, Seaborn; R: ggplot2; Julia: Makie.jl. Compare all 15 side by side: Circos Plot in Python, R, Julia and JavaScript.
A Circos plot is a circular visualization that displays data on concentric tracks arranged around a circle, with ribbons or arcs connecting related segments across the circular layout. Originally designed for genomic data visualization, it excels at showing relationships between segments while simultaneously displaying multiple data attributes on different tracks. The circular arrangement makes efficient use of space and reveals patterns in complex relational data.
// anyplot.ai
// circos-basic: Circos Plot
// Library: muix 7.29.1 | JavaScript 22.23.2
// Quality: 89/100 | Created: 2026-09-04
//# anyplot-orientation: square
// anyplot.ai
// circos-basic: Circos Plot
// Library: MUI X Charts | React | Node 22
// License: @mui/x-charts — MIT (community). Pro/Premium are out of scope.
// Quality: pending | Created: 2026-09-04
import { ChartContainer } from "@mui/x-charts/ChartContainer";
import { PiePlot } from "@mui/x-charts/PieChart";
import { ChartsTooltip } from "@mui/x-charts/ChartsTooltip";

const t = window.ANYPLOT_TOKENS;

// --- Data: microservice call graph -----------------------------------------
// Segments = services (outer ring, arc length ∝ code size). Ribbons = call
// volume between services (width ∝ value). Inner track = test coverage.
const MODULES = [
  "Gateway",
  "Auth",
  "Catalog",
  "Orders",
  "Payments",
  "Inventory",
  "Notify",
  "Analytics",
];
const CODE_SIZE_KLOC = [22, 14, 35, 40, 18, 28, 9, 16]; // segment_size
const TEST_COVERAGE = [73, 88, 65, 79, 95, 58, 82, 69]; // track_data (%)

const CONNECTIONS = [
  { source: "Gateway", target: "Auth", value: 120 },
  { source: "Gateway", target: "Catalog", value: 95 },
  { source: "Gateway", target: "Orders", value: 80 },
  { source: "Gateway", target: "Payments", value: 60 },
  { source: "Gateway", target: "Inventory", value: 55 },
  { source: "Gateway", target: "Notify", value: 20 },
  { source: "Gateway", target: "Analytics", value: 8 },
  { source: "Orders", target: "Payments", value: 70 },
  { source: "Orders", target: "Inventory", value: 65 },
  { source: "Orders", target: "Notify", value: 30 },
  { source: "Orders", target: "Catalog", value: 25 },
  { source: "Orders", target: "Auth", value: 14 },
  { source: "Catalog", target: "Inventory", value: 40 },
  { source: "Catalog", target: "Notify", value: 10 },
  { source: "Payments", target: "Notify", value: 35 },
  { source: "Payments", target: "Auth", value: 18 },
  { source: "Inventory", target: "Notify", value: 12 },
  { source: "Analytics", target: "Orders", value: 45 },
  { source: "Analytics", target: "Catalog", value: 38 },
  { source: "Analytics", target: "Payments", value: 28 },
  { source: "Analytics", target: "Inventory", value: 22 },
  { source: "Auth", target: "Notify", value: 15 },
];

const GAP_DEG = 3;

// Segments arranged clockwise from 12 o'clock, span ∝ code size, fixed gaps
// between neighbors for visual separation. This is the single source of
// truth for the ribbon/label geometry below, AND it exactly matches what MUI
// X's <PiePlot> renders for the two pie series further down (see
// PIE_START_ANGLE/PIE_END_ANGLE) — both use the real @mui/x-charts-vendored
// d3 `pie()` layout: cumulative value share + trailing `paddingAngle`.
const buildSegments = () => {
  const totalSize = CODE_SIZE_KLOC.reduce((a, b) => a + b, 0);
  const availableDeg = 360 - GAP_DEG * MODULES.length;
  let cursor = 0;
  return MODULES.map((name, i) => {
    const span = (CODE_SIZE_KLOC[i] / totalSize) * availableDeg;
    const startAngle = cursor;
    const endAngle = cursor + span;
    cursor = endAngle + GAP_DEG;
    return {
      name,
      startAngle,
      endAngle,
      color: t.palette[i % t.palette.length],
      codeSize: CODE_SIZE_KLOC[i],
      coverage: TEST_COVERAGE[i],
    };
  });
};

const SEGMENTS = buildSegments();
const SEGMENT_BY_NAME = Object.fromEntries(SEGMENTS.map((s) => [s.name, s]));

// Subdivide each segment's angular span among the connections that touch it
// (as source or target), proportional to connection value — the classic
// chord-diagram allocation. Ribbons are colored by their source segment.
const buildRibbons = () => {
  const touchTotal = {};
  SEGMENTS.forEach((s) => {
    touchTotal[s.name] = 0;
  });
  CONNECTIONS.forEach((c) => {
    touchTotal[c.source] += c.value;
    touchTotal[c.target] += c.value;
  });

  const cursor = {};
  SEGMENTS.forEach((s) => {
    cursor[s.name] = s.startAngle;
  });

  return CONNECTIONS.map((c) => {
    const segS = SEGMENT_BY_NAME[c.source];
    const segT = SEGMENT_BY_NAME[c.target];
    const spanS =
      (c.value / touchTotal[c.source]) * (segS.endAngle - segS.startAngle);
    const spanT =
      (c.value / touchTotal[c.target]) * (segT.endAngle - segT.startAngle);
    const sStart = cursor[c.source];
    const sEnd = sStart + spanS;
    cursor[c.source] = sEnd;
    const tStart = cursor[c.target];
    const tEnd = tStart + spanT;
    cursor[c.target] = tEnd;
    return { ...c, sStart, sEnd, tStart, tEnd, color: segS.color };
  });
};

const RIBBONS = buildRibbons();

// --- Geometry helpers for the ribbons (chords) and radial labels -----------
// MUI X's community chart types have no ribbon/chord mark, so these two marks
// stay hand-drawn (angle 0 = 12 o'clock, increasing = clockwise, same
// convention d3/MUI X uses for its own pie arcs).
const toRad = (deg) => (deg * Math.PI) / 180;
const polarPoint = (cx, cy, angleDeg, radius) => ({
  x: cx + radius * Math.sin(toRad(angleDeg)),
  y: cy - radius * Math.cos(toRad(angleDeg)),
});

const ribbonPath = (cx, cy, sStart, sEnd, tStart, tEnd, radius) => {
  const largeS = sEnd - sStart > 180 ? 1 : 0;
  const largeT = tEnd - tStart > 180 ? 1 : 0;
  const p1 = polarPoint(cx, cy, sStart, radius);
  const p2 = polarPoint(cx, cy, sEnd, radius);
  const p3 = polarPoint(cx, cy, tStart, radius);
  const p4 = polarPoint(cx, cy, tEnd, radius);
  return [
    `M ${p1.x} ${p1.y}`,
    `A ${radius} ${radius} 0 ${largeS} 1 ${p2.x} ${p2.y}`,
    `Q ${cx} ${cy} ${p3.x} ${p3.y}`,
    `A ${radius} ${radius} 0 ${largeT} 1 ${p4.x} ${p4.y}`,
    `Q ${cx} ${cy} ${p1.x} ${p1.y}`,
    "Z",
  ].join(" ");
};

const hexToRgb = (hex) => {
  const clean = hex.replace("#", "");
  const value = parseInt(clean, 16);
  return [(value >> 16) & 255, (value >> 8) & 255, value & 255];
};

const lerpColor = (hexA, hexB, ratio) => {
  const a = hexToRgb(hexA);
  const b = hexToRgb(hexB);
  const c = a.map((v, i) => Math.round(v + (b[i] - v) * ratio));
  return `rgb(${c[0]}, ${c[1]}, ${c[2]})`;
};

const COVERAGE_MIN = Math.min(...TEST_COVERAGE);
const COVERAGE_MAX = Math.max(...TEST_COVERAGE);

// --- The two rings as genuine @mui/x-charts pie series ----------------------
// A circos ring (segments with gaps, arc length ∝ value) is exactly what a
// MUI X pie series already computes via d3's pie() layout: cumulative value
// share + a trailing `paddingAngle`. `PIE_START_ANGLE`/`PIE_END_ANGLE` cancel
// out d3's half-`paddingAngle` offset (its first slice starts at
// `startAngle + paddingAngle / 2`) so the rendered ring lands on the exact
// same angles as SEGMENTS above — that's what lets the hand-drawn ribbons
// attach cleanly to the MUI-rendered outer ring.
const PIE_START_ANGLE = -GAP_DEG / 2;
const PIE_END_ANGLE = 360 - GAP_DEG / 2;

const segmentSeriesData = SEGMENTS.map((s) => ({
  id: s.name,
  value: s.codeSize,
  label: `${s.name} · ${s.codeSize} kLOC`,
  color: s.color,
}));

const trackSeriesData = SEGMENTS.map((s) => {
  const ratio =
    (s.coverage - COVERAGE_MIN) / (COVERAGE_MAX - COVERAGE_MIN || 1);
  return {
    id: `${s.name}-coverage`,
    value: s.codeSize, // same values as the segments series => identical angular spans
    label: `${s.name} · ${s.coverage}% test coverage`,
    color: lerpColor(t.seq[0], t.seq[1], ratio),
  };
});

const RADIUS_RATIO = {
  segOuter: 0.85,
  segThickness: 0.07,
  trackGap: 0.02,
  trackThickness: 0.12,
  ribbonGap: 0.015,
  labelGap: 0.05,
};

const computeRadii = (r) => {
  const rSegOuter = r * RADIUS_RATIO.segOuter;
  const rSegInner = rSegOuter - r * RADIUS_RATIO.segThickness;
  const rTrackOuter = rSegInner - r * RADIUS_RATIO.trackGap;
  const rTrackBase = rTrackOuter - r * RADIUS_RATIO.trackThickness;
  const rRibbon = rTrackBase - r * RADIUS_RATIO.ribbonGap;
  const rLabel = rSegOuter + r * RADIUS_RATIO.labelGap;
  return { rSegOuter, rSegInner, rTrackOuter, rTrackBase, rRibbon, rLabel };
};

// --- Chrome ------------------------------------------------------------------
const TITLE = "circos-basic · javascript · muix · anyplot.ai";
const TITLE_FONT_DEFAULT = 30;
const titleFontSize =
  TITLE.length > 67
    ? Math.round(TITLE_FONT_DEFAULT * (67 / TITLE.length))
    : TITLE_FONT_DEFAULT;
const SUBTITLE =
  "Ribbon width ∝ API call volume · outer ring ∝ code size · inner track ∝ test coverage";
const TITLE_H = 58;
const SUBTITLE_H = 28;
const LEGEND_H = 26;

// Ribbons (chords) sit below both pie rings; MUI X has no chord/ribbon mark,
// so they're hand-drawn — see the geometry helpers above.
function RibbonsLayer({ cx, cy, radius }) {
  return (
    <g>
      {RIBBONS.map((rb, i) => (
        <path
          key={`ribbon-${i}`}
          d={ribbonPath(cx, cy, rb.sStart, rb.sEnd, rb.tStart, rb.tEnd, radius)}
          fill={rb.color}
          fillOpacity={0.45}
          stroke={rb.color}
          strokeOpacity={0.55}
          strokeWidth={1}
        />
      ))}
    </g>
  );
}

// Segment name labels, radially rotated around the outer ring.
function SegmentLabelsLayer({ cx, cy, radius }) {
  return (
    <g>
      {SEGMENTS.map((s) => {
        const mid = (s.startAngle + s.endAngle) / 2;
        const p = polarPoint(cx, cy, mid, radius);
        const rotate = mid < 180 ? mid - 90 : mid + 90;
        const anchor = mid < 180 ? "start" : "end";
        return (
          <text
            key={`label-${s.name}`}
            x={p.x}
            y={p.y}
            textAnchor={anchor}
            dominantBaseline="middle"
            fontSize={15}
            fill={t.ink}
            transform={`rotate(${rotate}, ${p.x}, ${p.y})`}
          >
            {s.name}
          </text>
        );
      })}
    </g>
  );
}

function CircosDiagram({ size }) {
  const cx = size / 2;
  const cy = size / 2;
  const { rSegOuter, rSegInner, rTrackOuter, rTrackBase, rRibbon, rLabel } =
    computeRadii(size / 2);

  return (
    <ChartContainer
      width={size}
      height={size}
      margin={{ top: 0, bottom: 0, left: 0, right: 0 }}
      colors={t.palette}
      sx={{ overflow: "visible" }}
      skipAnimation
      series={[
        {
          type: "pie",
          id: "segments",
          data: segmentSeriesData,
          innerRadius: rSegInner,
          outerRadius: rSegOuter,
          startAngle: PIE_START_ANGLE,
          endAngle: PIE_END_ANGLE,
          paddingAngle: GAP_DEG,
          sortingValues: "none",
        },
        {
          type: "pie",
          id: "track",
          data: trackSeriesData,
          innerRadius: rTrackBase,
          outerRadius: rTrackOuter,
          startAngle: PIE_START_ANGLE,
          endAngle: PIE_END_ANGLE,
          paddingAngle: GAP_DEG,
          sortingValues: "none",
        },
      ]}
    >
      <RibbonsLayer cx={cx} cy={cy} radius={rRibbon} />
      <PiePlot skipAnimation />
      <SegmentLabelsLayer cx={cx} cy={cy} radius={rLabel} />
      <ChartsTooltip trigger="item" />
    </ChartContainer>
  );
}

// --- Chart (default-exported component — the harness mounts it) ------------
export default function Chart() {
  const { width, height } = window.ANYPLOT_SIZE;
  const chromeH = TITLE_H + SUBTITLE_H + LEGEND_H;
  // Margin so rotated segment labels never reach the viewport edge (the
  // harness clips at the exact ANYPLOT_SIZE bounds).
  const svgSize = Math.min(width, height - chromeH) * 0.78;

  return (
    <div style={{ width, height, display: "flex", flexDirection: "column" }}>
      <div style={{ paddingLeft: "20px" }}>
        <div
          style={{
            height: `${TITLE_H}px`,
            lineHeight: `${TITLE_H}px`,
            fontSize: `${titleFontSize}px`,
            fontWeight: 500,
            color: t.ink,
          }}
        >
          {TITLE}
        </div>
        <div
          style={{
            height: `${SUBTITLE_H}px`,
            lineHeight: `${SUBTITLE_H}px`,
            fontSize: "14px",
            fontStyle: "italic",
            color: t.inkSoft,
          }}
        >
          {SUBTITLE}
        </div>
        <div
          style={{
            height: `${LEGEND_H}px`,
            display: "flex",
            alignItems: "center",
            gap: "8px",
            fontSize: "12px",
            color: t.inkSoft,
          }}
        >
          <span>Test coverage track:</span>
          <span>{COVERAGE_MIN}%</span>
          <div
            style={{
              width: "70px",
              height: "8px",
              borderRadius: "4px",
              background: `linear-gradient(to right, ${t.seq[0]}, ${t.seq[1]})`,
            }}
          />
          <span>{COVERAGE_MAX}%</span>
        </div>
      </div>
      <div
        style={{
          flex: 1,
          display: "flex",
          alignItems: "center",
          justifyContent: "center",
        }}
      >
        <CircosDiagram size={svgSize} />
      </div>
    </div>
  );
}
Runnable source as JSON, for any HTTP client: https://api.anyplot.ai/specs/circos-basic/muix/code. Any spec id and library id listed in llms-full.txt fit the same URL shape; every URL below is complete and callable.
{
  "spec_id": "circos-basic",
  "language": "javascript",
  "library": "muix",
  "page": "https://anyplot.ai/circos-basic/javascript/muix",
  "hub": "https://anyplot.ai/circos-basic",
  "code_json": "https://api.anyplot.ai/specs/circos-basic/muix/code",
  "spec_json": "https://api.anyplot.ai/specs/circos-basic",
  "render_light_png": "https://storage.googleapis.com/anyplot-images/plots/circos-basic/javascript/muix/plot-light.png",
  "render_dark_png": "https://storage.googleapis.com/anyplot-images/plots/circos-basic/javascript/muix/plot-dark.png",
  "interactive_light_html": "https://storage.googleapis.com/anyplot-images/plots/circos-basic/javascript/muix/plot-light.html",
  "interactive_dark_html": "https://storage.googleapis.com/anyplot-images/plots/circos-basic/javascript/muix/plot-dark.html",
  "quality_score": 89.0,
  "license": "MIT",
  "guide": "https://anyplot.ai/llms.txt"
}
Part of Circos Plot on anyplot.ai.