The same plot in 14 other libraries — JavaScript: Chart.js, D3.js, Apache ECharts, MUI X Charts; Python: Altair, Bokeh, lets-plot, Matplotlib, Plotly, plotnine, Pygal, Seaborn; R: ggplot2; Julia: Makie.jl. Compare all 15 side by side: Circos Plot in Python, R, Julia and JavaScript.
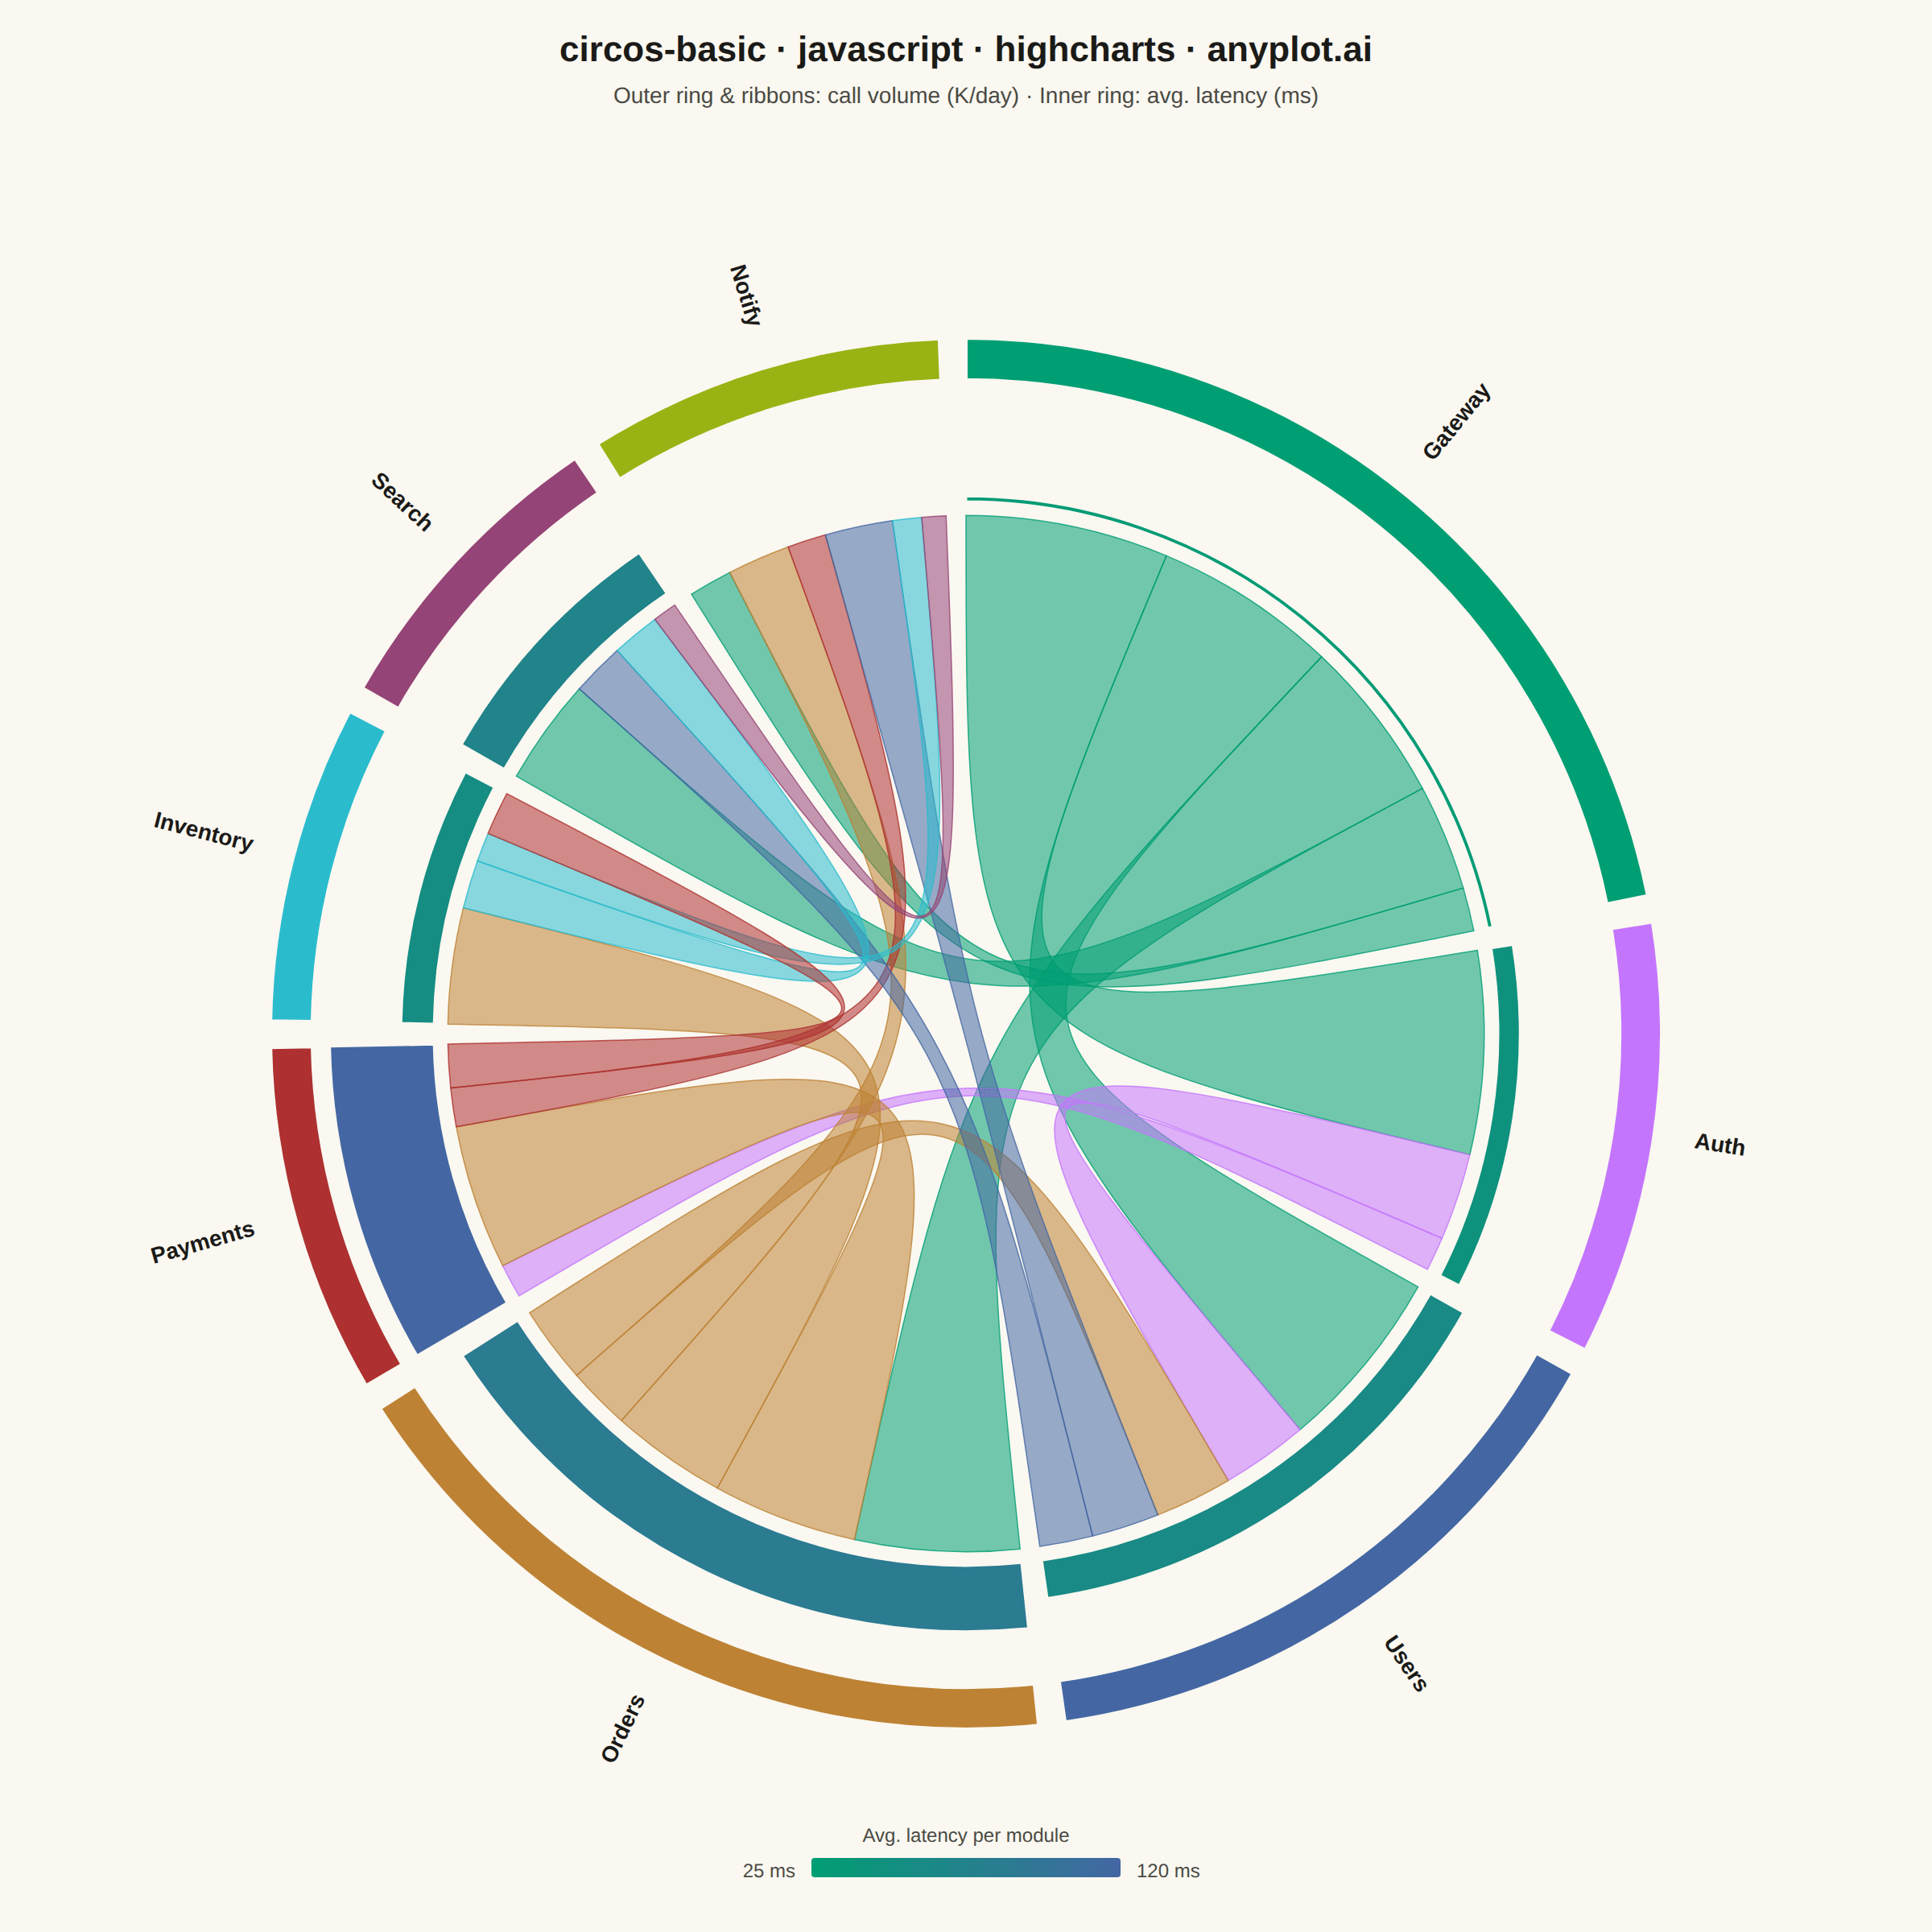
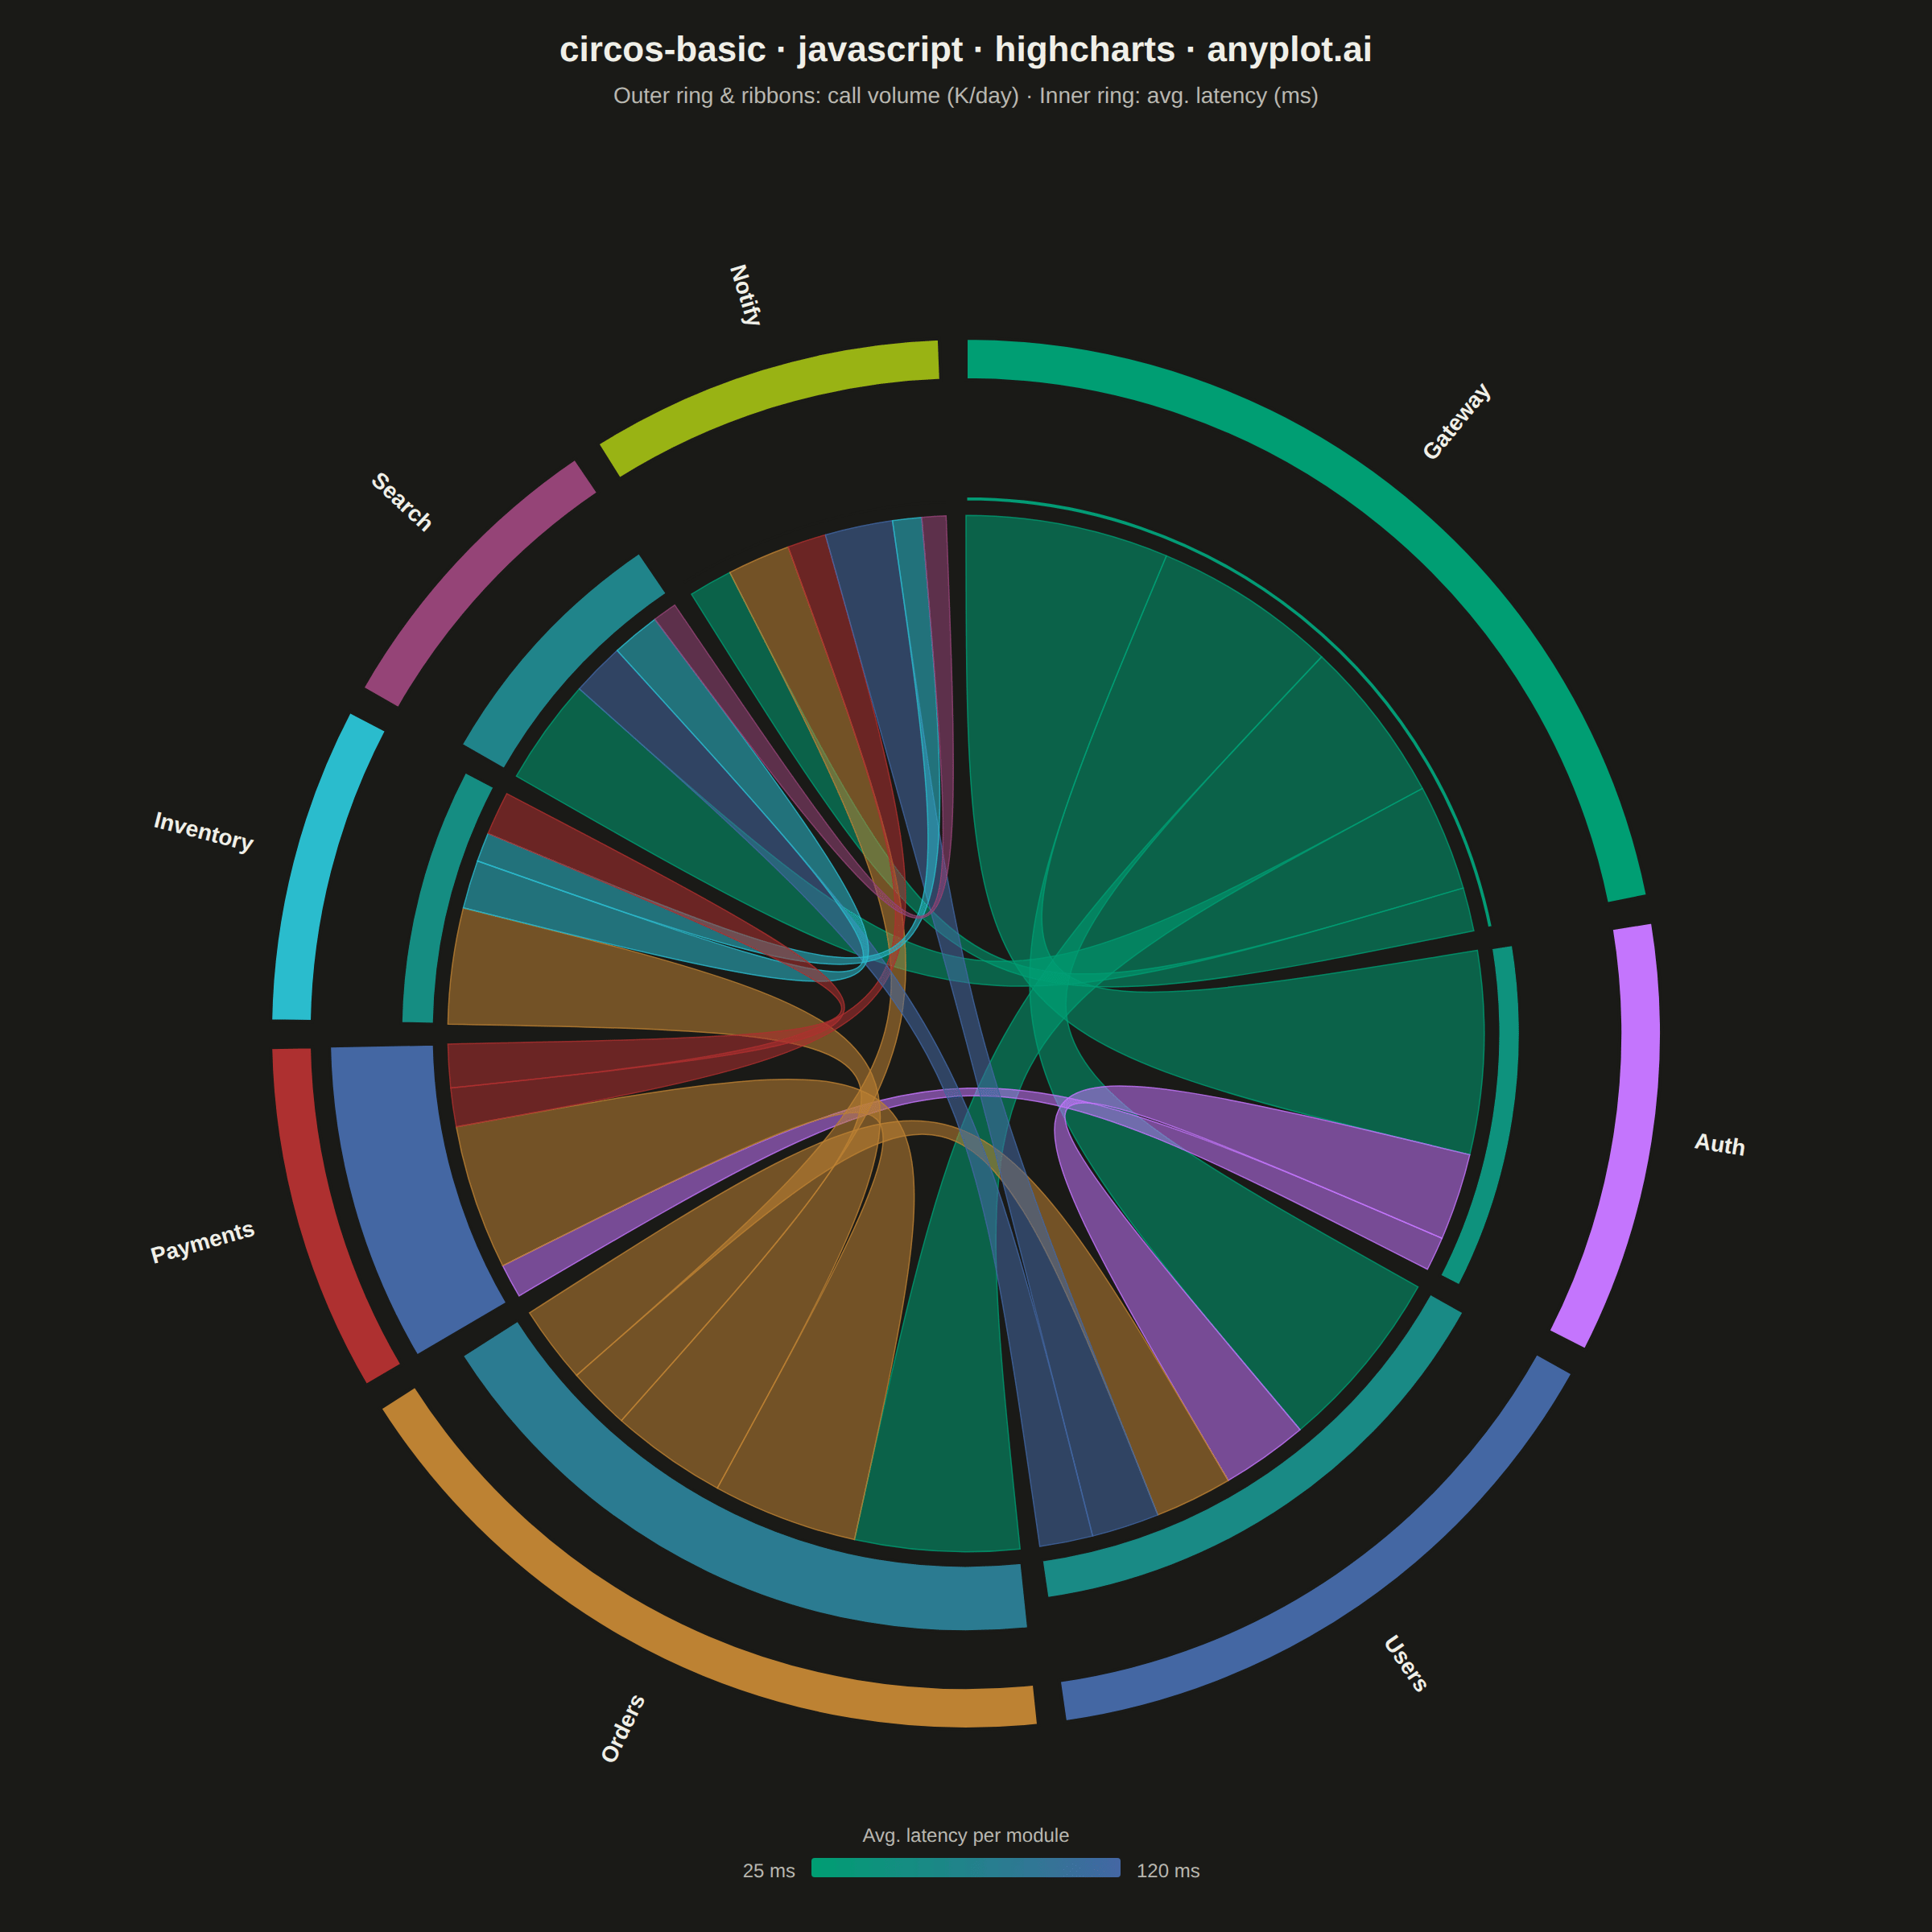
A Circos plot is a circular visualization that displays data on concentric tracks arranged around a circle, with ribbons or arcs connecting related segments across the circular layout. Originally designed for genomic data visualization, it excels at showing relationships between segments while simultaneously displaying multiple data attributes on different tracks. The circular arrangement makes efficient use of space and reveals patterns in complex relational data.
// anyplot.ai
// circos-basic: Circos Plot
// Library: highcharts 12.6.0 | JavaScript 22.23.2
// Quality: 92/100 | Created: 2026-09-04
//# anyplot-orientation: square
// anyplot.ai
// circos-basic: Circos Plot
// Library: Highcharts 12.6.0 | Node 22
// License: Highcharts — commercial license, free for non-commercial use (highcharts.com/license)
// Quality: pending | Created: 2026-09-04

const t = window.ANYPLOT_TOKENS;

// --- Data (in-memory, deterministic) ----------------------------------------
// Microservice dependency graph: outer ring + ribbons encode call volume
// between services, the inner ring encodes average response latency.
const modules = [
  "Gateway",
  "Auth",
  "Users",
  "Orders",
  "Payments",
  "Inventory",
  "Search",
  "Notify",
];

const connections = [
  ["Gateway", "Auth", 42],
  ["Gateway", "Users", 38],
  ["Gateway", "Orders", 34],
  ["Gateway", "Search", 22],
  ["Gateway", "Notify", 9],
  ["Auth", "Users", 18],
  ["Auth", "Payments", 7],
  ["Orders", "Payments", 30],
  ["Orders", "Inventory", 24],
  ["Orders", "Notify", 13],
  ["Orders", "Users", 16],
  ["Payments", "Notify", 8],
  ["Users", "Notify", 14],
  ["Users", "Search", 11],
  ["Inventory", "Search", 10],
  ["Inventory", "Notify", 6],
  ["Search", "Notify", 5],
  ["Payments", "Inventory", 9],
];

const avgLatencyMs = {
  Gateway: 30,
  Auth: 45,
  Users: 60,
  Orders: 85,
  Payments: 120,
  Inventory: 55,
  Search: 70,
  Notify: 25,
};

// --- Layout math (chord-diagram style, no add-on module required) ----------
const segmentTotal = {};
modules.forEach((m) => {
  segmentTotal[m] = 0;
});
connections.forEach(([source, target, value]) => {
  segmentTotal[source] += value;
  segmentTotal[target] += value;
});
const grandTotal = modules.reduce((sum, m) => sum + segmentTotal[m], 0);

const gapRad = (2.2 * Math.PI) / 180;
const availableRad = 2 * Math.PI - gapRad * modules.length;

const segAngles = {};
let angleCursor = 0;
modules.forEach((m) => {
  const span = (segmentTotal[m] / grandTotal) * availableRad;
  segAngles[m] = { start: angleCursor, end: angleCursor + span };
  angleCursor += span + gapRad;
});

const ribbonCursor = {};
modules.forEach((m) => {
  ribbonCursor[m] = segAngles[m].start;
});

const latencyValues = modules.map((m) => avgLatencyMs[m]);
const minLatency = Math.min(...latencyValues);
const maxLatency = Math.max(...latencyValues);

// --- Chart shell (title/subtitle only — the diagram is custom-drawn) -------
const chart = Highcharts.chart("container", {
  chart: {
    backgroundColor: "transparent",
    animation: false,
    style: { fontFamily: "inherit" },
  },
  credits: { enabled: false },
  title: {
    text: "circos-basic · javascript · highcharts · anyplot.ai",
    style: { color: t.ink, fontSize: "22px", fontWeight: "600" },
    y: 28,
  },
  subtitle: {
    text: "Outer ring & ribbons: call volume (K/day) · Inner ring: avg. latency (ms)",
    style: { color: t.inkSoft, fontSize: "14px" },
    y: 54,
  },
  xAxis: { visible: false },
  yAxis: { visible: false },
  legend: { enabled: false },
  tooltip: { enabled: false },
  plotOptions: { series: { animation: false, enableMouseTracking: false } },
  series: [],
});

const W = chart.chartWidth;
const H = chart.chartHeight;
const cx = W / 2;
const cy = H / 2 + H * 0.035;
const outerR = Math.min(W, H) / 2 - H * 0.14;
const ringThickness = outerR * 0.06;
const ringInnerR = outerR - ringThickness;
const trackOuterR = ringInnerR - outerR * 0.025;
const trackBaseR = trackOuterR - outerR * 0.15;
const ribbonR = trackBaseR - outerR * 0.02;

// --- Geometry helpers --------------------------------------------------------
function polar(r, angle) {
  return { x: cx + r * Math.sin(angle), y: cy - r * Math.cos(angle) };
}

function wedgePath(rOuter, rInner, a1, a2) {
  const large = a2 - a1 > Math.PI ? 1 : 0;
  const p1 = polar(rOuter, a1);
  const p2 = polar(rOuter, a2);
  const p3 = polar(rInner, a2);
  const p4 = polar(rInner, a1);
  return (
    `M ${p1.x} ${p1.y} A ${rOuter} ${rOuter} 0 ${large} 1 ${p2.x} ${p2.y} ` +
    `L ${p3.x} ${p3.y} A ${rInner} ${rInner} 0 ${large} 0 ${p4.x} ${p4.y} Z`
  );
}

function ribbonPath(r, s1, s2, t1, t2) {
  const largeS = s2 - s1 > Math.PI ? 1 : 0;
  const largeT = t2 - t1 > Math.PI ? 1 : 0;
  const pS1 = polar(r, s1);
  const pS2 = polar(r, s2);
  const pT1 = polar(r, t1);
  const pT2 = polar(r, t2);
  return (
    `M ${pS1.x} ${pS1.y} A ${r} ${r} 0 ${largeS} 1 ${pS2.x} ${pS2.y} ` +
    `C ${cx} ${cy} ${cx} ${cy} ${pT1.x} ${pT1.y} ` +
    `A ${r} ${r} 0 ${largeT} 1 ${pT2.x} ${pT2.y} ` +
    `C ${cx} ${cy} ${cx} ${cy} ${pS1.x} ${pS1.y} Z`
  );
}

function lerpColor(hexA, hexB, ratio) {
  const a = parseInt(hexA.slice(1), 16);
  const b = parseInt(hexB.slice(1), 16);
  const ar = (a >> 16) & 255,
    ag = (a >> 8) & 255,
    ab = a & 255;
  const br = (b >> 16) & 255,
    bg = (b >> 8) & 255,
    bb = b & 255;
  const r = Math.round(ar + (br - ar) * ratio);
  const g = Math.round(ag + (bg - ag) * ratio);
  const bl = Math.round(ab + (bb - ab) * ratio);
  return `rgb(${r}, ${g}, ${bl})`;
}

// --- Ribbons (drawn first, innermost layer) ---------------------------------
connections.forEach(([source, target, value]) => {
  const spanS =
    (value / segmentTotal[source]) *
    (segAngles[source].end - segAngles[source].start);
  const aS1 = ribbonCursor[source];
  const aS2 = aS1 + spanS;
  ribbonCursor[source] = aS2;

  const spanT =
    (value / segmentTotal[target]) *
    (segAngles[target].end - segAngles[target].start);
  const aT1 = ribbonCursor[target];
  const aT2 = aT1 + spanT;
  ribbonCursor[target] = aT2;

  const color = t.palette[modules.indexOf(source)];
  chart.renderer
    .path()
    .attr({
      d: ribbonPath(ribbonR, aS1, aS2, aT1, aT2),
      fill: Highcharts.color(color).setOpacity(0.55).get(),
      stroke: Highcharts.color(color).setOpacity(0.8).get(),
      "stroke-width": 0.75,
    })
    .add();
});

// --- Inner track: average latency per module --------------------------------
modules.forEach((m) => {
  const { start, end } = segAngles[m];
  const ratio = (avgLatencyMs[m] - minLatency) / (maxLatency - minLatency);
  const barR = trackBaseR + ratio * (trackOuterR - trackBaseR);
  chart.renderer
    .path()
    .attr({
      d: wedgePath(barR, trackBaseR, start, end),
      fill: lerpColor(t.seq[0], t.seq[1], ratio),
      stroke: t.pageBg,
      "stroke-width": 1.5,
    })
    .add();
});

// --- Outer ring: one wedge per module ----------------------------------------
modules.forEach((m, i) => {
  const { start, end } = segAngles[m];
  chart.renderer
    .path()
    .attr({
      d: wedgePath(outerR, ringInnerR, start, end),
      fill: t.palette[i],
      stroke: t.pageBg,
      "stroke-width": 2,
    })
    .add();
});

// --- Module labels ------------------------------------------------------------
modules.forEach((m) => {
  const { start, end } = segAngles[m];
  const mid = (start + end) / 2;
  const pos = polar(outerR + 26, mid);
  let rotation = (mid * 180) / Math.PI - 90;
  let align = "left";
  if (mid > Math.PI) {
    rotation += 180;
    align = "right";
  }
  chart.renderer
    .text(m, pos.x, pos.y)
    .attr({ rotation, align })
    .css({ color: t.ink, fontSize: "14px", fontWeight: "600" })
    .add();
});

// --- Latency color-scale legend -----------------------------------------------
const legendW = W * 0.16;
const legendH = 12;
const legendX = cx - legendW / 2;
const legendY = H - 46;

chart.renderer
  .text("Avg. latency per module", cx, legendY - 10)
  .attr({ align: "center" })
  .css({ color: t.inkSoft, fontSize: "12px" })
  .add();

chart.renderer
  .rect(legendX, legendY, legendW, legendH, 2)
  .attr({
    fill: {
      linearGradient: { x1: 0, y1: 0, x2: 1, y2: 0 },
      stops: [
        [0, t.seq[0]],
        [1, t.seq[1]],
      ],
    },
  })
  .add();

chart.renderer
  .text(`${minLatency} ms`, legendX - 10, legendY + legendH)
  .attr({ align: "right" })
  .css({ color: t.inkSoft, fontSize: "12px" })
  .add();

chart.renderer
  .text(`${maxLatency} ms`, legendX + legendW + 10, legendY + legendH)
  .attr({ align: "left" })
  .css({ color: t.inkSoft, fontSize: "12px" })
  .add();
Runnable source as JSON, for any HTTP client: https://api.anyplot.ai/specs/circos-basic/highcharts/code. Any spec id and library id listed in llms-full.txt fit the same URL shape; every URL below is complete and callable.
{
  "spec_id": "circos-basic",
  "language": "javascript",
  "library": "highcharts",
  "page": "https://anyplot.ai/circos-basic/javascript/highcharts",
  "hub": "https://anyplot.ai/circos-basic",
  "code_json": "https://api.anyplot.ai/specs/circos-basic/highcharts/code",
  "spec_json": "https://api.anyplot.ai/specs/circos-basic",
  "render_light_png": "https://storage.googleapis.com/anyplot-images/plots/circos-basic/javascript/highcharts/plot-light.png",
  "render_dark_png": "https://storage.googleapis.com/anyplot-images/plots/circos-basic/javascript/highcharts/plot-dark.png",
  "interactive_light_html": "https://storage.googleapis.com/anyplot-images/plots/circos-basic/javascript/highcharts/plot-light.html",
  "interactive_dark_html": "https://storage.googleapis.com/anyplot-images/plots/circos-basic/javascript/highcharts/plot-dark.html",
  "quality_score": 92.0,
  "license": "MIT",
  "guide": "https://anyplot.ai/llms.txt"
}
Part of Circos Plot on anyplot.ai.