The same plot in 14 other libraries — JavaScript: D3.js, Apache ECharts, Highcharts, MUI X Charts; Python: Altair, Bokeh, lets-plot, Matplotlib, Plotly, plotnine, Pygal, Seaborn; R: ggplot2; Julia: Makie.jl. Compare all 15 side by side: Confusion Matrix Heatmap in Python, R, Julia and JavaScript.
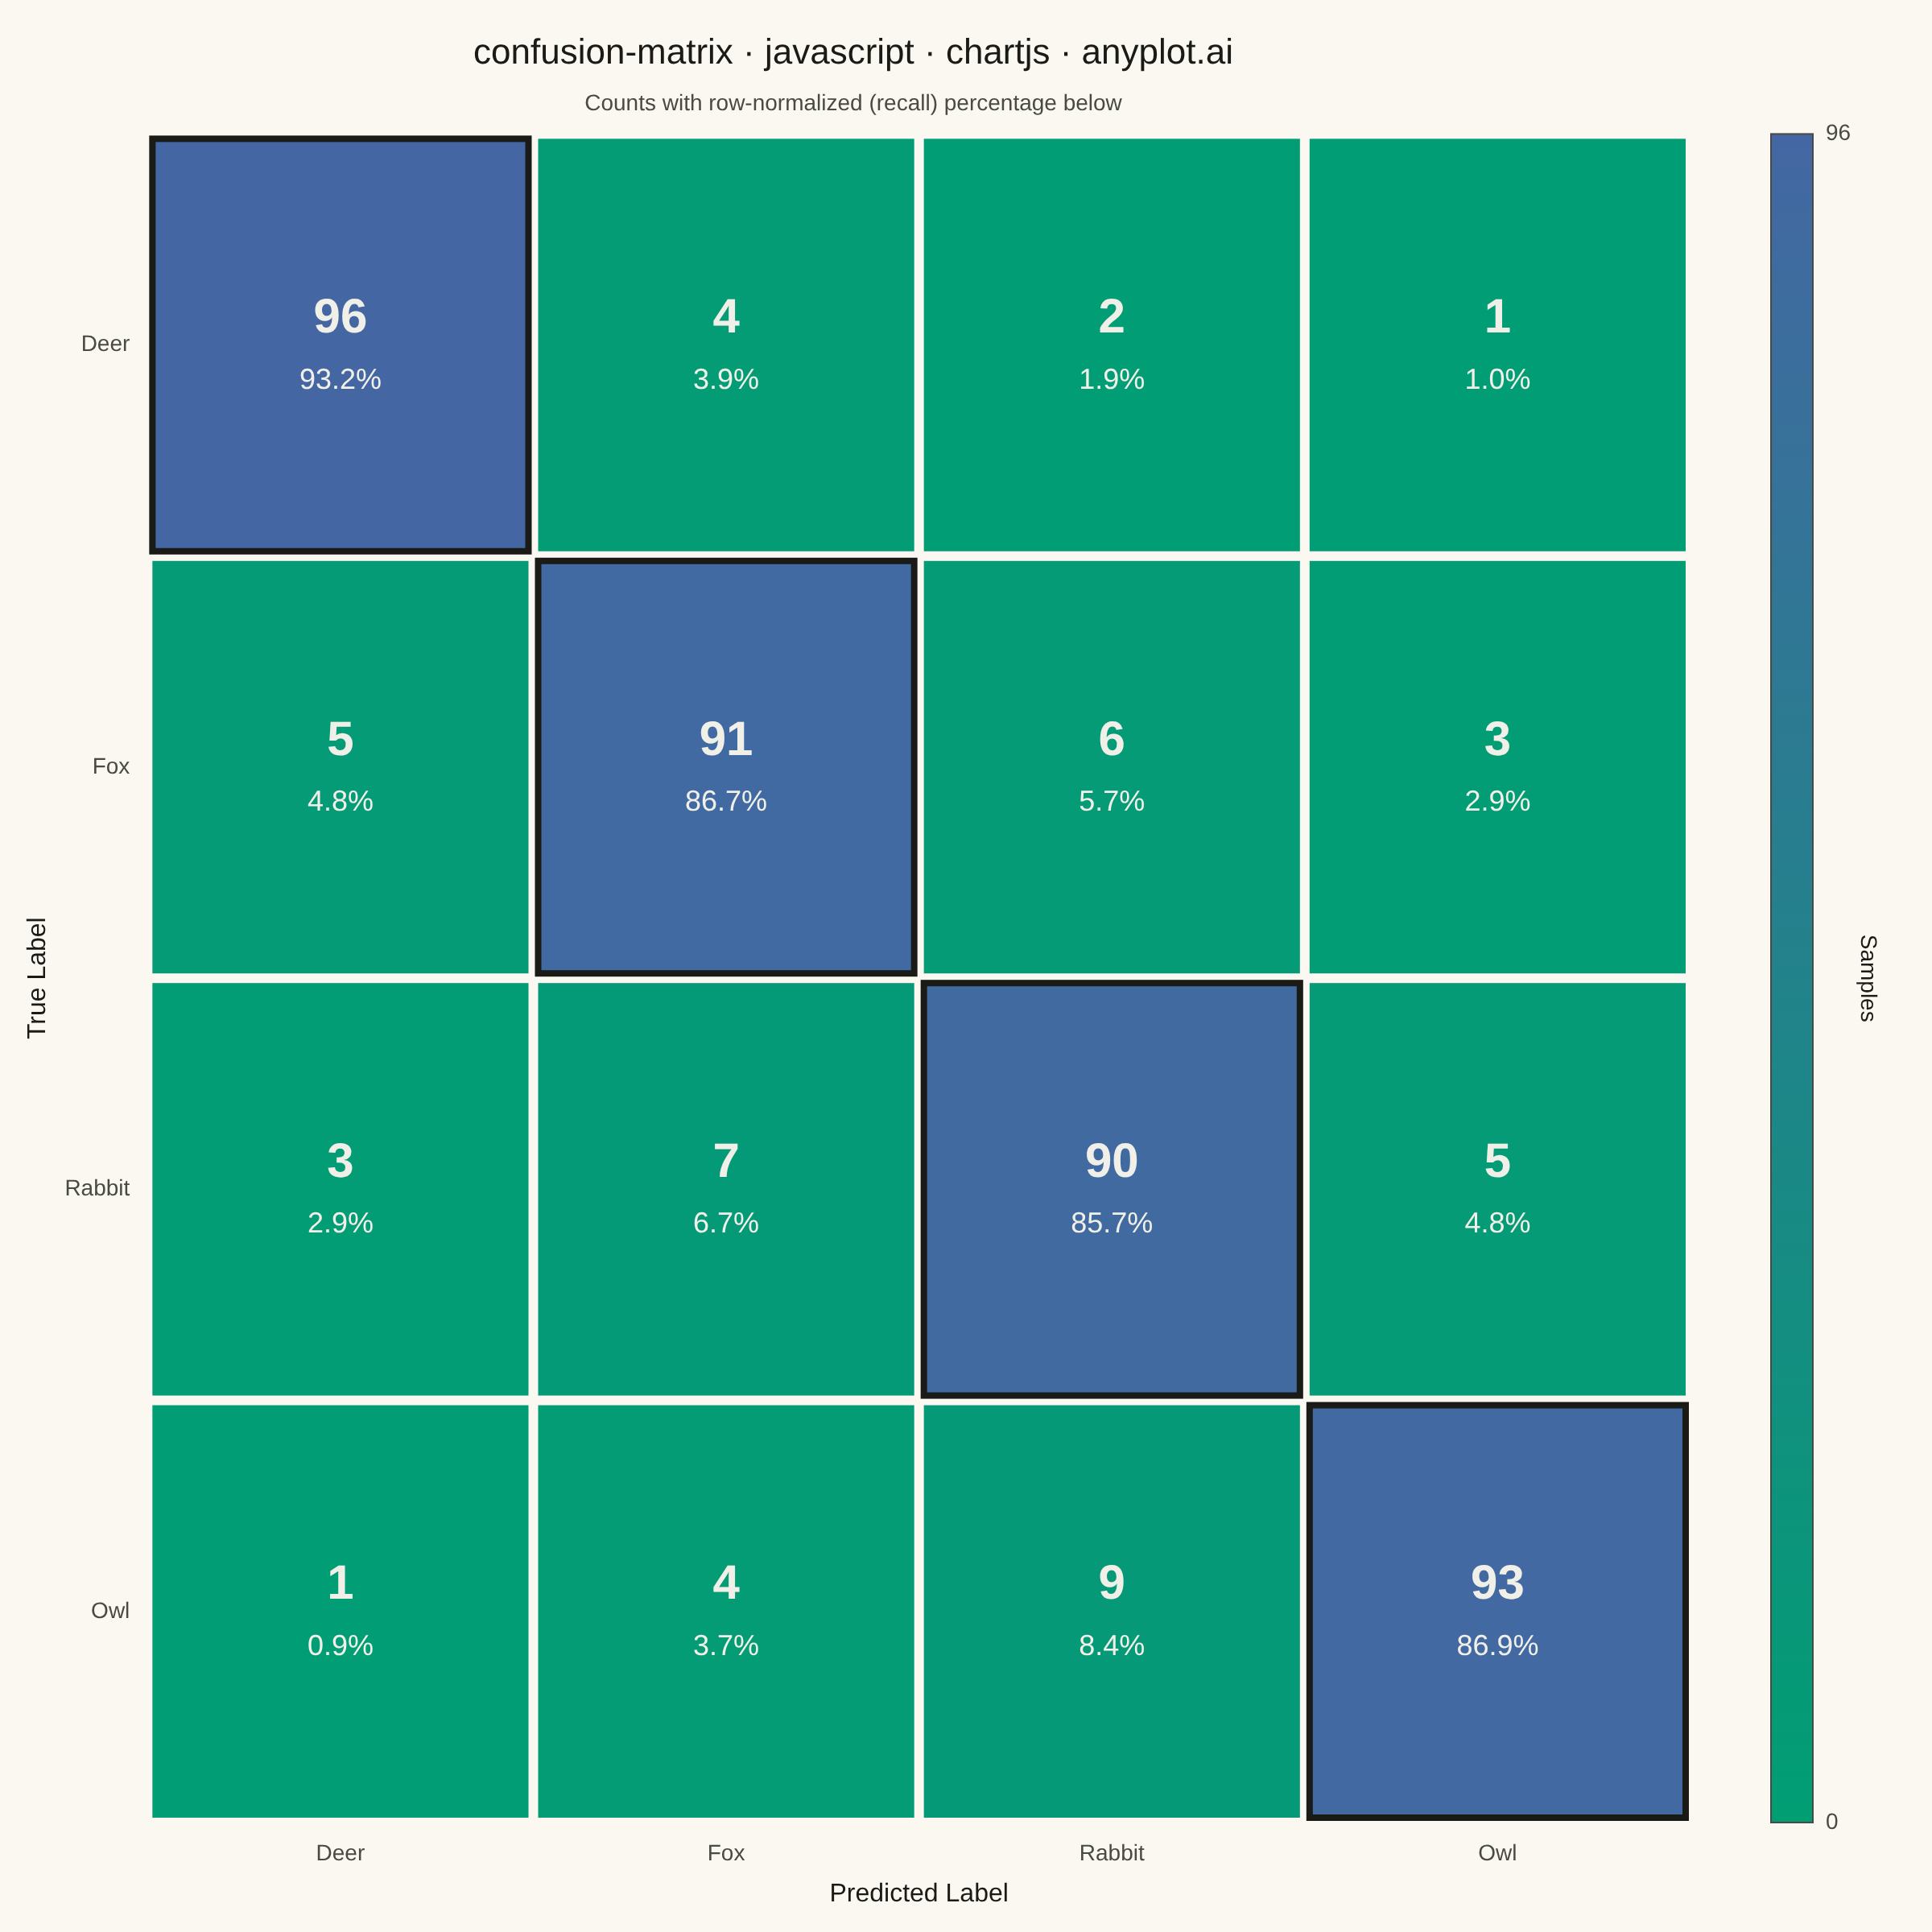
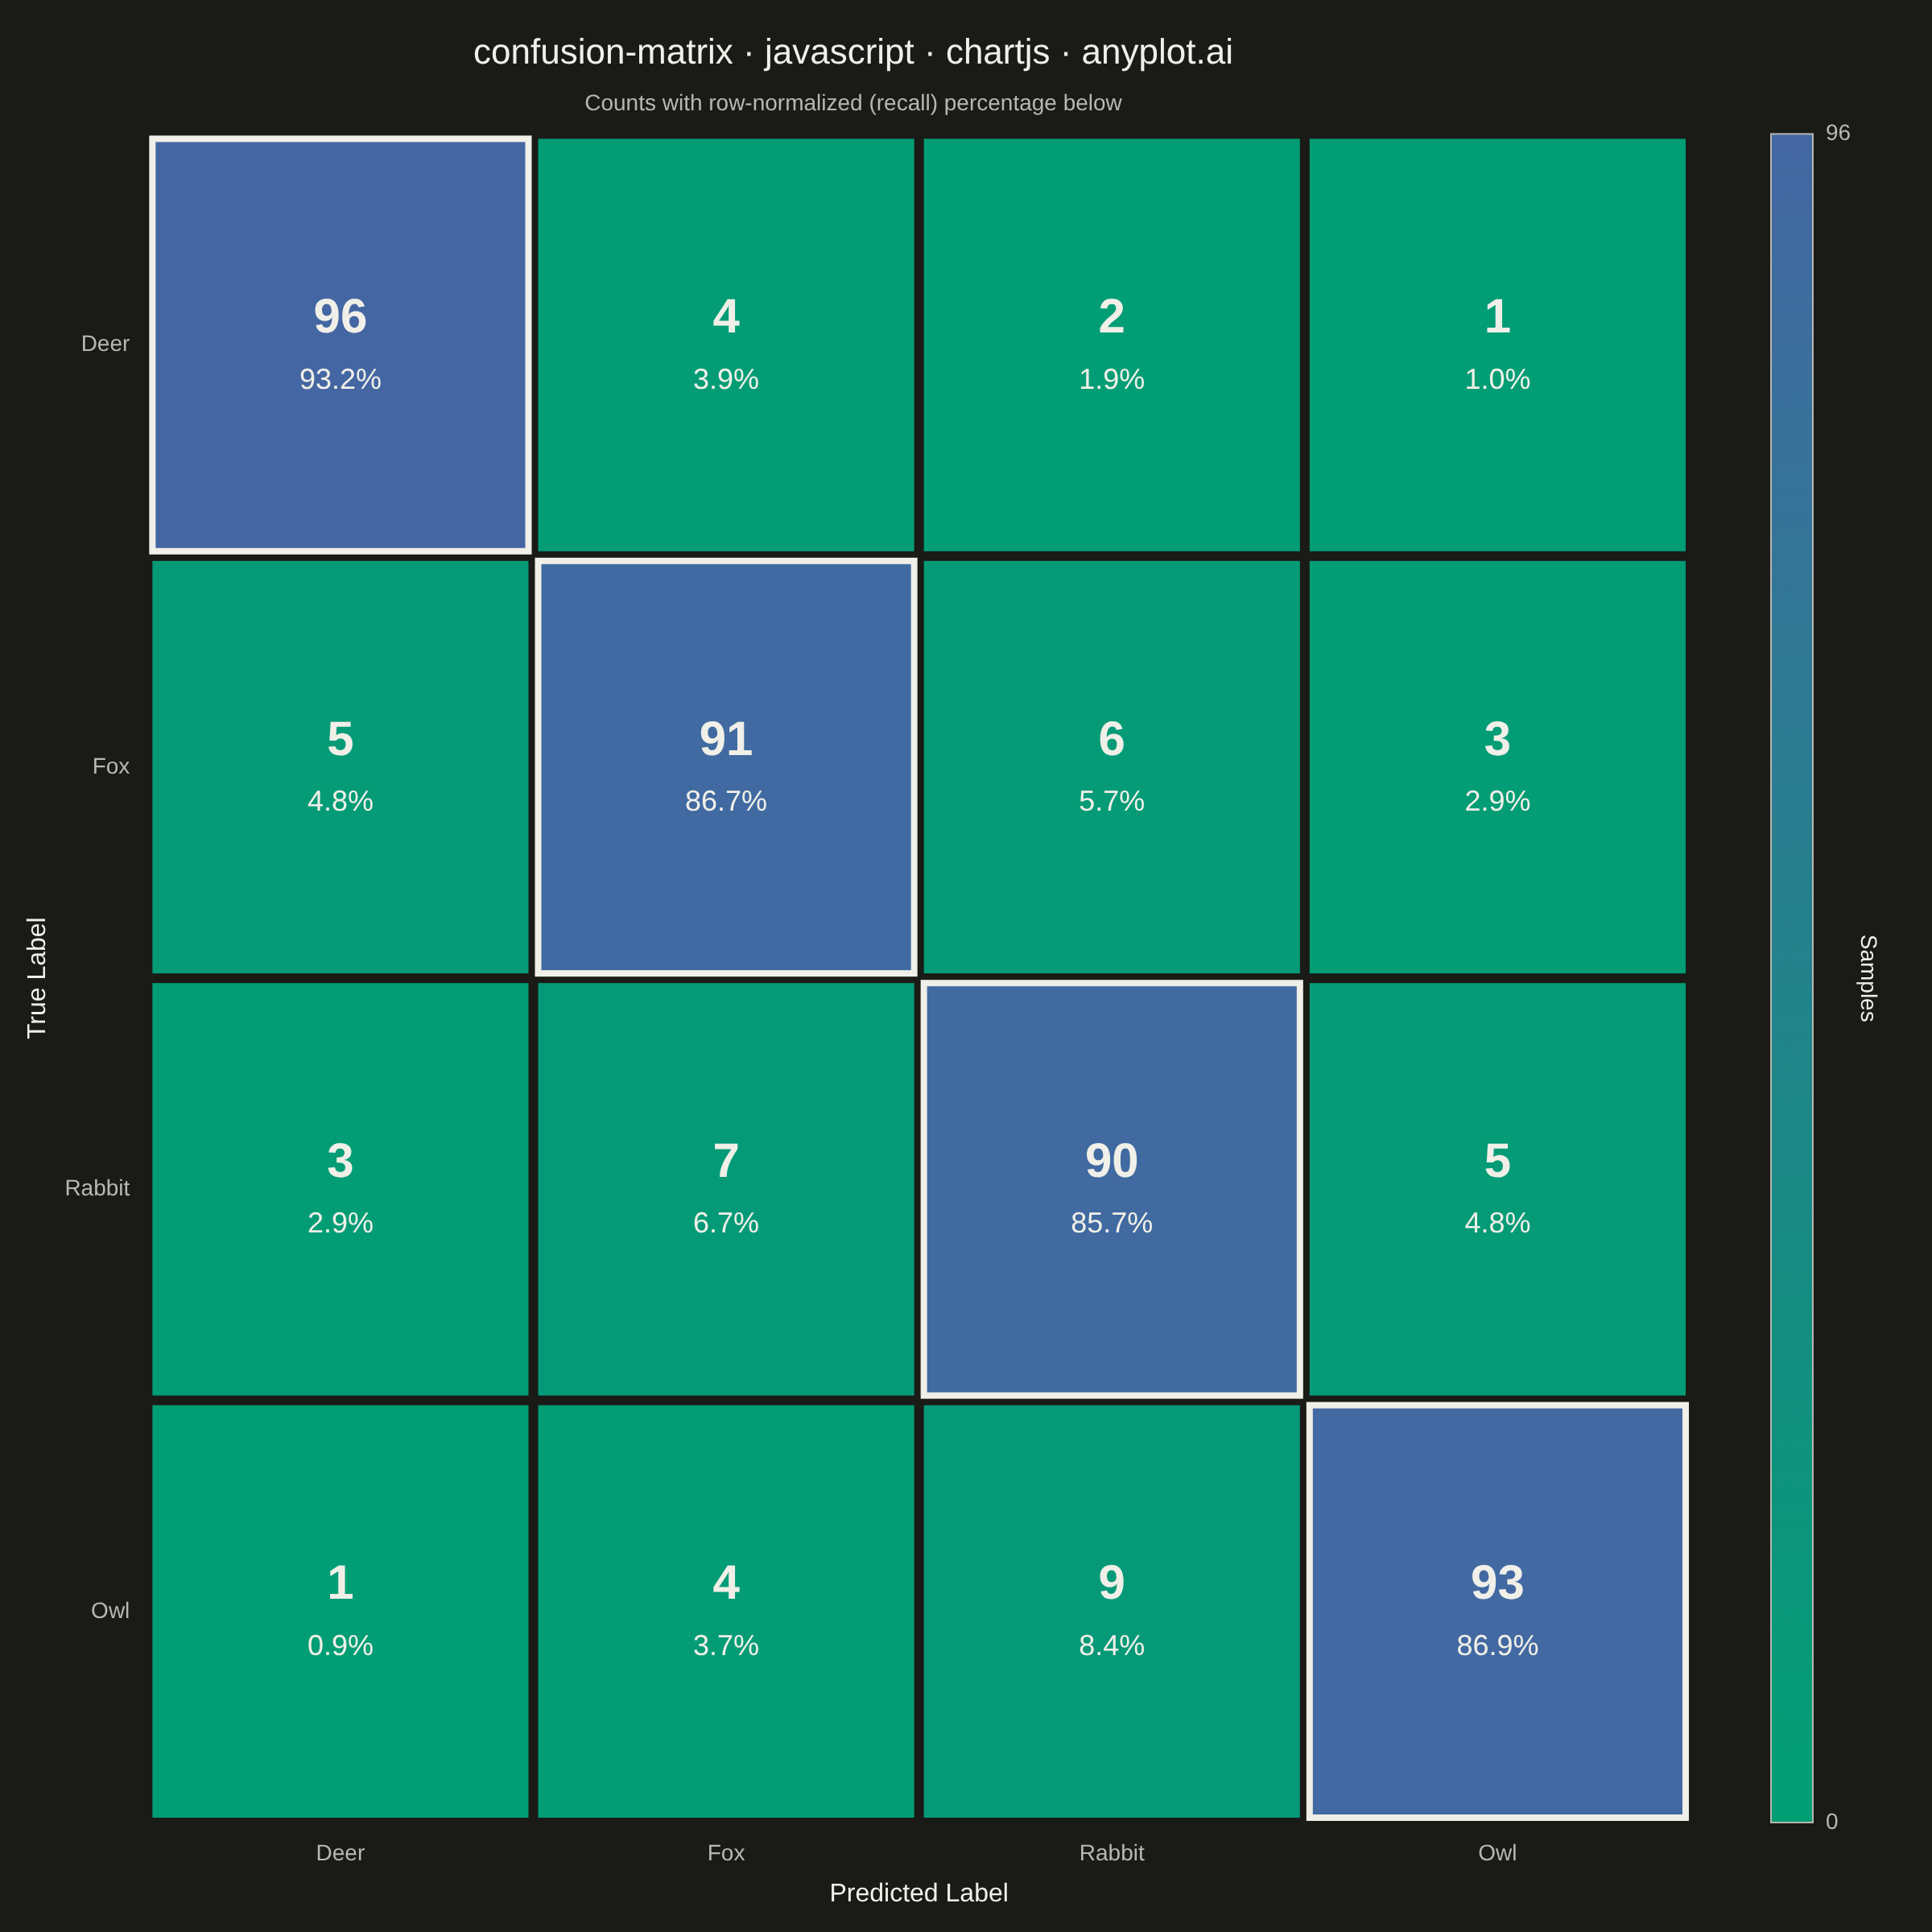
A specialized heatmap visualization for evaluating classification model performance, displaying the counts or proportions of predicted vs actual class labels. The confusion matrix reveals true positives, false positives, true negatives, and false negatives at a glance, making it essential for understanding model behavior, identifying class imbalances, and diagnosing specific misclassification patterns.
// anyplot.ai
// confusion-matrix: Confusion Matrix Heatmap
// Library: chartjs 4.4.7 | JavaScript 22.23.2
// Quality: 91/100 | Created: 2026-09-04

//# anyplot-orientation: square

const t = window.ANYPLOT_TOKENS;

// --- Data (in-memory, deterministic) ----------------------------------------
// Wildlife camera-trap classifier: true vs. predicted species over 400 test images.
const classNames = ["Deer", "Fox", "Rabbit", "Owl"];
const matrix = [
  [96, 4, 2, 1], // true: Deer
  [5, 91, 6, 3], // true: Fox
  [3, 7, 90, 5], // true: Rabbit
  [1, 4, 9, 93], // true: Owl
];
const maxCount = Math.max(...matrix.flat());

// Row-normalized percentages (recall per true class) shown as a secondary
// annotation per cell, covering the spec's normalization-options note.
const cells = [];
matrix.forEach((rowCounts, row) => {
  const rowTotal = rowCounts.reduce((sum, c) => sum + c, 0);
  rowCounts.forEach((count, col) => {
    const pct = (count / rowTotal) * 100;
    cells.push({ x: classNames[col], y: classNames[row], row, col, count, pct });
  });
});

// --- Color scale: imprint_seq (brand green -> blue), low -> high count -----
function hexToRgb(hex) {
  const num = parseInt(hex.slice(1), 16);
  return { r: (num >> 16) & 255, g: (num >> 8) & 255, b: num & 255 };
}
const seqLow = hexToRgb(t.seq[0]);
const seqHigh = hexToRgb(t.seq[1]);
function cellFill(count) {
  const ratio = count / maxCount;
  const r = Math.round(seqLow.r + (seqHigh.r - seqLow.r) * ratio);
  const g = Math.round(seqLow.g + (seqHigh.g - seqLow.g) * ratio);
  const b = Math.round(seqLow.b + (seqHigh.b - seqLow.b) * ratio);
  const luminance = (0.299 * r + 0.587 * g + 0.114 * b) / 255;
  return { rgb: `rgb(${r}, ${g}, ${b})`, luminance };
}

// --- Mount -------------------------------------------------------------------
const canvas = document.createElement("canvas");
document.getElementById("container").appendChild(canvas);

// --- Custom plugin: draws the heatmap cells + a color-scale legend ----------
// Chart.js core has no matrix/heatmap chart type (that lives in the unpinned
// chartjs-chart-matrix plugin, out of scope here). A category-scale scatter
// with invisible points supplies the axes, tick labels, and tooltips; this
// inline plugin — plain Chart.js plugin-hook API, no external package — owns
// the cell fills, the diagonal highlight, and the count labels.
const heatmapPlugin = {
  id: "confusionCells",
  beforeDatasetsDraw(chart) {
    const { ctx, scales } = chart;
    const cellW = scales.x.getPixelForTick(1) - scales.x.getPixelForTick(0);
    const cellH = scales.y.getPixelForTick(1) - scales.y.getPixelForTick(0);
    const gap = 3;

    cells.forEach(({ row, col, count, pct }) => {
      const cx = scales.x.getPixelForTick(col);
      const cy = scales.y.getPixelForTick(row);
      const { rgb, luminance } = cellFill(count);

      ctx.fillStyle = rgb;
      ctx.fillRect(cx - cellW / 2 + gap, cy - cellH / 2 + gap, cellW - gap * 2, cellH - gap * 2);

      if (row === col) {
        ctx.strokeStyle = t.ink;
        ctx.lineWidth = 4;
        ctx.strokeRect(cx - cellW / 2 + gap, cy - cellH / 2 + gap, cellW - gap * 2, cellH - gap * 2);
      }

      const textColor = luminance > 0.55 ? "#1A1A17" : "#F0EFE8";
      ctx.fillStyle = textColor;
      ctx.textAlign = "center";
      ctx.textBaseline = "middle";
      ctx.font = "600 30px sans-serif";
      ctx.fillText(String(count), cx, cy - 16);
      ctx.font = "500 18px sans-serif";
      ctx.fillText(`${pct.toFixed(1)}%`, cx, cy + 22);
    });
  },
  afterDraw(chart) {
    const { ctx, chartArea } = chart;
    const barX = chartArea.right + 50;
    const barWidth = 26;
    const { top, bottom } = chartArea;

    const gradient = ctx.createLinearGradient(0, bottom, 0, top);
    gradient.addColorStop(0, t.seq[0]);
    gradient.addColorStop(1, t.seq[1]);
    ctx.fillStyle = gradient;
    ctx.fillRect(barX, top, barWidth, bottom - top);
    ctx.strokeStyle = t.inkSoft;
    ctx.lineWidth = 1;
    ctx.strokeRect(barX, top, barWidth, bottom - top);

    ctx.fillStyle = t.inkSoft;
    ctx.font = "14px sans-serif";
    ctx.textBaseline = "middle";
    ctx.textAlign = "left";
    ctx.fillText("0", barX + barWidth + 8, bottom);
    ctx.fillText(String(maxCount), barX + barWidth + 8, top);

    ctx.save();
    ctx.translate(barX + barWidth + 34, (top + bottom) / 2);
    ctx.rotate(Math.PI / 2);
    ctx.textAlign = "center";
    ctx.fillStyle = t.ink;
    ctx.fillText("Samples", 0, 0);
    ctx.restore();
  },
};

// --- Chart -------------------------------------------------------------------
new Chart(canvas, {
  type: "scatter",
  data: {
    datasets: [
      {
        label: "Samples",
        data: cells,
        pointRadius: 0,
        pointHitRadius: 140,
      },
    ],
  },
  plugins: [heatmapPlugin],
  options: {
    responsive: true,
    maintainAspectRatio: false,
    animation: false,
    layout: { padding: { top: 10, right: 150, bottom: 10, left: 10 } },
    plugins: {
      title: {
        display: true,
        text: "confusion-matrix · javascript · chartjs · anyplot.ai",
        color: t.ink,
        font: { size: 22, weight: "500" },
      },
      subtitle: {
        display: true,
        text: "Counts with row-normalized (recall) percentage below",
        color: t.inkSoft,
        font: { size: 14 },
        padding: { bottom: 10 },
      },
      legend: { display: false },
      tooltip: {
        callbacks: {
          label: (context) => {
            const { x, y, count } = context.raw;
            return `True: ${y}  Predicted: ${x}  Count: ${count}`;
          },
        },
      },
    },
    scales: {
      x: {
        type: "category",
        labels: classNames,
        offset: true,
        title: { display: true, text: "Predicted Label", color: t.ink, font: { size: 16, weight: "500" } },
        ticks: { color: t.inkSoft, font: { size: 14 } },
        grid: { display: false },
        border: { display: false },
      },
      y: {
        type: "category",
        labels: classNames,
        offset: true,
        title: { display: true, text: "True Label", color: t.ink, font: { size: 16, weight: "500" } },
        ticks: { color: t.inkSoft, font: { size: 14 } },
        grid: { display: false },
        border: { display: false },
      },
    },
  },
});
Runnable source as JSON, for any HTTP client: https://api.anyplot.ai/specs/confusion-matrix/chartjs/code. Any spec id and library id listed in llms-full.txt fit the same URL shape; every URL below is complete and callable.
{
  "spec_id": "confusion-matrix",
  "language": "javascript",
  "library": "chartjs",
  "page": "https://anyplot.ai/confusion-matrix/javascript/chartjs",
  "hub": "https://anyplot.ai/confusion-matrix",
  "code_json": "https://api.anyplot.ai/specs/confusion-matrix/chartjs/code",
  "spec_json": "https://api.anyplot.ai/specs/confusion-matrix",
  "render_light_png": "https://storage.googleapis.com/anyplot-images/plots/confusion-matrix/javascript/chartjs/plot-light.png",
  "render_dark_png": "https://storage.googleapis.com/anyplot-images/plots/confusion-matrix/javascript/chartjs/plot-dark.png",
  "interactive_light_html": "https://storage.googleapis.com/anyplot-images/plots/confusion-matrix/javascript/chartjs/plot-light.html",
  "interactive_dark_html": "https://storage.googleapis.com/anyplot-images/plots/confusion-matrix/javascript/chartjs/plot-dark.html",
  "quality_score": 91.0,
  "license": "MIT",
  "guide": "https://anyplot.ai/llms.txt"
}
Part of Confusion Matrix Heatmap on anyplot.ai.