The same plot in 14 other libraries — Python: Altair, Bokeh, lets-plot, Matplotlib, Plotly, plotnine, Pygal, Seaborn; R: ggplot2; JavaScript: Chart.js, D3.js, Apache ECharts, Highcharts, MUI X Charts. Compare all 15 side by side: Confusion Matrix Heatmap in Python, R, Julia and JavaScript.
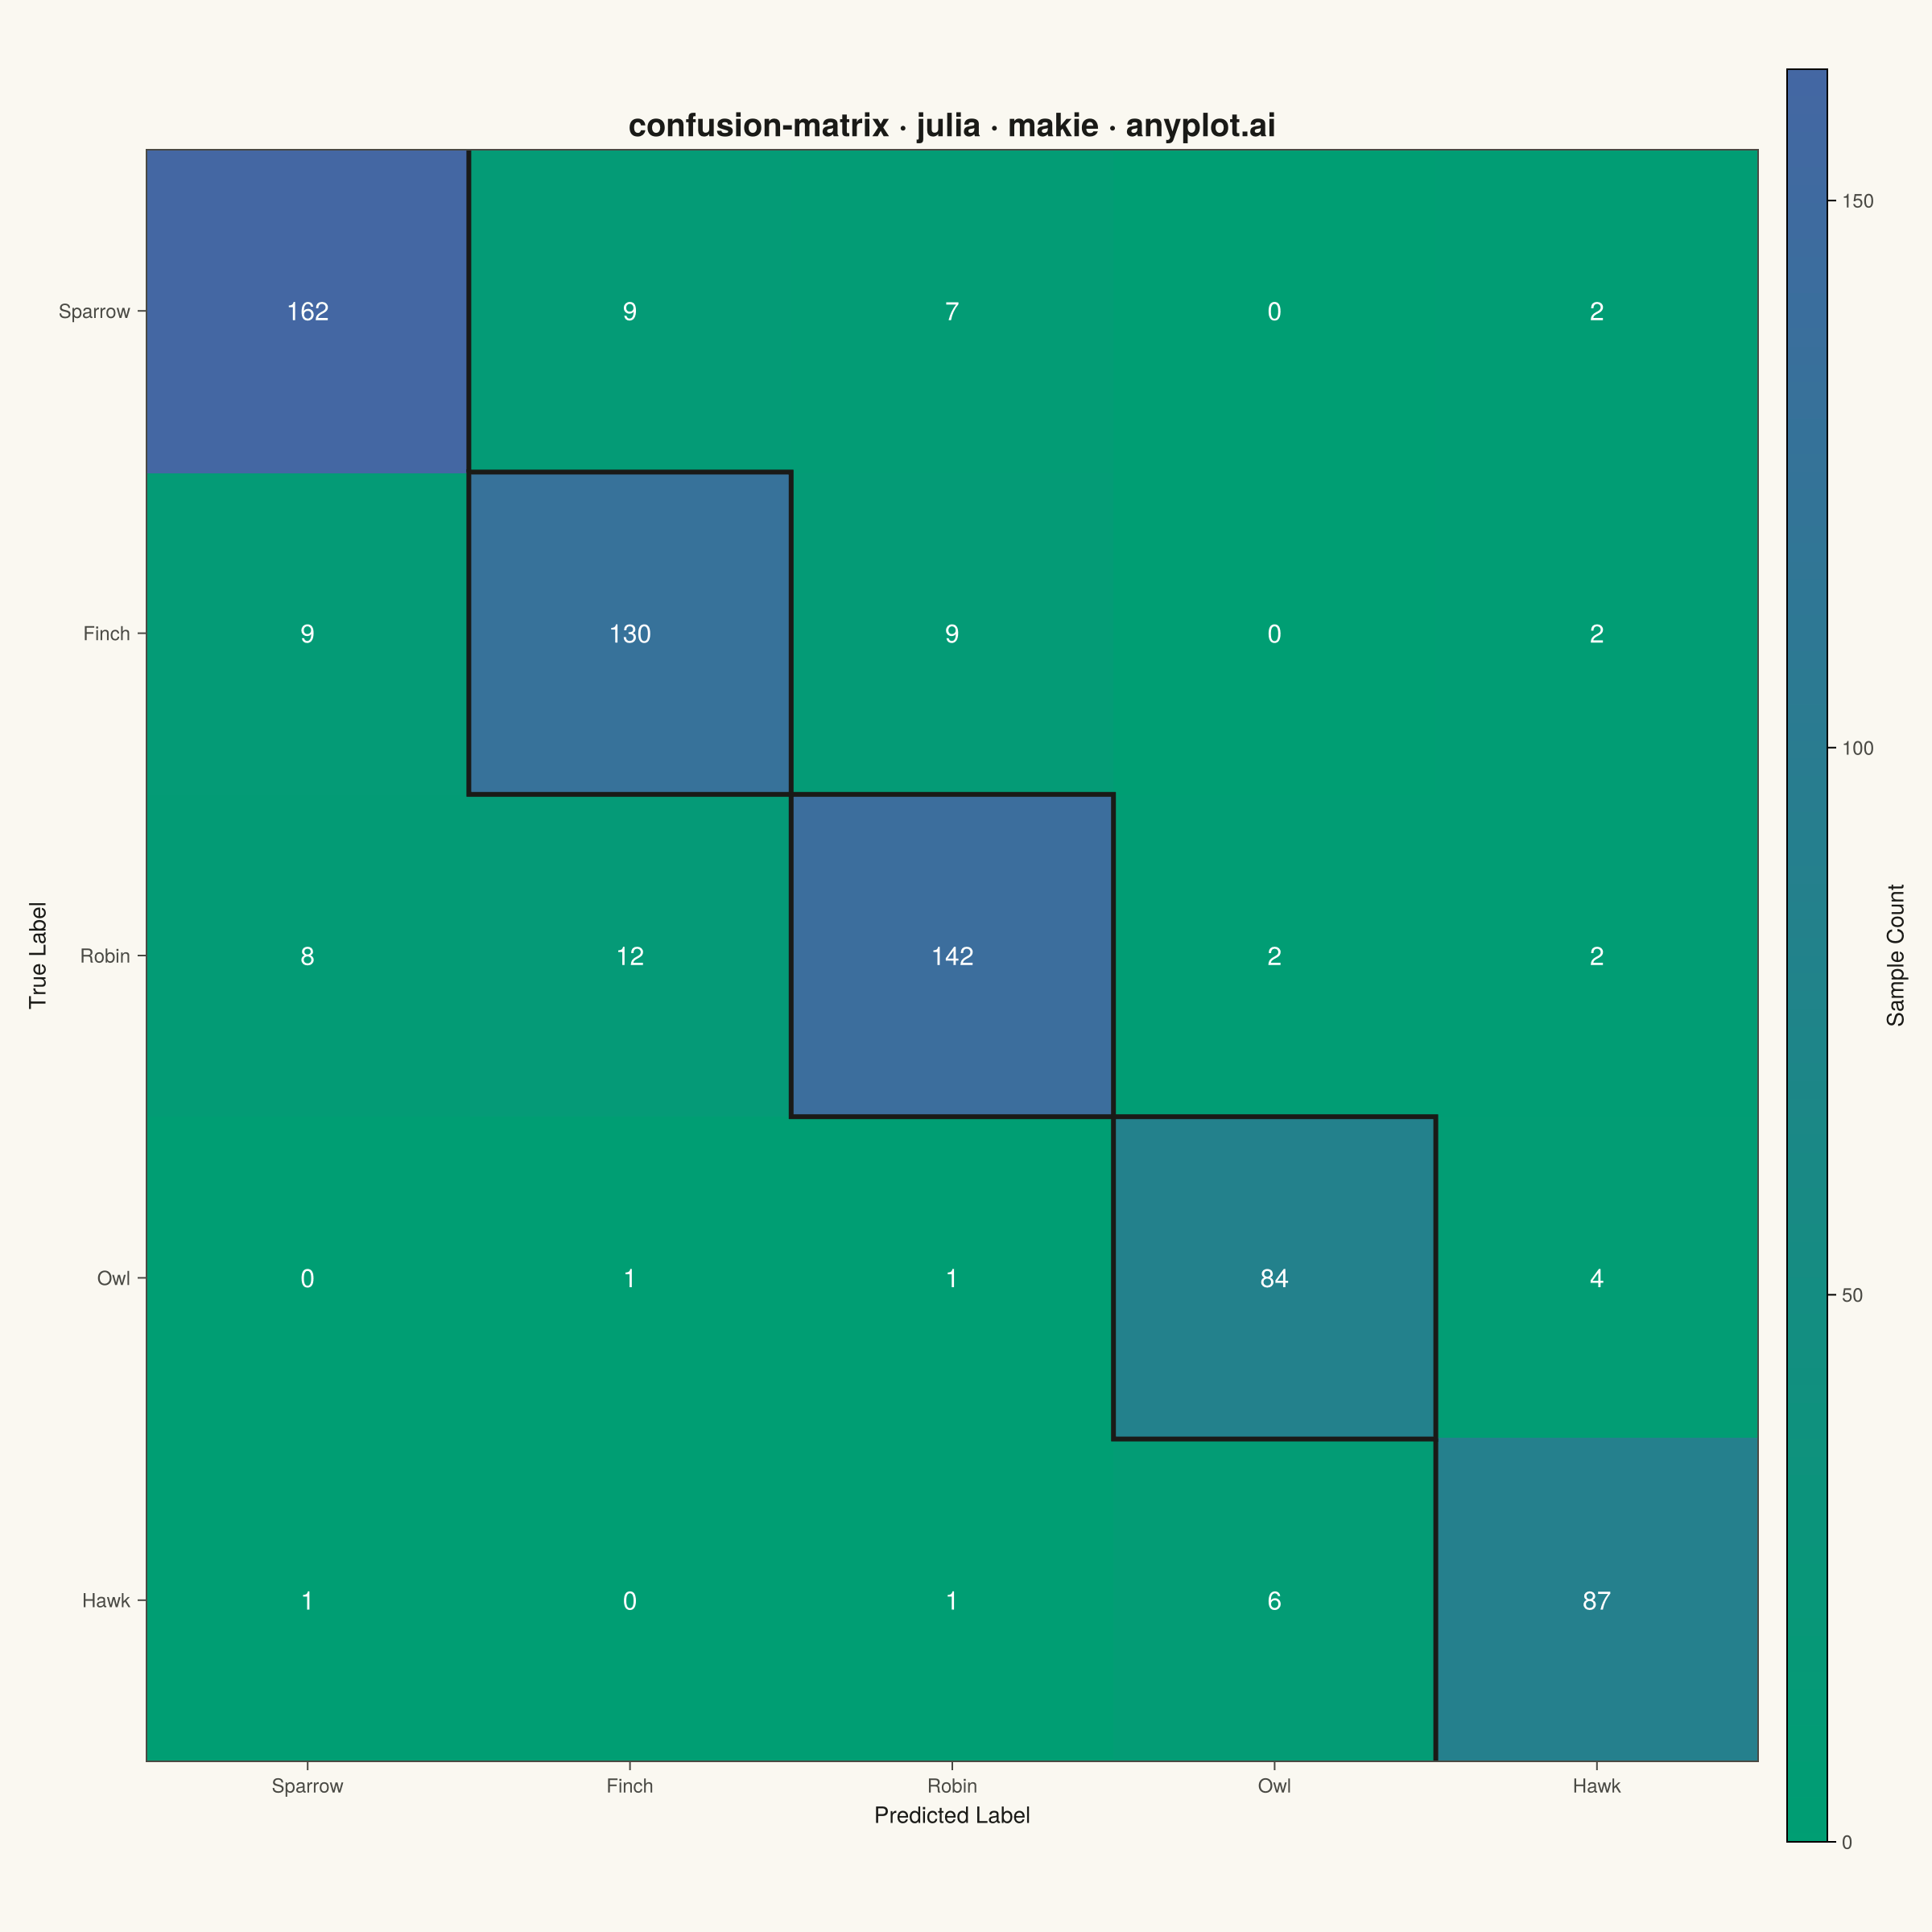
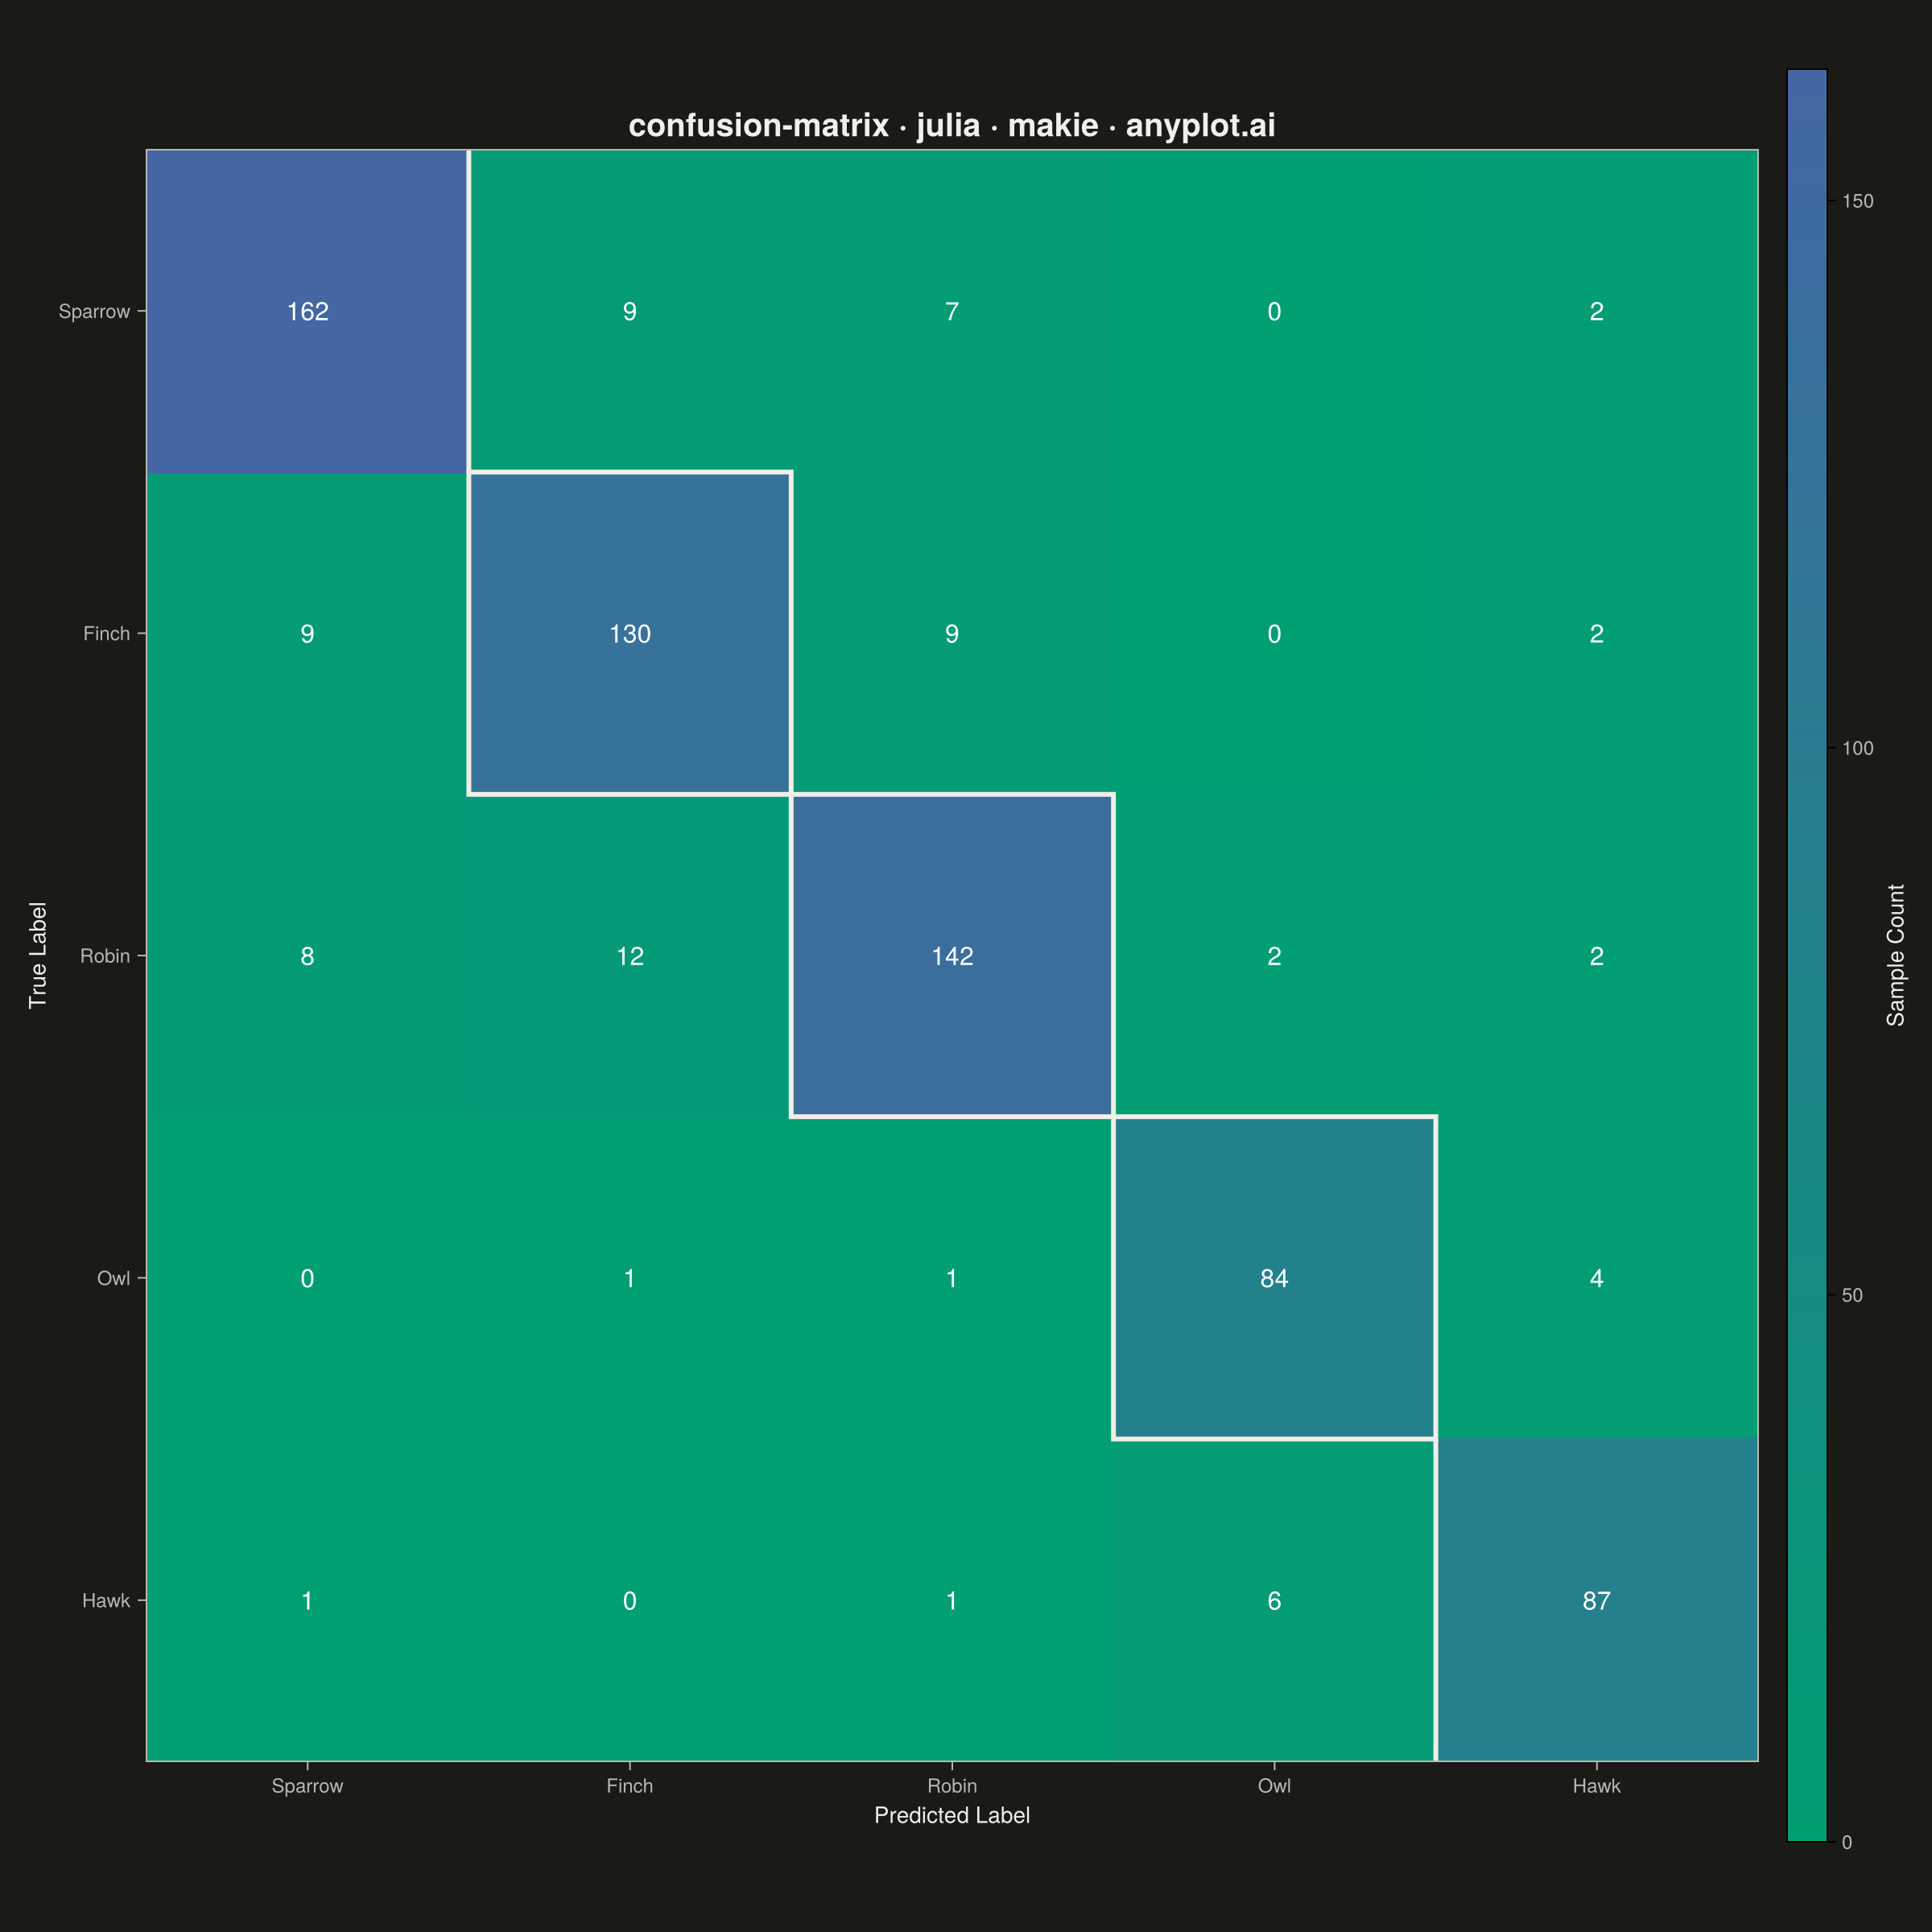
A specialized heatmap visualization for evaluating classification model performance, displaying the counts or proportions of predicted vs actual class labels. The confusion matrix reveals true positives, false positives, true negatives, and false negatives at a glance, making it essential for understanding model behavior, identifying class imbalances, and diagnosing specific misclassification patterns.
# anyplot.ai
# confusion-matrix: Confusion Matrix Heatmap
# Library: makie 0.21.9 | Julia 1.11.9
# Quality: 87/100 | Created: 2026-09-04

using CairoMakie
using Colors

# --- Theme tokens -----------------------------------------------------------
const THEME    = get(ENV, "ANYPLOT_THEME", "light")
const PAGE_BG  = THEME == "light" ? colorant"#FAF8F1" : colorant"#1A1A17"
const INK      = THEME == "light" ? colorant"#1A1A17" : colorant"#F0EFE8"
const INK_SOFT = THEME == "light" ? colorant"#4A4A44" : colorant"#B8B7B0"

# --- Data: bird species classifier confusion matrix -------------------------
# Rows = true species, columns = predicted species. Small songbirds
# (Sparrow, Finch, Robin) are visually similar and get confused with each
# other more often; raptors (Owl, Hawk) are visually distinct and are rarely
# confused with songbirds or with each other.
class_names = ["Sparrow", "Finch", "Robin", "Owl", "Hawk"]
n_classes = length(class_names)
sample_sizes = [180, 150, 165, 90, 95]
confusion_rates = [
    0.90 0.05 0.04 0.00 0.01
    0.06 0.87 0.06 0.00 0.01
    0.05 0.07 0.86 0.01 0.01
    0.00 0.01 0.01 0.93 0.05
    0.01 0.00 0.01 0.06 0.92
]

counts = zeros(Int, n_classes, n_classes)
for i in 1:n_classes
    counts[i, :] = round.(Int, sample_sizes[i] .* confusion_rates[i, :])
end
max_count = maximum(counts)

# Row-normalized percentages (recall): each cell as a share of its true-class
# row total — satisfies the spec's "support normalization by row" requirement
# alongside the raw counts.
row_sums = vec(sum(counts; dims = 2))
row_pct = [round(Int, 100 * counts[i, j] / row_sums[i]) for i in 1:n_classes, j in 1:n_classes]
diag_counts = [counts[i, i] for i in 1:n_classes]
overall_accuracy = 100 * sum(diag_counts) / sum(counts)

# --- Colormap: Imprint sequential (single-polarity count data) --------------
const IMPRINT_SEQ = cgrad([colorant"#009E73", colorant"#4467A3"])

# --- Plot ---------------------------------------------------------------
fig = Figure(
    resolution      = (1200, 1200),
    fontsize        = 14,
    backgroundcolor = PAGE_BG,
)

ax = Axis(
    fig[1, 1];
    title              = rich(
        "confusion-matrix · julia · makie · anyplot.ai",
        "\n",
        rich(
            "Overall accuracy: $(round(overall_accuracy, digits = 1))% · cells show count and row-normalized recall";
            fontsize = 13, color = INK_SOFT,
        ),
    ),
    titlesize          = 20,
    titlecolor         = INK,
    xlabel             = "Predicted Label",
    ylabel             = "True Label",
    xlabelsize         = 14,
    ylabelsize         = 14,
    xlabelcolor        = INK,
    ylabelcolor        = INK,
    xticklabelsize     = 12,
    yticklabelsize     = 12,
    xticklabelcolor    = INK_SOFT,
    yticklabelcolor    = INK_SOFT,
    xticks             = (1:n_classes, class_names),
    yticks             = (1:n_classes, class_names),
    xtickcolor         = INK_SOFT,
    ytickcolor         = INK_SOFT,
    backgroundcolor    = PAGE_BG,
    aspect             = DataAspect(),
    yreversed          = true,
    leftspinecolor     = INK_SOFT,
    rightspinecolor    = INK_SOFT,
    topspinecolor      = INK_SOFT,
    bottomspinecolor   = INK_SOFT,
    xgridvisible       = false,
    ygridvisible       = false,
)

zmatrix = permutedims(counts)
hm = heatmap!(
    ax, 1:n_classes, 1:n_classes, zmatrix;
    colormap = IMPRINT_SEQ, colorrange = (0, max_count),
)

# Cell annotations — raw count above the row-normalized recall percentage,
# combined into a single two-line text! call per cell (a separate text!
# call per line risked being dropped); text color adapts to cell luminance
# so it stays legible across the full green-to-blue sequential range.
for i in 1:n_classes, j in 1:n_classes
    value = counts[i, j]
    t = max_count == 0 ? 0.0 : value / max_count
    cell_color = IMPRINT_SEQ[t]
    luminance = 0.2126 * red(cell_color) + 0.7152 * green(cell_color) + 0.0722 * blue(cell_color)
    text_color = luminance > 0.55 ? INK : colorant"#FFFFFF"
    text!(
        ax, j, i, text = "$(value)\n$(row_pct[i, j])%",
        align = (:center, :center), color = text_color, fontsize = 15,
    )
end

# Highlight the diagonal (correct predictions)
for i in 1:n_classes
    xs = [i - 0.5, i + 0.5, i + 0.5, i - 0.5, i - 0.5]
    ys = [i - 0.5, i - 0.5, i + 0.5, i + 0.5, i - 0.5]
    lines!(ax, xs, ys; color = INK, linewidth = 3)
end

Colorbar(
    fig[1, 2], hm;
    label = "Sample Count", labelsize = 14, labelcolor = INK,
    ticklabelsize = 12, ticklabelcolor = INK_SOFT, width = 25,
)

# --- Save -------------------------------------------------------------------
save("plot-$(THEME).png", fig; px_per_unit = 2)
Runnable source as JSON, for any HTTP client: https://api.anyplot.ai/specs/confusion-matrix/makie/code. Any spec id and library id listed in llms-full.txt fit the same URL shape; every URL below is complete and callable.
{
  "spec_id": "confusion-matrix",
  "language": "julia",
  "library": "makie",
  "page": "https://anyplot.ai/confusion-matrix/julia/makie",
  "hub": "https://anyplot.ai/confusion-matrix",
  "code_json": "https://api.anyplot.ai/specs/confusion-matrix/makie/code",
  "spec_json": "https://api.anyplot.ai/specs/confusion-matrix",
  "render_light_png": "https://storage.googleapis.com/anyplot-images/plots/confusion-matrix/julia/makie/plot-light.png",
  "render_dark_png": "https://storage.googleapis.com/anyplot-images/plots/confusion-matrix/julia/makie/plot-dark.png",
  "quality_score": 87.0,
  "license": "MIT",
  "guide": "https://anyplot.ai/llms.txt"
}
Part of Confusion Matrix Heatmap on anyplot.ai.