The same plot in 14 other libraries — JavaScript: Chart.js, D3.js, Apache ECharts, Highcharts; Python: Altair, Bokeh, lets-plot, Matplotlib, Plotly, plotnine, Pygal, Seaborn; R: ggplot2; Julia: Makie.jl. Compare all 15 side by side: Confusion Matrix Heatmap in Python, R, Julia and JavaScript.
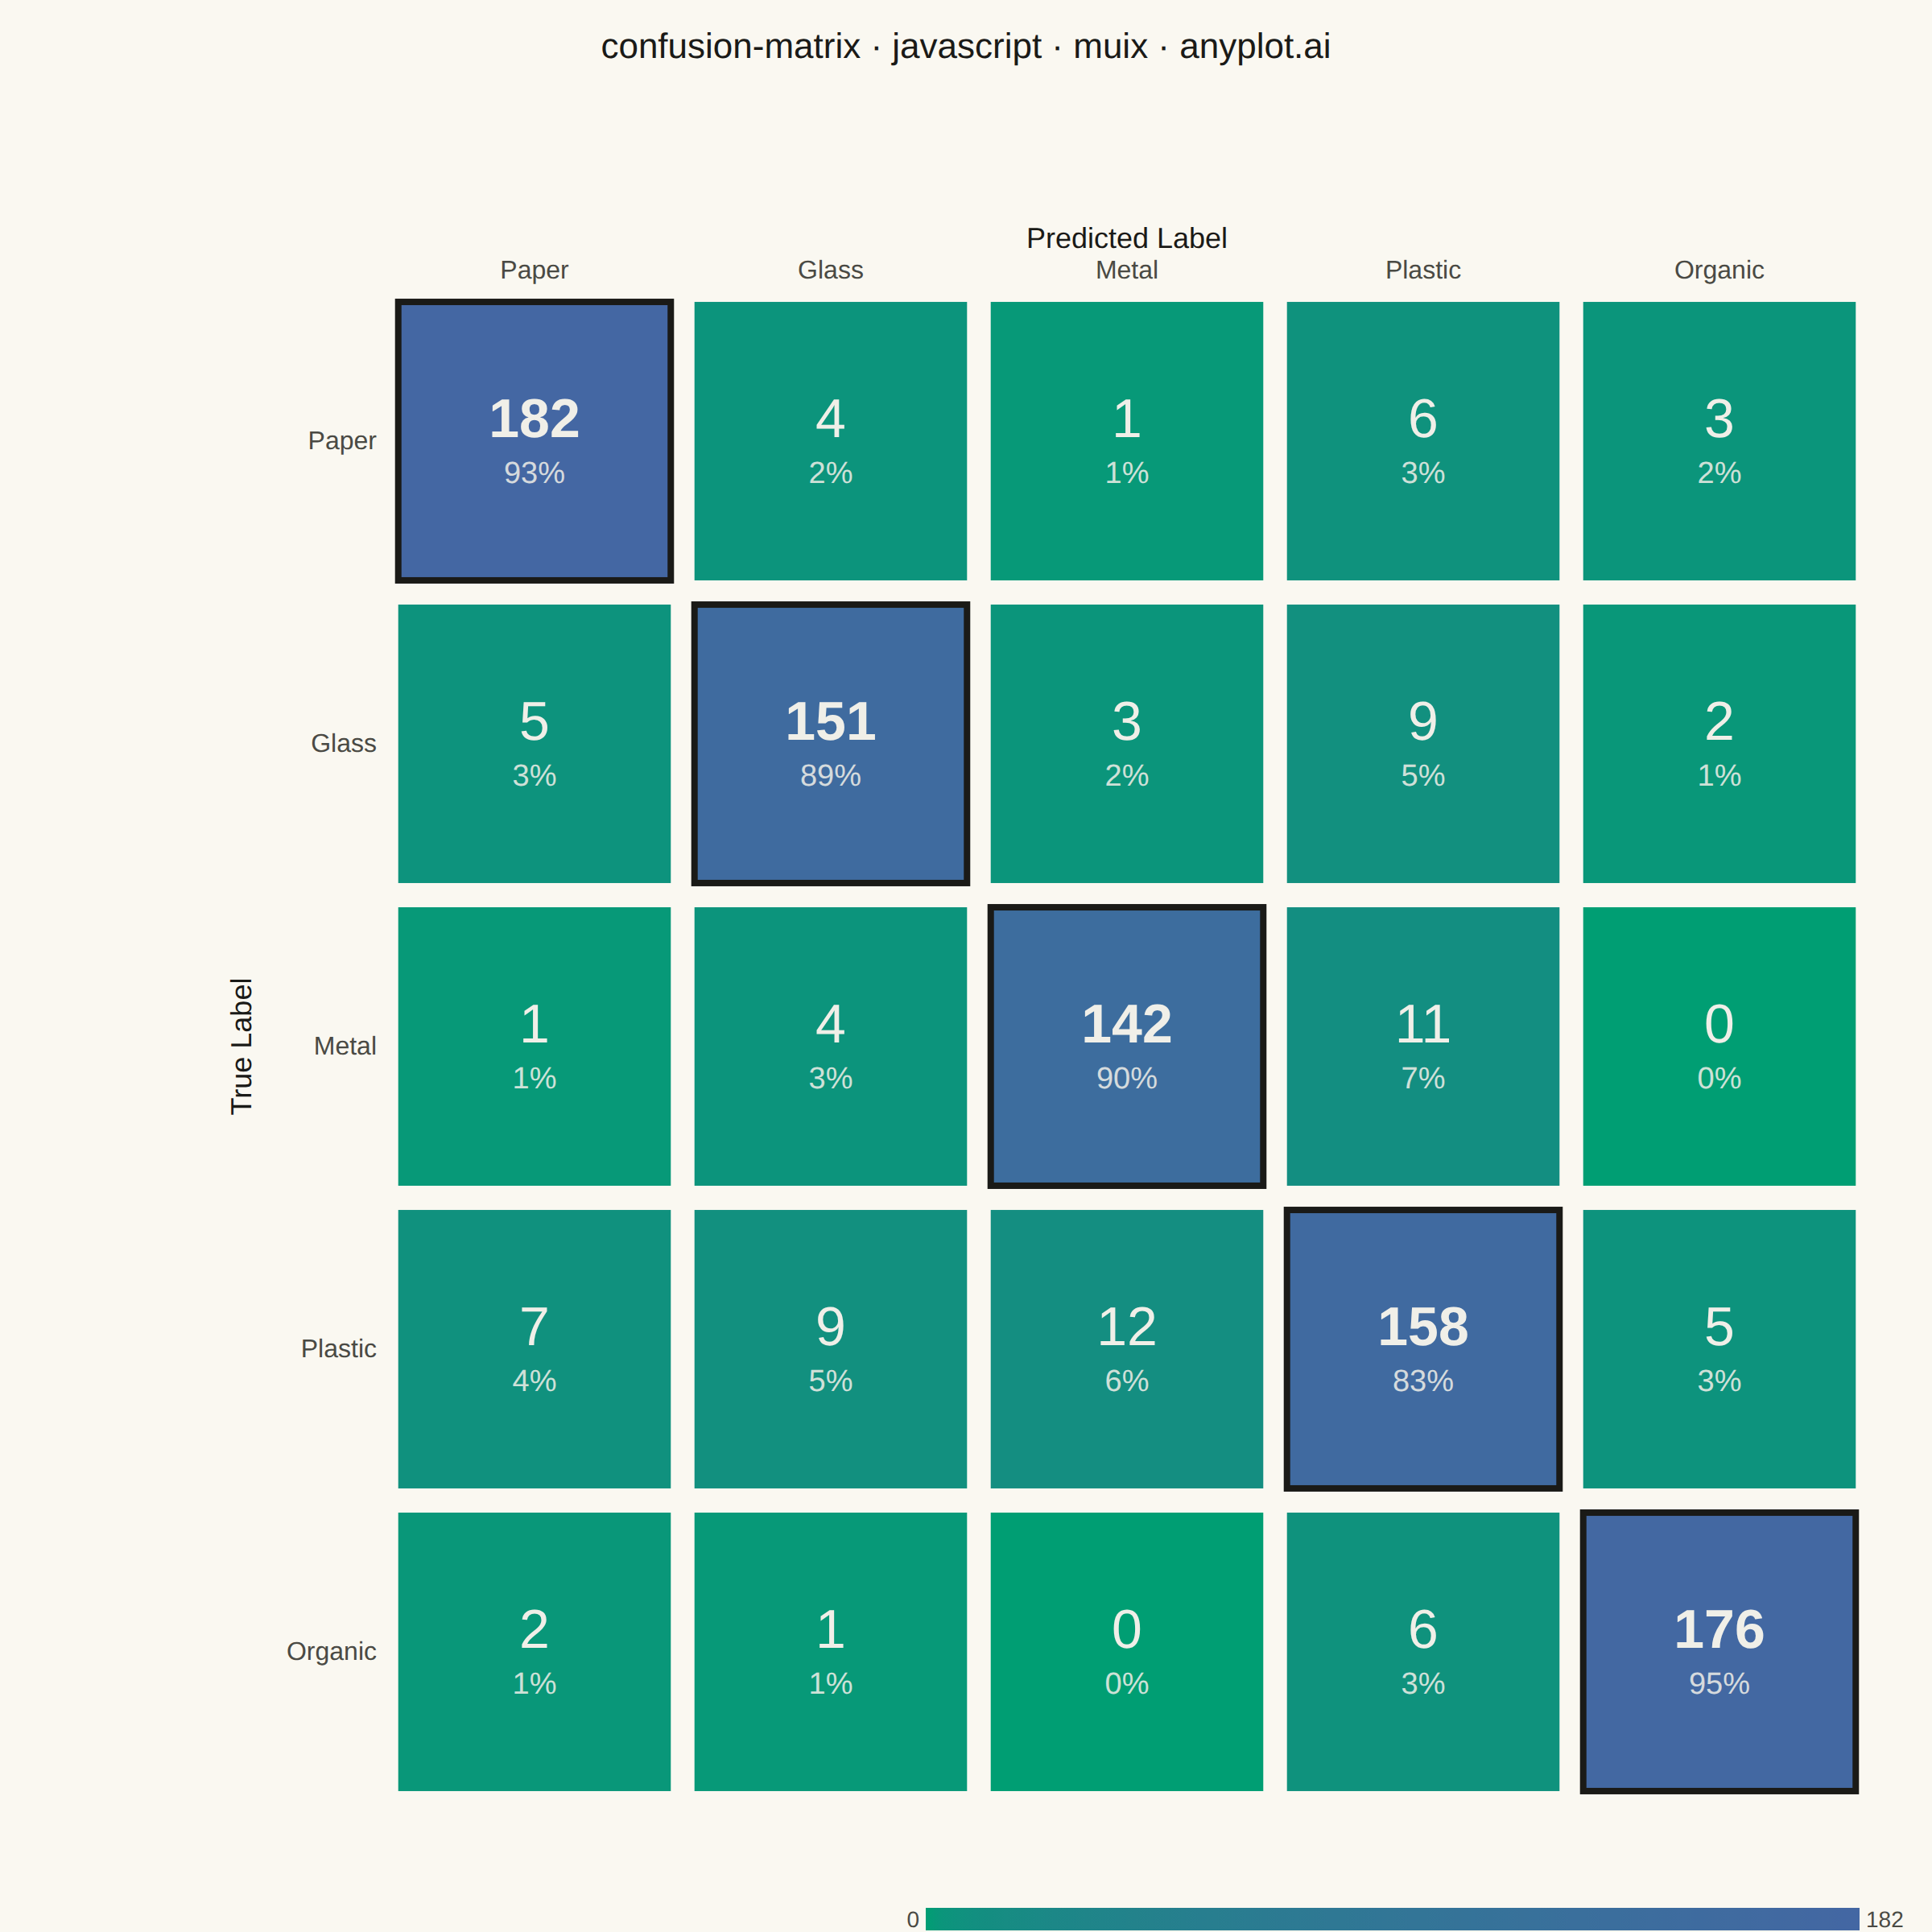
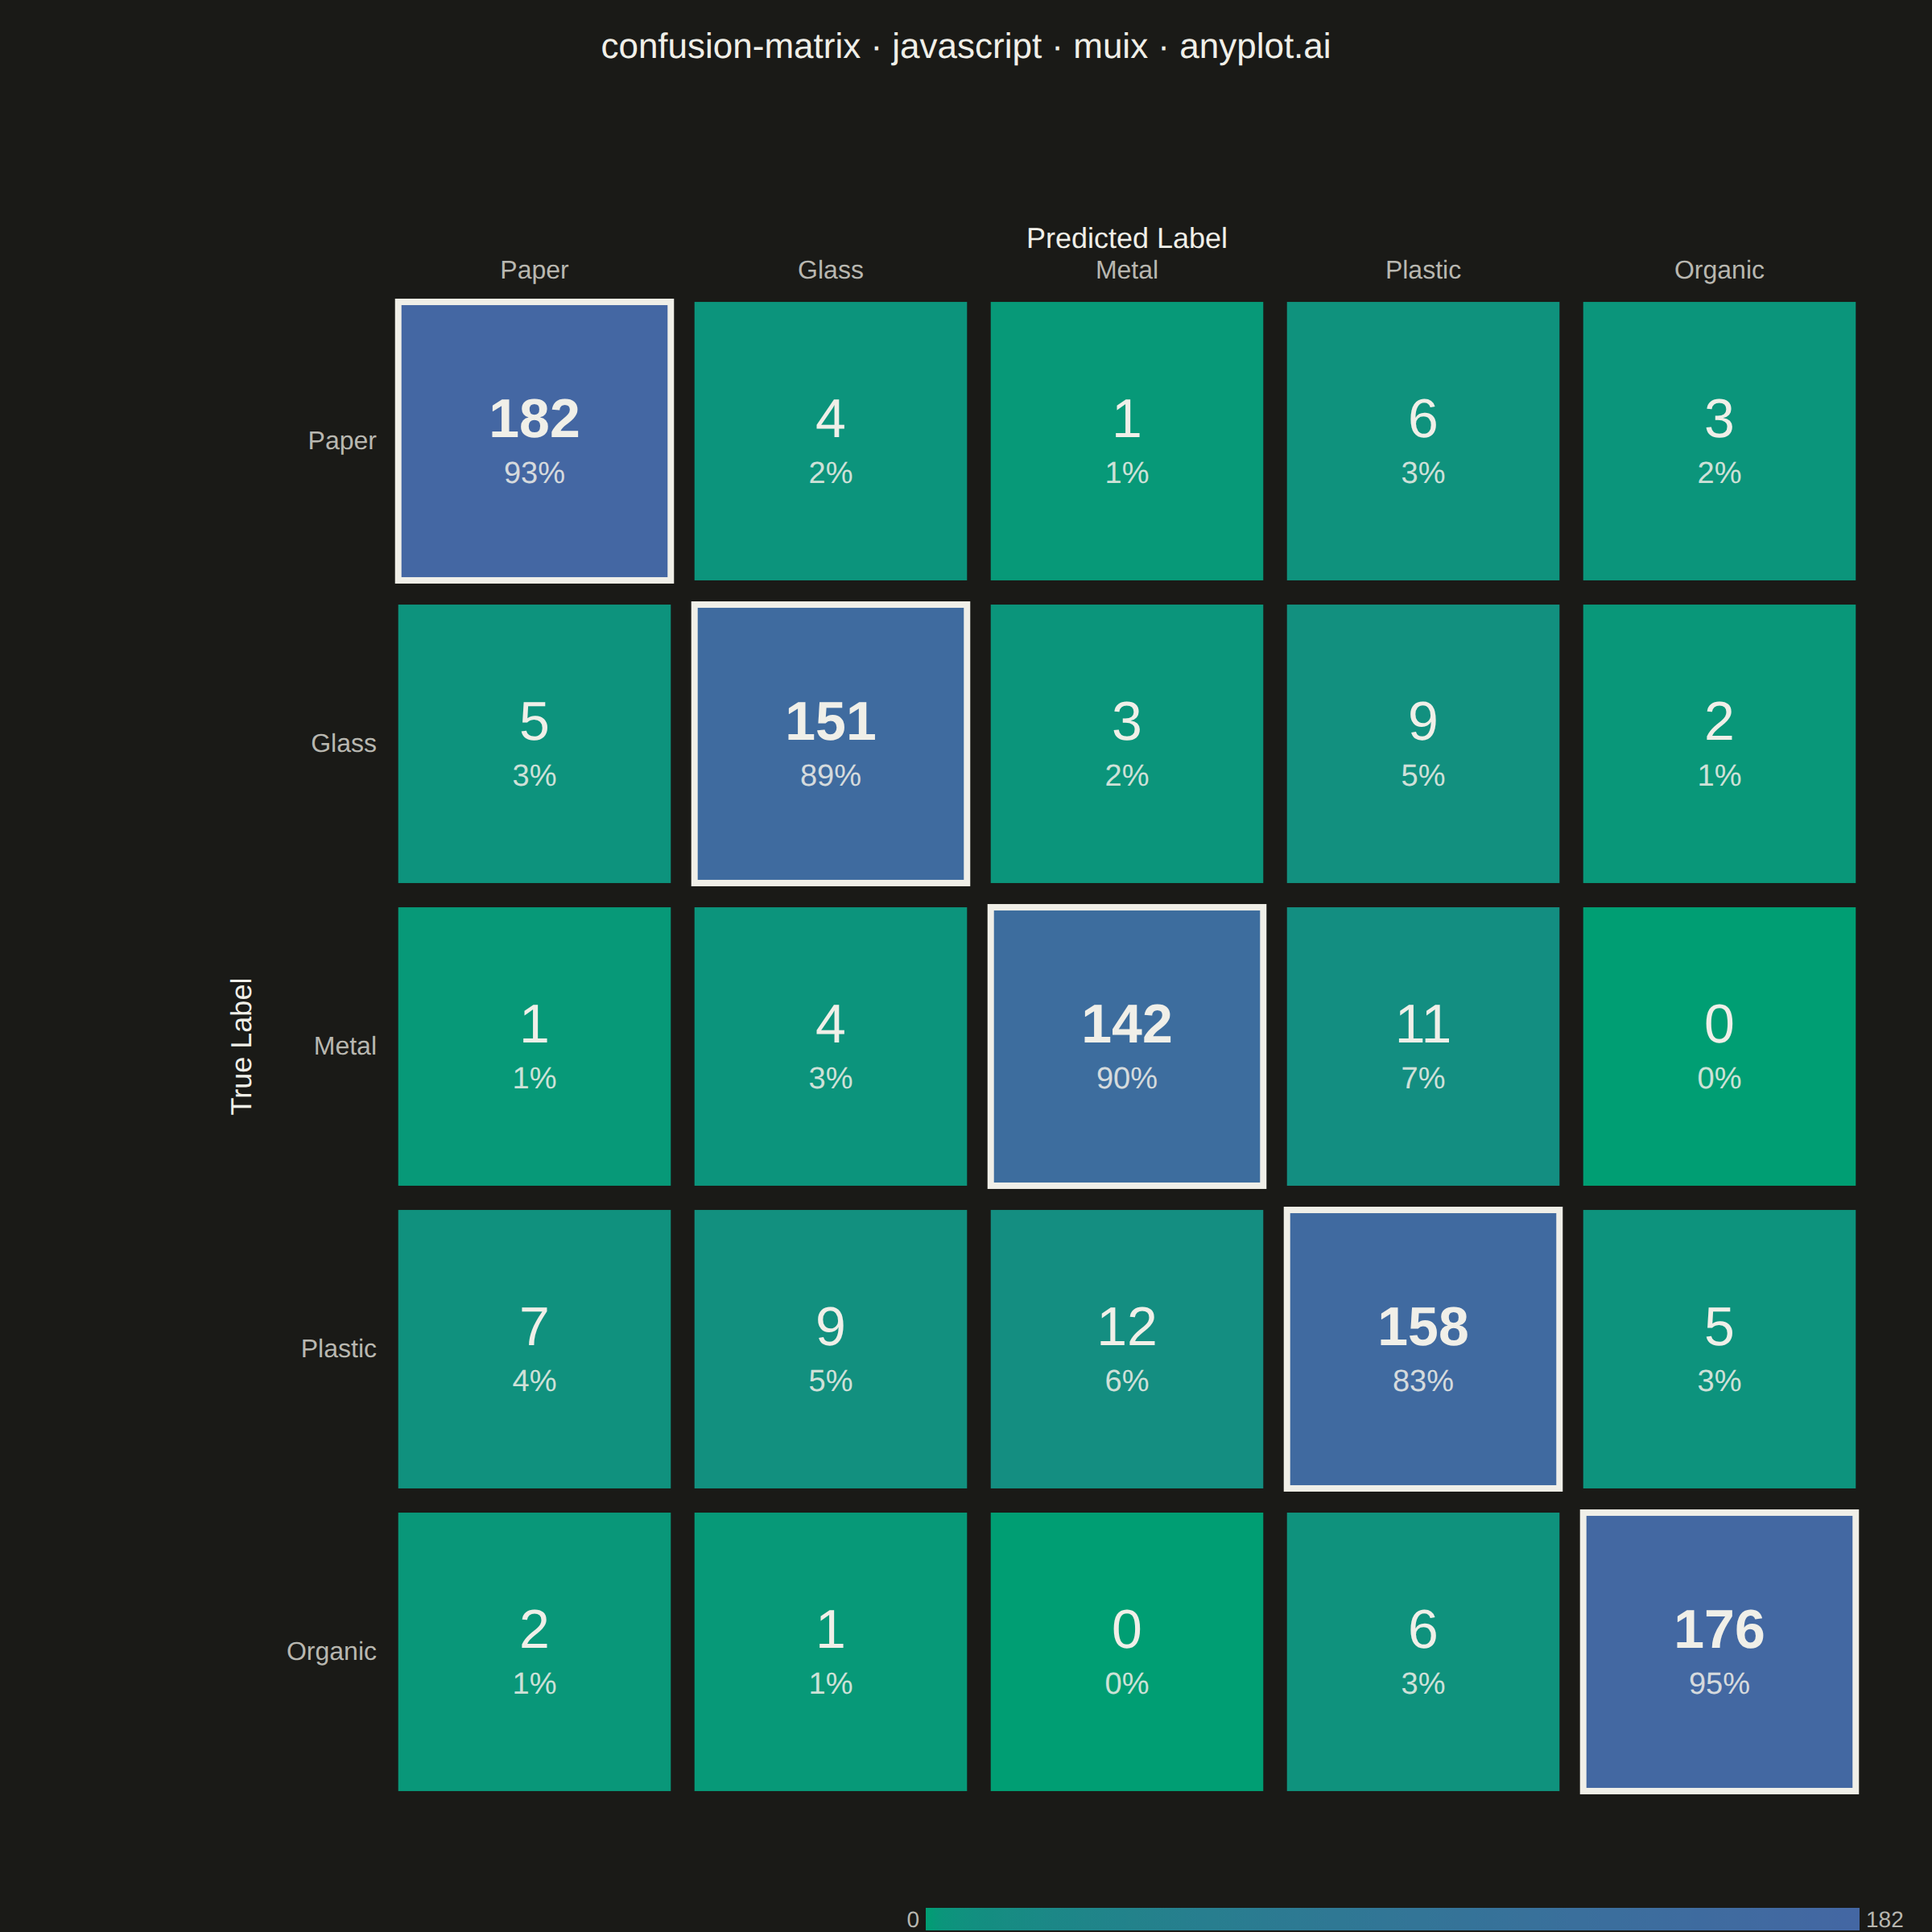
A specialized heatmap visualization for evaluating classification model performance, displaying the counts or proportions of predicted vs actual class labels. The confusion matrix reveals true positives, false positives, true negatives, and false negatives at a glance, making it essential for understanding model behavior, identifying class imbalances, and diagnosing specific misclassification patterns.
// anyplot.ai
// confusion-matrix: Confusion Matrix Heatmap
// Library: muix 7.29.1 | JavaScript 22.23.2
// Quality: 89/100 | Created: 2026-09-04
//# anyplot-orientation: square
// anyplot.ai
// confusion-matrix: Confusion Matrix Heatmap
// Library: MUI X Charts | React | Node 22
// License: @mui/x-charts — MIT (community). Pro/Premium are out of scope.
// Quality: pending | Created: 2026-09-04

import Box from "@mui/material/Box";
import Typography from "@mui/material/Typography";
import { ScatterChart } from "@mui/x-charts/ScatterChart";
import { ContinuousColorLegend } from "@mui/x-charts/ChartsLegend";

const tokens = window.ANYPLOT_TOKENS;

// --- Data (in-memory, deterministic) — recycling-sorter classifier example -
// Rows = true material, columns = predicted material. Off-diagonal counts
// model plausible confusions (glass/plastic/metal look alike on a conveyor).
const classes = ["Paper", "Glass", "Metal", "Plastic", "Organic"];
const matrix = [
  [182, 4, 1, 6, 3],
  [5, 151, 3, 9, 2],
  [1, 4, 142, 11, 0],
  [7, 9, 12, 158, 5],
  [2, 1, 0, 6, 176],
];
const maxCount = Math.max(...matrix.flat());

const points = [];
classes.forEach((trueClass, row) => {
  const rowTotal = matrix[row].reduce((sum, v) => sum + v, 0);
  classes.forEach((predictedClass, col) => {
    const count = matrix[row][col];
    points.push({
      id: `${row}-${col}`,
      x: predictedClass,
      y: trueClass,
      z: count,
      count,
      rowPct: Math.round((count / rowTotal) * 100),
    });
  });
});

// --- Sequential Imprint color scale (imprint_seq: brand green -> blue) -----
function mixHex(hexA, hexB, ratio) {
  const a = parseInt(hexA.slice(1), 16);
  const b = parseInt(hexB.slice(1), 16);
  const channel = (shift) => {
    const av = (a >> shift) & 255;
    const bv = (b >> shift) & 255;
    return Math.round(av + (bv - av) * ratio);
  };
  return `#${[16, 8, 0].map((shift) => channel(shift).toString(16).padStart(2, "0")).join("")}`;
}

// `t` arrives pre-normalized to [0, 1] by the zAxis colorMap's scaleSequential
// (from the 0..maxCount domain below). The diagonal's high counts dominate
// that domain, crushing every off-diagonal misclassification count into a
// near-identical sliver near t=0 — gamma-compress so low counts spread across
// more of the range while t=1 (the diagonal) still lands on the same `high`
// endpoint, keeping it visually dominant.
function sequentialColor(t) {
  const [low, high] = tokens.seq;
  return mixHex(low, high, Math.pow(t, 0.45));
}

function relativeLuminance(hex) {
  const n = parseInt(hex.slice(1), 16);
  const r = ((n >> 16) & 255) / 255;
  const g = ((n >> 8) & 255) / 255;
  const b = (n & 255) / 255;
  return 0.2126 * r + 0.7152 * g + 0.0722 * b;
}

// Custom marker: filled square cells with count + row-normalized percentage,
// and an ink outline on the diagonal to call out correct predictions.
function ConfusionCell(props) {
  const { series, xScale, yScale, colorGetter, color } = props;
  const cellWidth = xScale.bandwidth();
  const cellHeight = yScale.bandwidth();
  const countFontSize = Math.round(Math.min(cellWidth, cellHeight) * 0.2);
  const pctFontSize = Math.round(countFontSize * 0.55);

  return (
    <g>
      {series.data.map((point, i) => {
        const x0 = xScale(point.x) ?? 0;
        const y0 = yScale(point.y) ?? 0;
        const fill = colorGetter ? colorGetter(i) : color;
        const textFill = relativeLuminance(fill) > 0.55 ? "#1A1A17" : "#F0EFE8";
        const isCorrect = point.x === point.y;
        return (
          <g key={point.id}>
            <rect
              x={x0}
              y={y0}
              width={cellWidth}
              height={cellHeight}
              fill={fill}
              stroke={isCorrect ? tokens.ink : "none"}
              strokeWidth={isCorrect ? 4 : 0}
            />
            <text
              x={x0 + cellWidth / 2}
              y={y0 + cellHeight / 2 - pctFontSize * 0.7}
              textAnchor="middle"
              dominantBaseline="central"
              fontSize={countFontSize}
              fontWeight={isCorrect ? 700 : 400}
              fontFamily="inherit"
              fill={textFill}
            >
              {point.count}
            </text>
            <text
              x={x0 + cellWidth / 2}
              y={y0 + cellHeight / 2 + countFontSize * 0.6}
              textAnchor="middle"
              dominantBaseline="central"
              fontSize={pctFontSize}
              fontFamily="inherit"
              fill={textFill}
              opacity={0.85}
            >
              {point.rowPct}%
            </text>
          </g>
        );
      })}
    </g>
  );
}

export default function Chart() {
  const { width, height } = window.ANYPLOT_SIZE;
  const TITLE_HEIGHT = 80;
  const RIGHT_BUFFER = 40; // room for the legend's max-value label at the true edge
  const TOP_MARGIN = 100; // top-axis tick labels + "Predicted Label" axis title
  const LEFT_MARGIN = 220; // left-axis tick labels + "True Label" axis title
  const RIGHT_MARGIN = 20;
  const LEGEND_SPACE = 80;

  const chartWidth = width - RIGHT_BUFFER;
  const chartHeight = height - TITLE_HEIGHT;

  return (
    <Box sx={{ width, height, bgcolor: tokens.pageBg, display: "flex", flexDirection: "column" }}>
      <Typography
        sx={{
          color: tokens.ink,
          fontSize: 22,
          fontWeight: 500,
          textAlign: "center",
          lineHeight: 1.2,
          pt: "16px",
          height: TITLE_HEIGHT,
          fontFamily: "inherit",
        }}
      >
        confusion-matrix · javascript · muix · anyplot.ai
      </Typography>
      <Box sx={{ flex: 1, display: "flex", alignItems: "flex-start", justifyContent: "flex-start" }}>
        <ScatterChart
          width={chartWidth}
          height={chartHeight}
          skipAnimation
          disableVoronoi
          series={[
            {
              id: "confusion",
              type: "scatter",
              data: points,
              label: "Predictions",
              xAxisId: "predicted",
              yAxisId: "actual",
              zAxisId: "count",
            },
          ]}
          xAxis={[
            {
              id: "predicted",
              scaleType: "band",
              data: classes,
              categoryGapRatio: 0.08,
              label: "Predicted Label",
              labelStyle: { fontSize: 18, fill: tokens.ink, fontFamily: "inherit" },
              tickLabelStyle: { fontSize: 16, fill: tokens.inkSoft, fontFamily: "inherit" },
              disableTicks: true,
              disableLine: true,
            },
          ]}
          yAxis={[
            {
              id: "actual",
              scaleType: "band",
              data: classes,
              categoryGapRatio: 0.08,
              label: "True Label",
              labelStyle: { fontSize: 18, fill: tokens.ink, fontFamily: "inherit" },
              tickLabelStyle: { fontSize: 16, fill: tokens.inkSoft, fontFamily: "inherit" },
              // Pushes the rotated axis title clear of the widest tick label
              // ("Plastic"/"Organic") — the title's own offset is computed
              // from this value, not the actual rendered tickLabelStyle size.
              tickFontSize: 70,
              disableTicks: true,
              disableLine: true,
            },
          ]}
          zAxis={[
            {
              id: "count",
              min: 0,
              max: maxCount,
              colorMap: { type: "continuous", min: 0, max: maxCount, color: sequentialColor },
            },
          ]}
          topAxis="predicted"
          bottomAxis={null}
          leftAxis="actual"
          rightAxis={null}
          margin={{ top: TOP_MARGIN, right: RIGHT_MARGIN, bottom: LEGEND_SPACE, left: LEFT_MARGIN }}
          slots={{ scatter: ConfusionCell }}
          slotProps={{ legend: { hidden: true } }}
        >
          <ContinuousColorLegend
            axisId="count"
            axisDirection="z"
            position={{ horizontal: "right", vertical: "bottom" }}
            direction="row"
            length="50%"
            thickness={14}
            labelStyle={{ fontSize: 14, fill: tokens.inkSoft, fontFamily: "inherit" }}
          />
        </ScatterChart>
      </Box>
    </Box>
  );
}
Runnable source as JSON, for any HTTP client: https://api.anyplot.ai/specs/confusion-matrix/muix/code. Any spec id and library id listed in llms-full.txt fit the same URL shape; every URL below is complete and callable.
{
  "spec_id": "confusion-matrix",
  "language": "javascript",
  "library": "muix",
  "page": "https://anyplot.ai/confusion-matrix/javascript/muix",
  "hub": "https://anyplot.ai/confusion-matrix",
  "code_json": "https://api.anyplot.ai/specs/confusion-matrix/muix/code",
  "spec_json": "https://api.anyplot.ai/specs/confusion-matrix",
  "render_light_png": "https://storage.googleapis.com/anyplot-images/plots/confusion-matrix/javascript/muix/plot-light.png",
  "render_dark_png": "https://storage.googleapis.com/anyplot-images/plots/confusion-matrix/javascript/muix/plot-dark.png",
  "interactive_light_html": "https://storage.googleapis.com/anyplot-images/plots/confusion-matrix/javascript/muix/plot-light.html",
  "interactive_dark_html": "https://storage.googleapis.com/anyplot-images/plots/confusion-matrix/javascript/muix/plot-dark.html",
  "quality_score": 89.0,
  "license": "MIT",
  "guide": "https://anyplot.ai/llms.txt"
}
Part of Confusion Matrix Heatmap on anyplot.ai.