The same plot in 14 other libraries — JavaScript: Chart.js, D3.js, Apache ECharts, MUI X Charts; Python: Altair, Bokeh, lets-plot, Matplotlib, Plotly, plotnine, Pygal, Seaborn; R: ggplot2; Julia: Makie.jl. Compare all 15 side by side: Confusion Matrix Heatmap in Python, R, Julia and JavaScript.
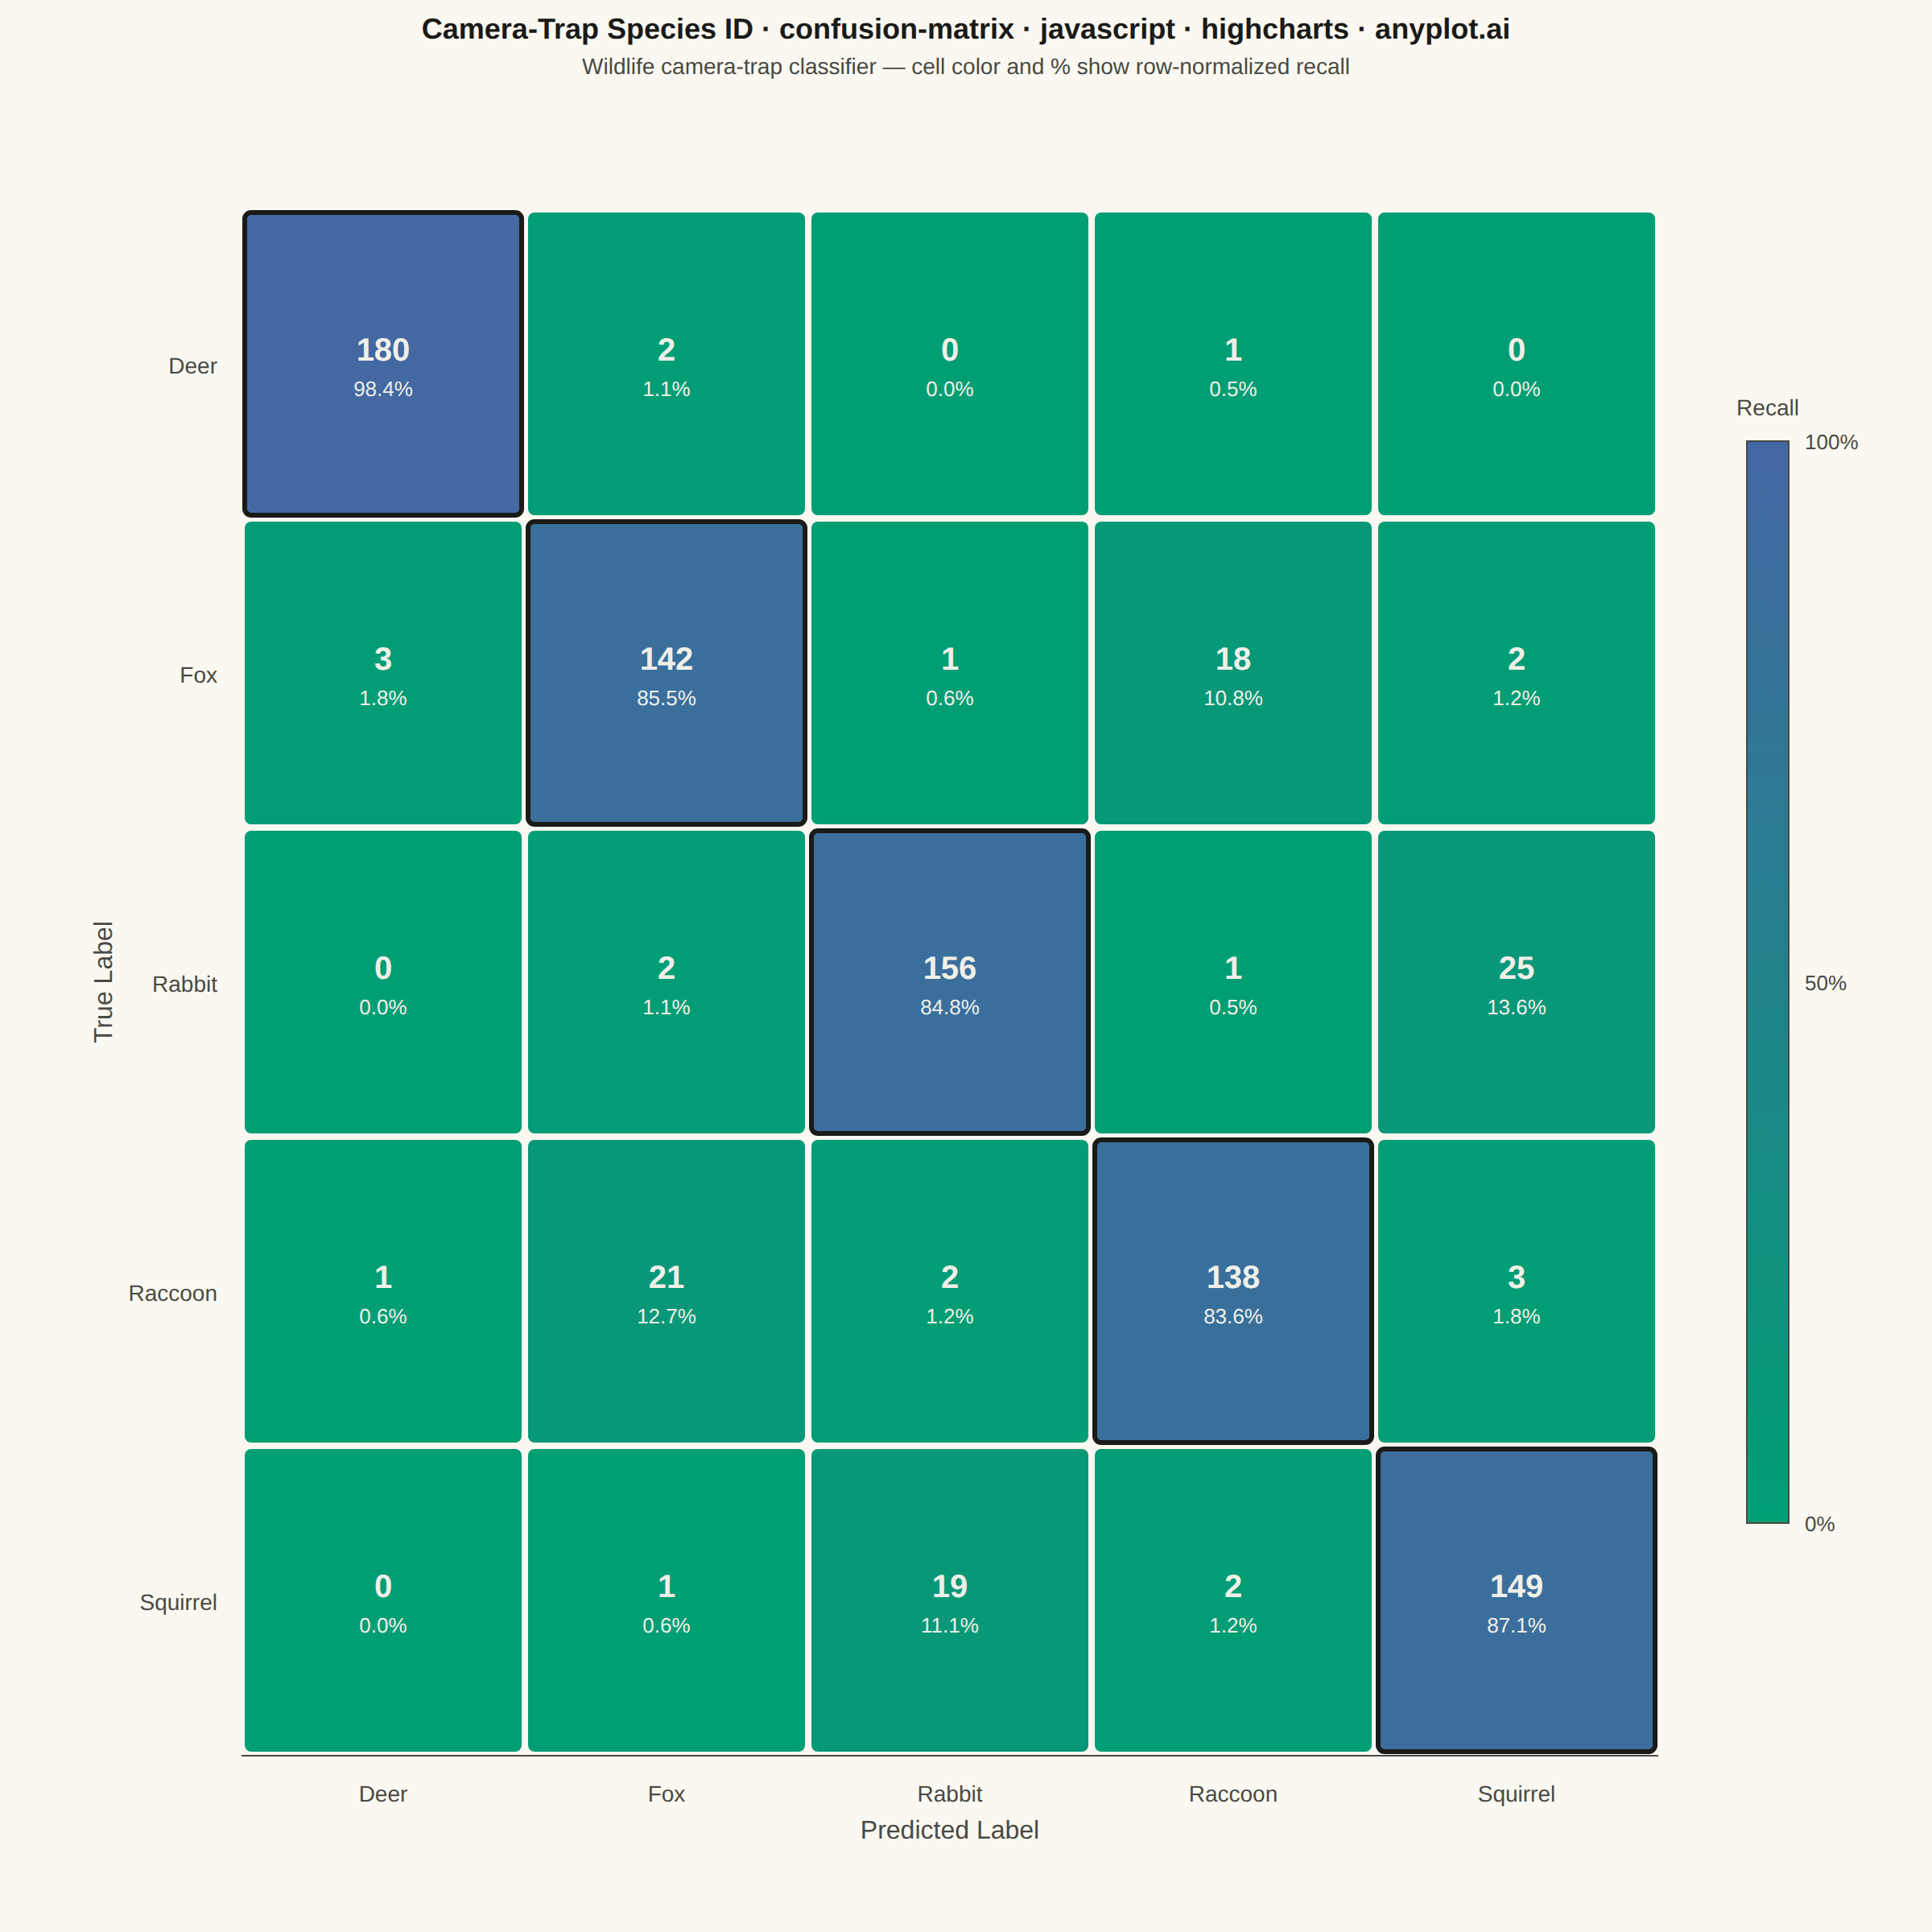
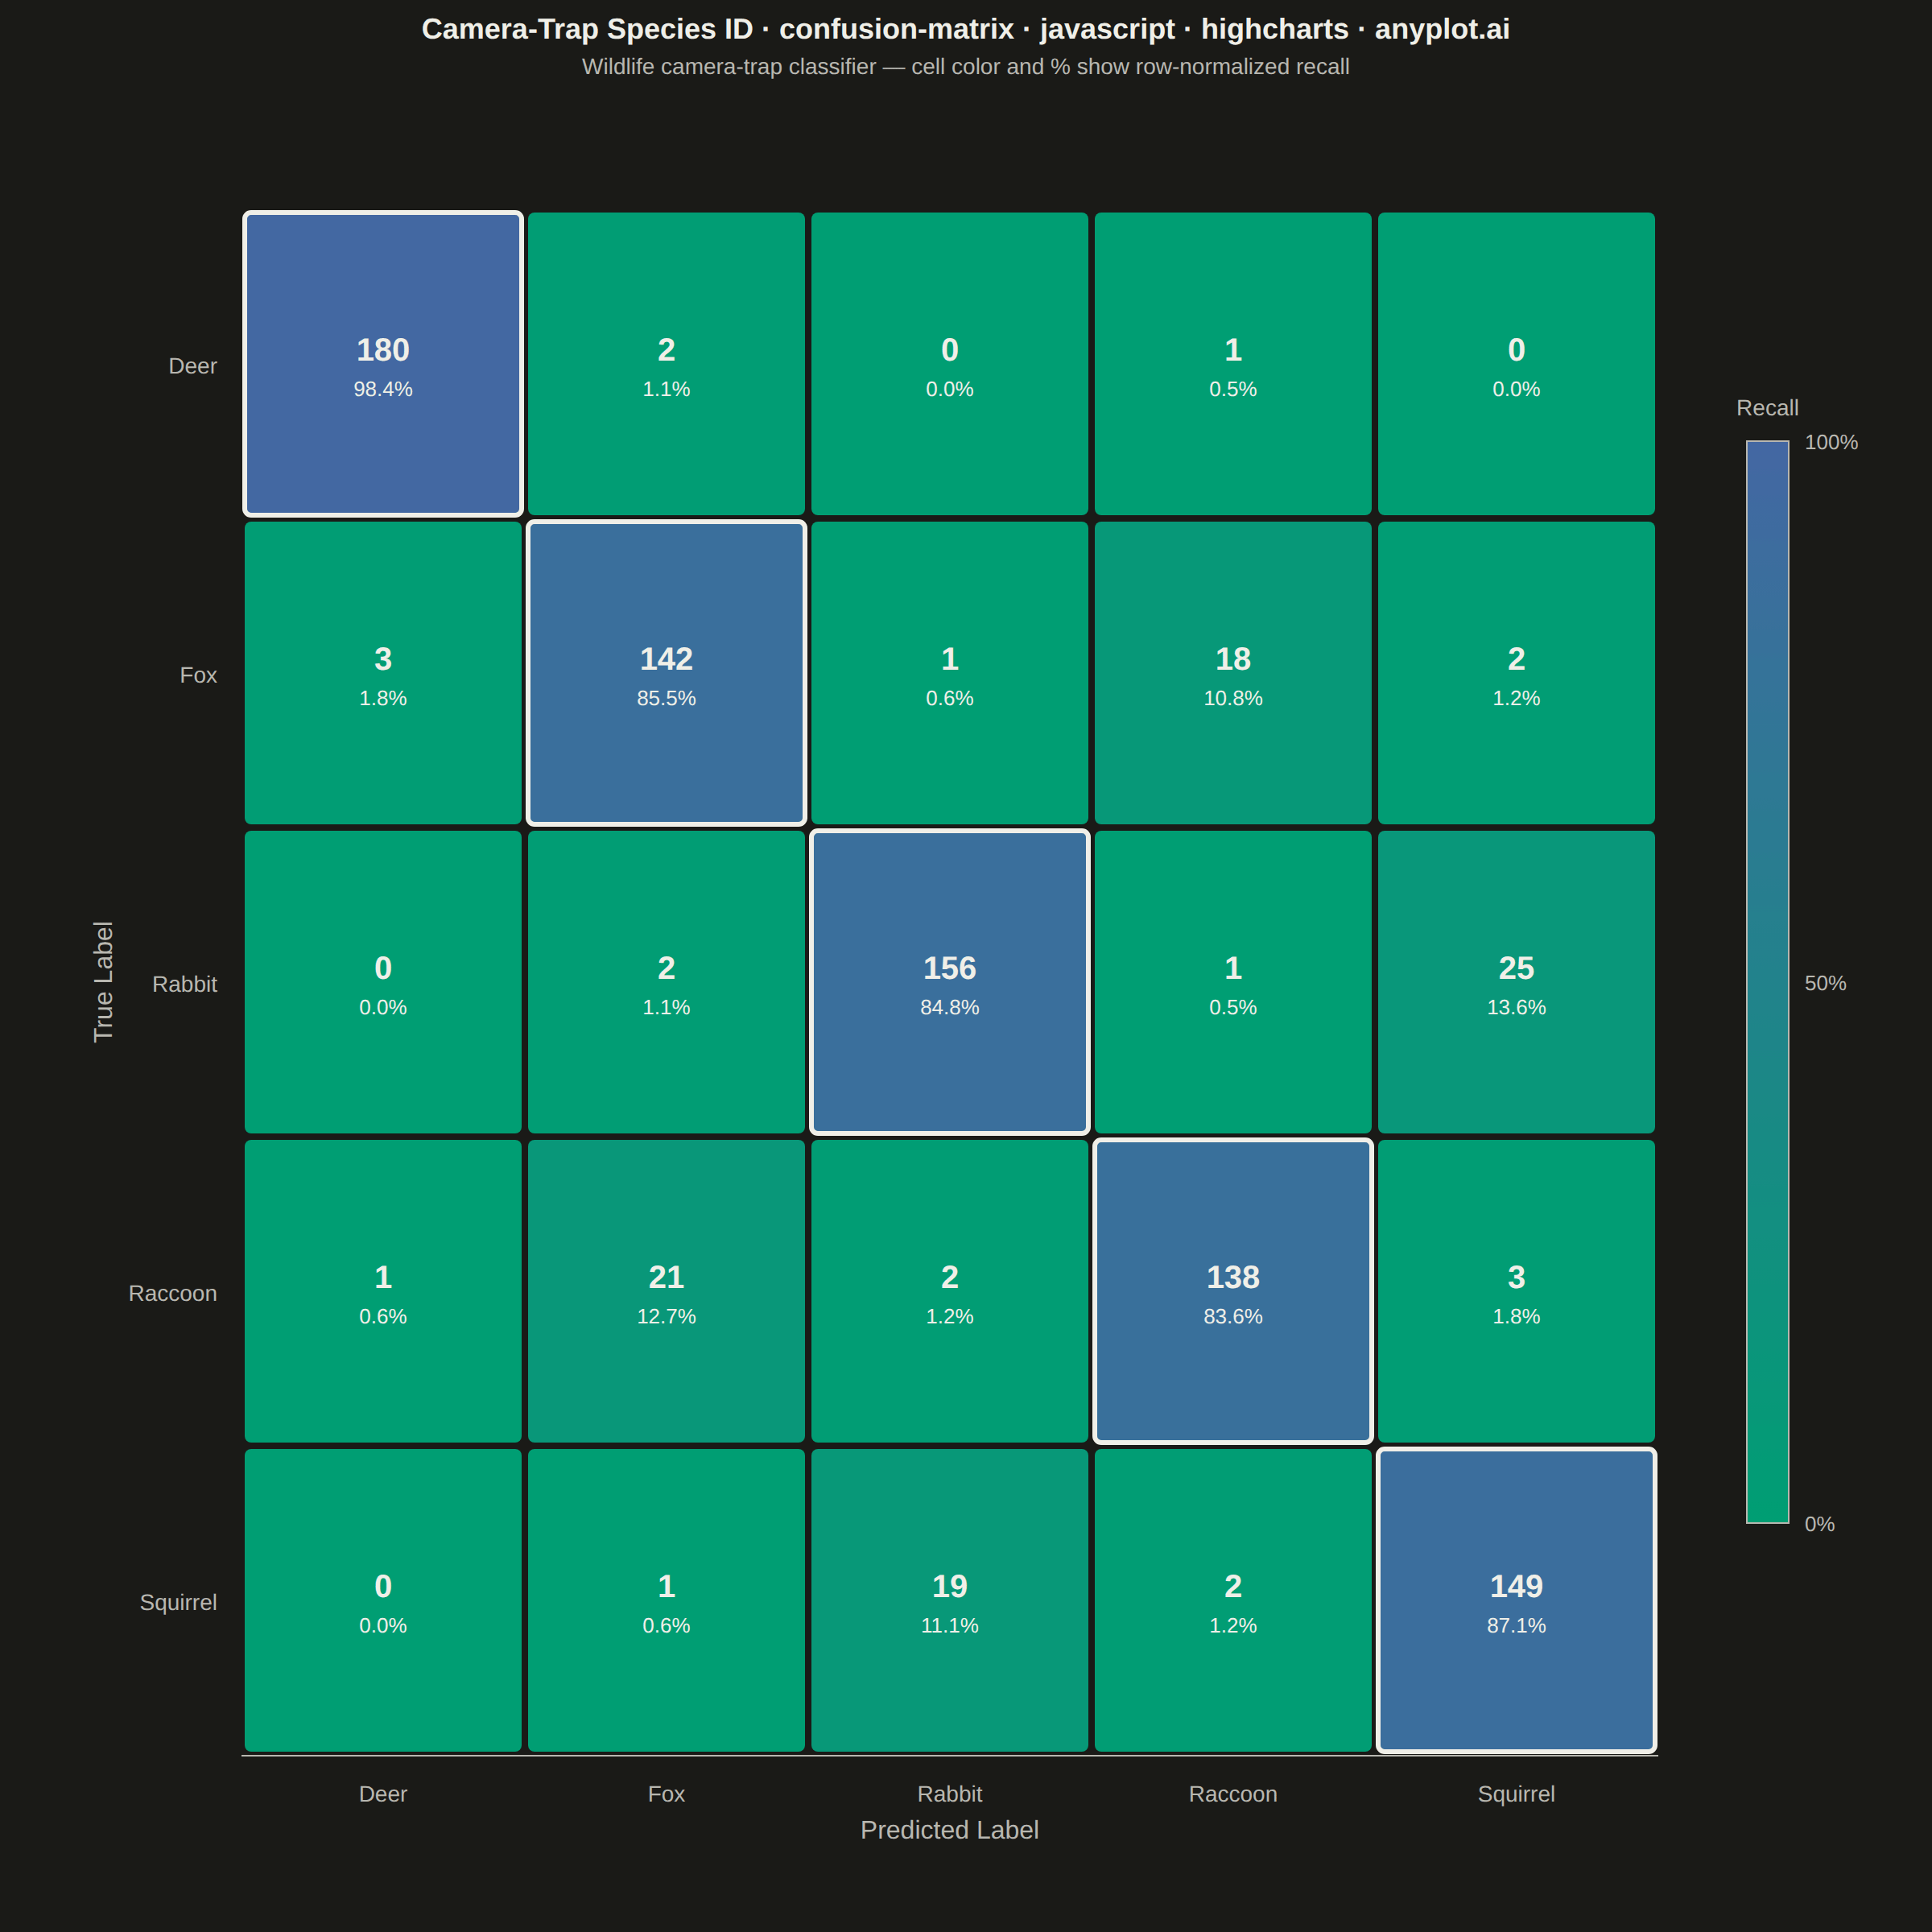
A specialized heatmap visualization for evaluating classification model performance, displaying the counts or proportions of predicted vs actual class labels. The confusion matrix reveals true positives, false positives, true negatives, and false negatives at a glance, making it essential for understanding model behavior, identifying class imbalances, and diagnosing specific misclassification patterns.
// anyplot.ai
// confusion-matrix: Confusion Matrix Heatmap
// Library: highcharts 12.6.0 | JavaScript 22.23.2
// Quality: 91/100 | Created: 2026-09-04
//# anyplot-orientation: square

const t = window.ANYPLOT_TOKENS;

// --- Data: camera-trap species classifier, true vs. predicted species ------
// The core Highcharts bundle has no heatmap/colorAxis module loaded, so the
// grid is filled cell-by-cell with the SVG renderer on top of a native
// categorical axis pair (which supplies the tick labels and axis titles).
const SPECIES = ['Deer', 'Fox', 'Rabbit', 'Raccoon', 'Squirrel'];
const N = SPECIES.length;

// Approximate cell size from the known CSS mount (square canvas, harness-
// guaranteed 1200x1200) — only used to size the invisible hover marker below;
// the visible grid itself is drawn from chart.plotWidth/plotHeight, which is
// exact after layout.
const MARKER_RADIUS = Math.min(window.ANYPLOT_SIZE.width, window.ANYPLOT_SIZE.height) / N / 2 - 4;

// COUNTS[row][col] = true label `row` predicted as `col`. Built so the
// confusions read like real camera-trap mix-ups: Fox/Raccoon (similar size,
// both nocturnal) and Rabbit/Squirrel (small, fast, easy to blur together).
const COUNTS = [
  [180, 2, 0, 1, 0],
  [3, 142, 1, 18, 2],
  [0, 2, 156, 1, 25],
  [1, 21, 2, 138, 3],
  [0, 1, 19, 2, 149],
];

const ROW_TOTALS = COUNTS.map((row) => row.reduce((sum, v) => sum + v, 0));

// Row-normalized recall drives both the cell color and the headline
// percentage, so the grid highlights *where* a class is most often confused
// rather than letting classes with more test samples dominate the palette.
function recall(row, col) {
  return COUNTS[row][col] / ROW_TOTALS[row];
}

// --- Color: imprint_seq — low recall (green) .. high recall (blue) ---------
function hexToRgb(hex) {
  return [parseInt(hex.slice(1, 3), 16), parseInt(hex.slice(3, 5), 16), parseInt(hex.slice(5, 7), 16)];
}
const SEQ_LOW = hexToRgb(t.seq[0]); // #009E73
const SEQ_HIGH = hexToRgb(t.seq[1]); // #4467A3

function lerp(a, b, f) {
  return a + (b - a) * f;
}
function cellRgb(fraction) {
  return [
    Math.round(lerp(SEQ_LOW[0], SEQ_HIGH[0], fraction)),
    Math.round(lerp(SEQ_LOW[1], SEQ_HIGH[1], fraction)),
    Math.round(lerp(SEQ_LOW[2], SEQ_HIGH[2], fraction)),
  ];
}
function cellFill(fraction) {
  const [red, green, blue] = cellRgb(fraction);
  return `rgb(${red},${green},${blue})`;
}

// Relative luminance (WCAG formula) — pick ink-on-fill or paper-on-fill
// text color, whichever gives the stronger contrast against the cell.
function cellTextColor(fraction) {
  const [red, green, blue] = cellRgb(fraction);
  const lin = (c) => {
    const v = c / 255;
    return v <= 0.03928 ? v / 12.92 : Math.pow((v + 0.055) / 1.055, 2.4);
  };
  const luminance = 0.2126 * lin(red) + 0.7152 * lin(green) + 0.0722 * lin(blue);
  return luminance > 0.4 ? '#1A1A17' : '#F0EFE8';
}

// --- Title (fontsize scaled off the 67-char baseline) ----------------------
const TITLE_TEXT = 'Camera-Trap Species ID · confusion-matrix · javascript · highcharts · anyplot.ai';
const TITLE_FS = Math.max(Math.round(22 * Math.min(1, 67 / TITLE_TEXT.length)), 14);

const drawn = [];
function clearDrawn() {
  drawn.forEach((el) => {
    try {
      el.destroy();
    } catch (_err) {
      // already removed on redraw
    }
  });
  drawn.length = 0;
}

function drawAll() {
  const chart = this;
  clearDrawn();
  const r = chart.renderer;

  const cellW = chart.plotWidth / N;
  const cellH = chart.plotHeight / N;

  for (let row = 0; row < N; row++) {
    for (let col = 0; col < N; col++) {
      const fraction = recall(row, col);
      const onDiagonal = row === col;
      const x = chart.plotLeft + col * cellW;
      const y = chart.plotTop + row * cellH;

      drawn.push(
        r
          .rect(x + 2, y + 2, cellW - 4, cellH - 4, 4)
          .attr({
            fill: cellFill(fraction),
            stroke: onDiagonal ? t.ink : 'none',
            'stroke-width': onDiagonal ? 3 : 0,
            zIndex: 2,
          })
          .add()
      );

      const textColor = cellTextColor(fraction);
      drawn.push(
        r
          .text(String(COUNTS[row][col]), x + cellW / 2, y + cellH / 2 - 2)
          .attr({ align: 'center', zIndex: 3 })
          .css({ color: textColor, fontSize: '20px', fontWeight: onDiagonal ? '700' : '600' })
          .add()
      );
      drawn.push(
        r
          .text(`${(fraction * 100).toFixed(1)}%`, x + cellW / 2, y + cellH / 2 + 20)
          .attr({ align: 'center', zIndex: 3 })
          .css({ color: textColor, fontSize: '13px' })
          .add()
      );
    }
  }

  // Vertical recall colorbar, docked in the right margin.
  const barWidth = 26;
  const barLeft = chart.plotLeft + chart.plotWidth + 55;
  const barTop = chart.plotTop + chart.plotHeight * 0.15;
  const barHeight = chart.plotHeight * 0.7;

  drawn.push(
    r
      .rect(barLeft, barTop, barWidth, barHeight)
      .attr({
        fill: {
          linearGradient: { x1: 0, y1: 1, x2: 0, y2: 0 },
          stops: [
            [0, cellFill(0)],
            [1, cellFill(1)],
          ],
        },
        stroke: t.inkSoft,
        'stroke-width': 1,
        zIndex: 2,
      })
      .add()
  );
  [0, 0.5, 1].forEach((frac) => {
    drawn.push(
      r
        .text(`${Math.round(frac * 100)}%`, barLeft + barWidth + 10, barTop + (1 - frac) * barHeight + 5)
        .attr({ align: 'left', zIndex: 2 })
        .css({ color: t.inkSoft, fontSize: '13px' })
        .add()
    );
  });
  drawn.push(
    r
      .text('Recall', barLeft + barWidth / 2, barTop - 16)
      .attr({ align: 'center', zIndex: 2 })
      .css({ color: t.inkSoft, fontSize: '14px', fontWeight: '500' })
      .add()
  );
}

// Invisible scatter layer aligned to each grid cell so hovering exposes a
// real Highcharts tooltip in the interactive HTML output.
const cellPoints = [];
for (let row = 0; row < N; row++) {
  for (let col = 0; col < N; col++) {
    cellPoints.push({
      x: col,
      y: row,
      count: COUNTS[row][col],
      recallPct: recall(row, col) * 100,
      trueLabel: SPECIES[row],
      predictedLabel: SPECIES[col],
    });
  }
}

Highcharts.chart('container', {
  chart: {
    backgroundColor: 'transparent',
    animation: false,
    style: { fontFamily: 'inherit' },
    margin: [130, 170, 110, 150],
    events: { load: drawAll, redraw: drawAll },
  },
  credits: { enabled: false },
  title: {
    text: TITLE_TEXT,
    style: { color: t.ink, fontSize: TITLE_FS + 'px', fontWeight: '600' },
  },
  subtitle: {
    text: 'Wildlife camera-trap classifier — cell color and % show row-normalized recall',
    style: { color: t.inkSoft, fontSize: '14px' },
  },
  xAxis: {
    categories: SPECIES,
    lineColor: t.inkSoft,
    tickLength: 0,
    gridLineWidth: 0,
    labels: { style: { color: t.inkSoft, fontSize: '14px' } },
    title: { text: 'Predicted Label', style: { color: t.inkSoft, fontSize: '16px' } },
  },
  yAxis: {
    categories: SPECIES,
    reversed: true,
    lineColor: t.inkSoft,
    tickLength: 0,
    gridLineWidth: 0,
    labels: { style: { color: t.inkSoft, fontSize: '14px' } },
    title: { text: 'True Label', style: { color: t.inkSoft, fontSize: '16px' } },
  },
  legend: { enabled: false },
  tooltip: {
    enabled: true,
    backgroundColor: t.elevatedBg,
    borderColor: t.inkSoft,
    borderRadius: 6,
    style: { color: t.ink, fontSize: '13px' },
    formatter: function () {
      const p = this.point;
      return (
        `<b>True: ${p.trueLabel}</b> · Predicted: ${p.predictedLabel}<br/>` +
        `${p.count} samples (${p.recallPct.toFixed(1)}% of true ${p.trueLabel})`
      );
    },
  },
  plotOptions: {
    series: { animation: false },
    scatter: {
      enableMouseTracking: true,
      stickyTracking: false,
      marker: {
        enabled: true,
        symbol: 'square',
        radius: MARKER_RADIUS,
        fillColor: 'rgba(0,0,0,0.001)',
        lineWidth: 0,
        states: { hover: { enabled: false } },
      },
    },
  },
  series: [
    {
      type: 'scatter',
      name: 'Confusion cell',
      data: cellPoints,
    },
  ],
});
Runnable source as JSON, for any HTTP client: https://api.anyplot.ai/specs/confusion-matrix/highcharts/code. Any spec id and library id listed in llms-full.txt fit the same URL shape; every URL below is complete and callable.
{
  "spec_id": "confusion-matrix",
  "language": "javascript",
  "library": "highcharts",
  "page": "https://anyplot.ai/confusion-matrix/javascript/highcharts",
  "hub": "https://anyplot.ai/confusion-matrix",
  "code_json": "https://api.anyplot.ai/specs/confusion-matrix/highcharts/code",
  "spec_json": "https://api.anyplot.ai/specs/confusion-matrix",
  "render_light_png": "https://storage.googleapis.com/anyplot-images/plots/confusion-matrix/javascript/highcharts/plot-light.png",
  "render_dark_png": "https://storage.googleapis.com/anyplot-images/plots/confusion-matrix/javascript/highcharts/plot-dark.png",
  "interactive_light_html": "https://storage.googleapis.com/anyplot-images/plots/confusion-matrix/javascript/highcharts/plot-light.html",
  "interactive_dark_html": "https://storage.googleapis.com/anyplot-images/plots/confusion-matrix/javascript/highcharts/plot-dark.html",
  "quality_score": 91.0,
  "license": "MIT",
  "guide": "https://anyplot.ai/llms.txt"
}
Part of Confusion Matrix Heatmap on anyplot.ai.