The same plot in 14 other libraries — JavaScript: Chart.js, Apache ECharts, Highcharts, MUI X Charts; Python: Altair, Bokeh, lets-plot, Matplotlib, Plotly, plotnine, Pygal, Seaborn; R: ggplot2; Julia: Makie.jl. Compare all 15 side by side: Confusion Matrix Heatmap in Python, R, Julia and JavaScript.
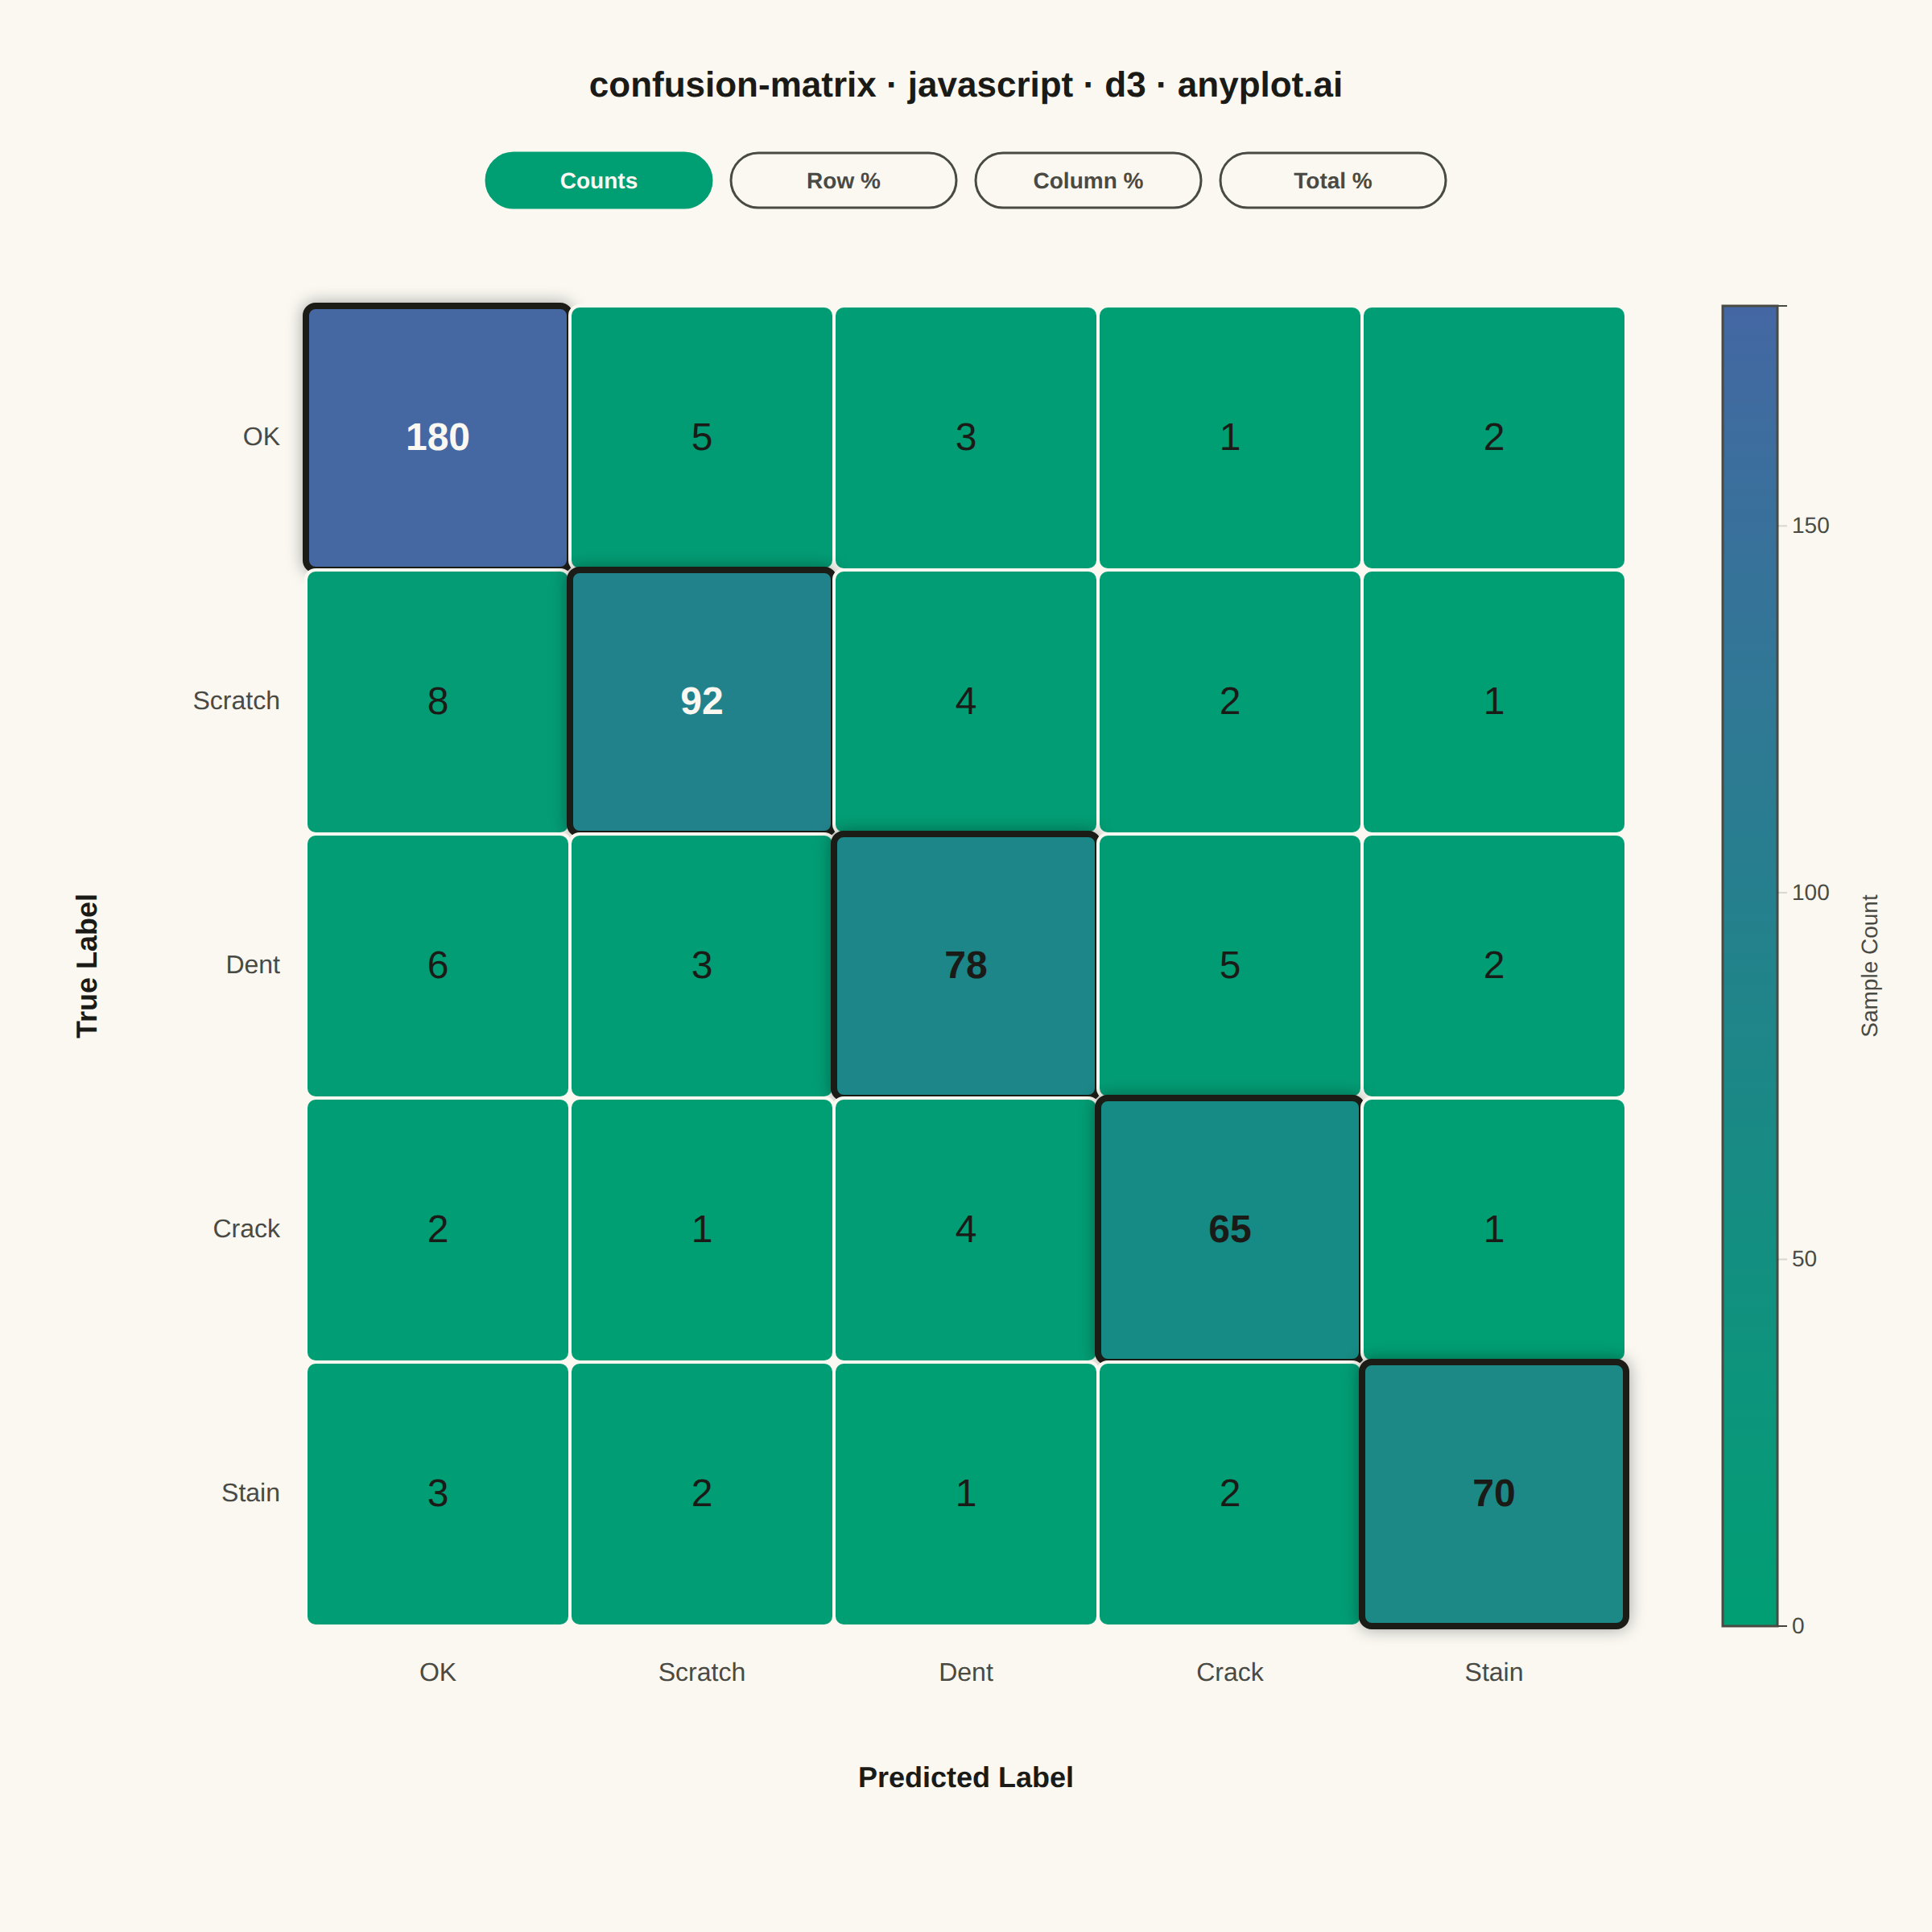
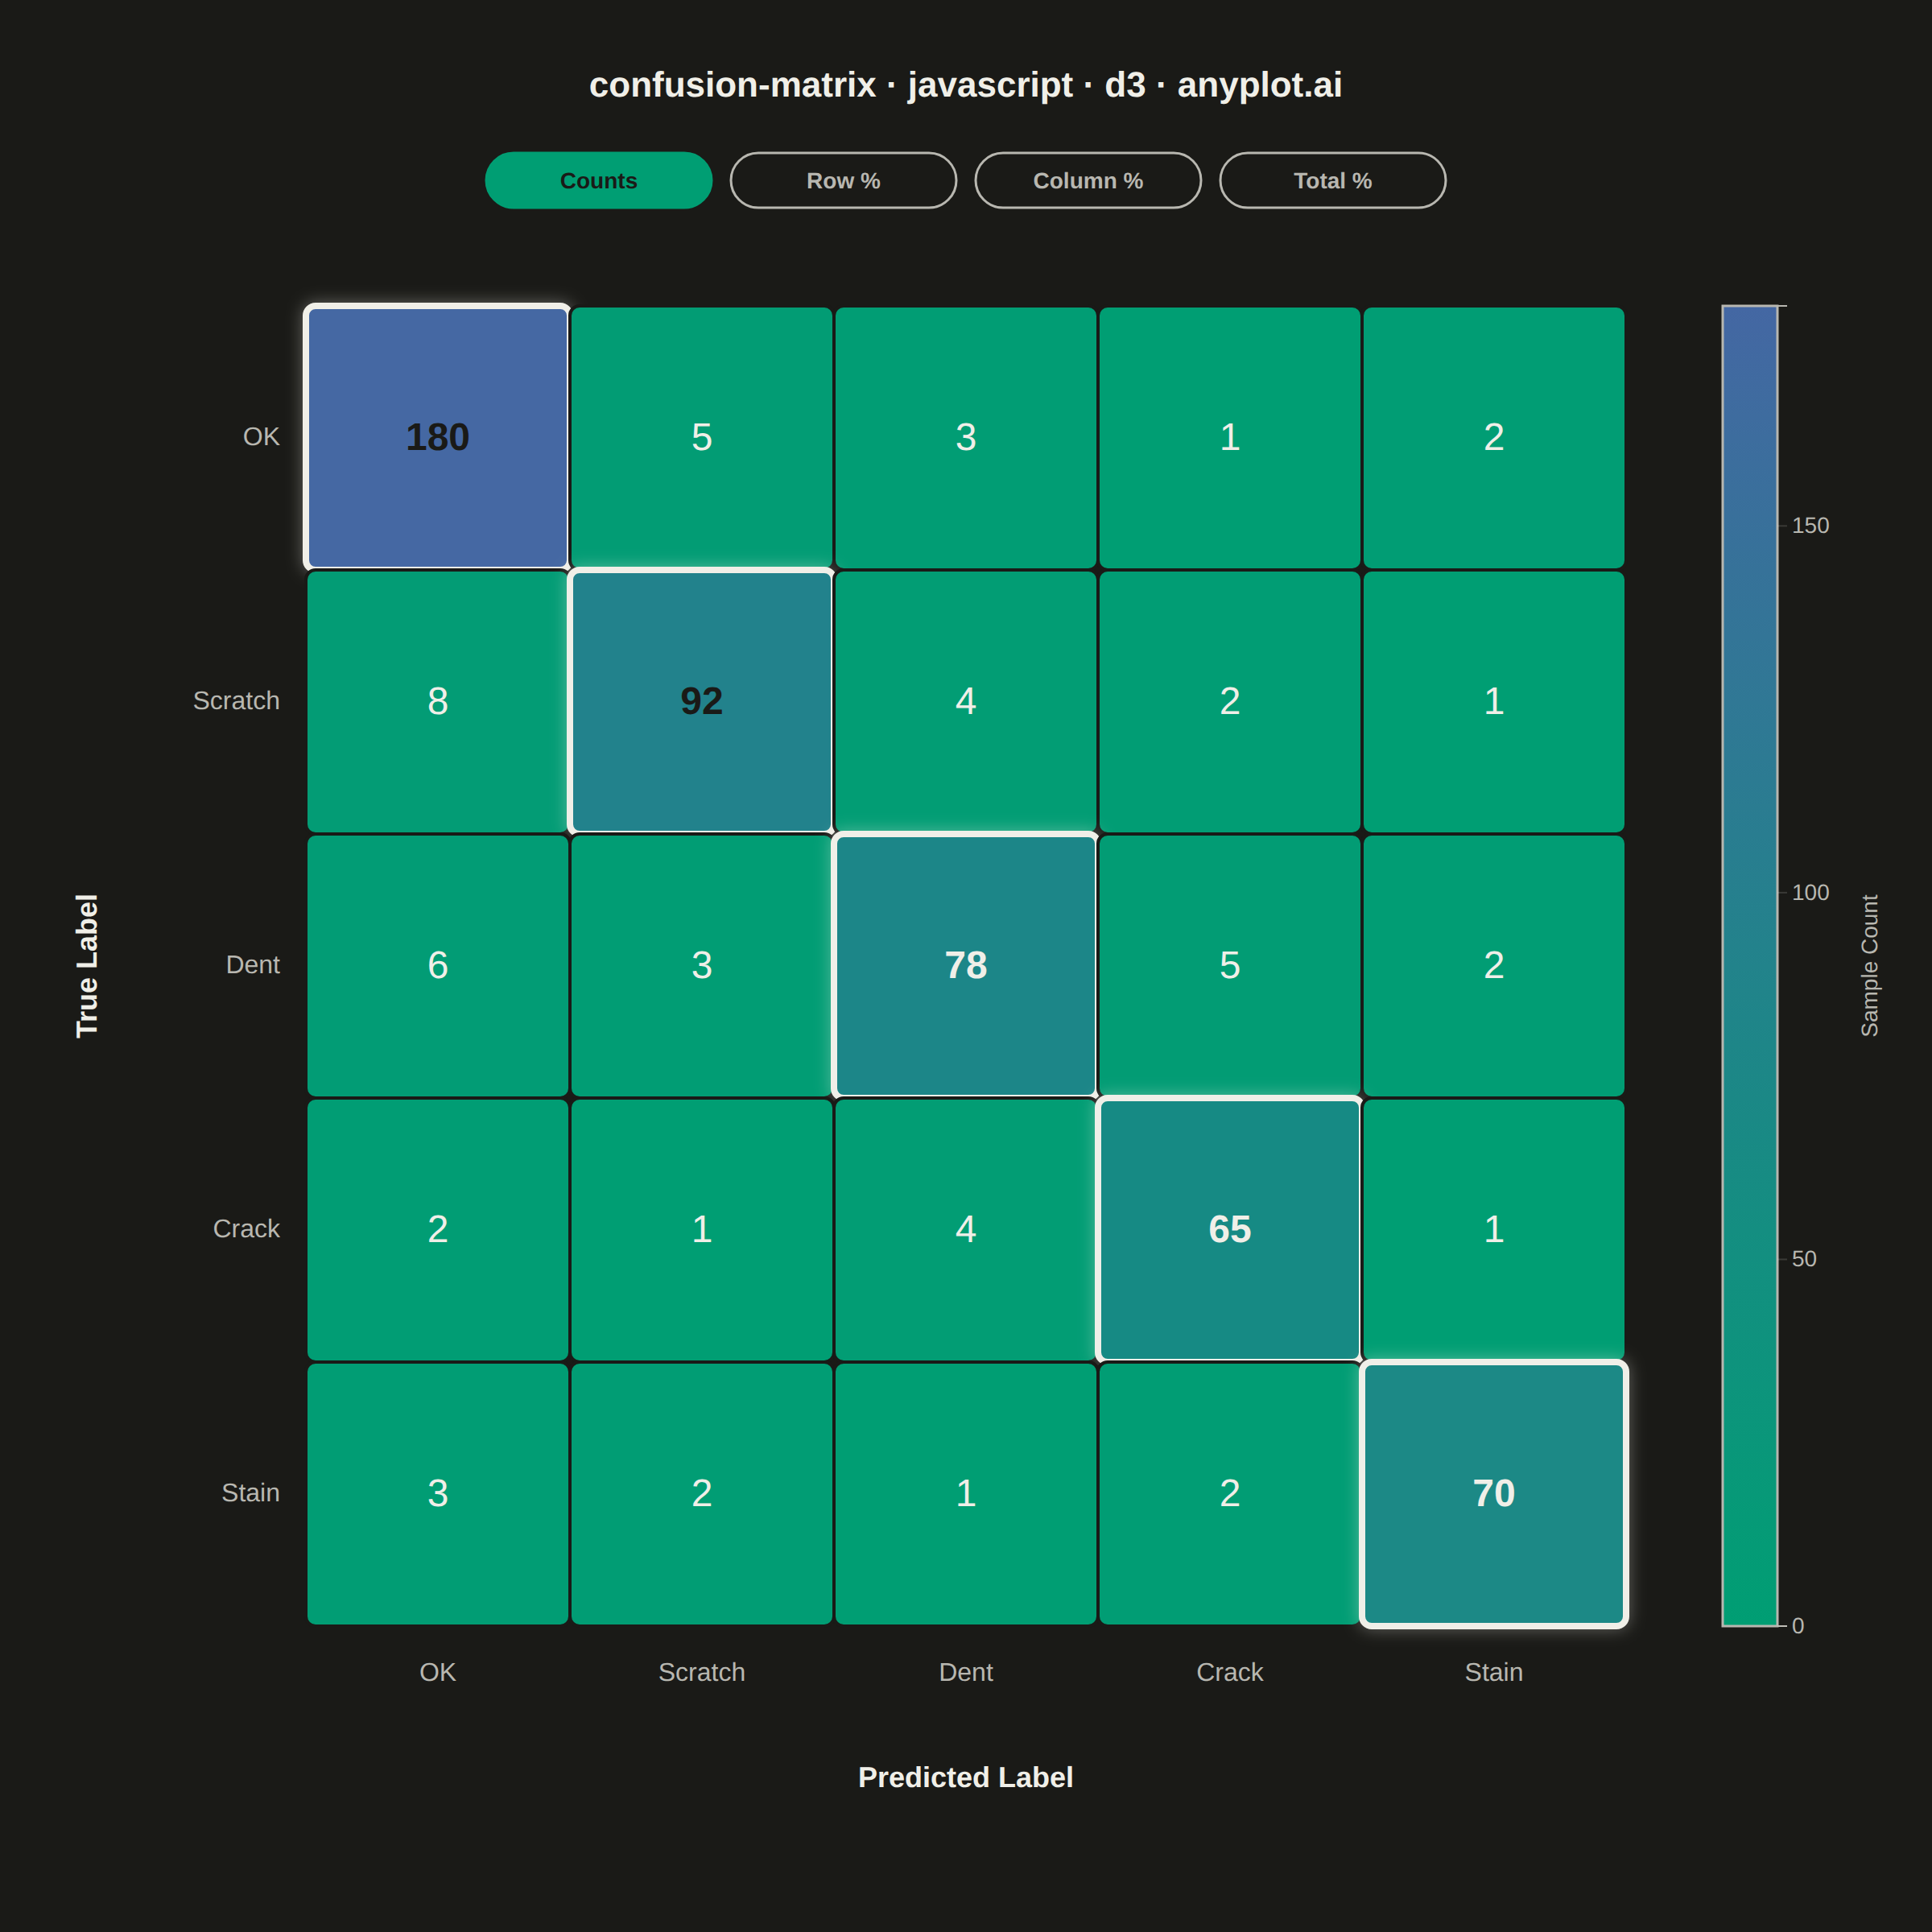
A specialized heatmap visualization for evaluating classification model performance, displaying the counts or proportions of predicted vs actual class labels. The confusion matrix reveals true positives, false positives, true negatives, and false negatives at a glance, making it essential for understanding model behavior, identifying class imbalances, and diagnosing specific misclassification patterns.
// anyplot.ai
// confusion-matrix: Confusion Matrix Heatmap
// Library: d3 7.9.0 | JavaScript 22.23.2
// Quality: 93/100 | Created: 2026-09-04

//# anyplot-orientation: square
const t = window.ANYPLOT_TOKENS;
const { width, height } = window.ANYPLOT_SIZE;

// --- Data (quality-control defect classifier, in-memory & deterministic) ---
const classNames = ["OK", "Scratch", "Dent", "Crack", "Stain"];
const confusionMatrix = [
  [180, 5, 3, 1, 2],
  [8, 92, 4, 2, 1],
  [6, 3, 78, 5, 2],
  [2, 1, 4, 65, 1],
  [3, 2, 1, 2, 70],
];
const n = classNames.length;
const rowSums = confusionMatrix.map((row) => d3.sum(row));
const colSums = classNames.map((_, col) => d3.sum(confusionMatrix.map((row) => row[col])));
const totalSum = d3.sum(confusionMatrix.flat());

// --- Normalization modes (spec asks for none / by-row / by-column / by-total) ----
const modes = {
  raw: {
    label: "Counts",
    axisLabel: "Sample Count",
    value: (r, c) => confusionMatrix[r][c],
    format: (v) => `${v}`,
    tickFormat: d3.format("d"),
  },
  row: {
    label: "Row %",
    axisLabel: "Recall (% of true class)",
    value: (r, c) => (confusionMatrix[r][c] / rowSums[r]) * 100,
    format: (v) => `${v.toFixed(1)}%`,
    tickFormat: (v) => `${v}%`,
  },
  col: {
    label: "Column %",
    axisLabel: "Precision (% of predicted class)",
    value: (r, c) => (confusionMatrix[r][c] / colSums[c]) * 100,
    format: (v) => `${v.toFixed(1)}%`,
    tickFormat: (v) => `${v}%`,
  },
  total: {
    label: "Total %",
    axisLabel: "Share of Total (%)",
    value: (r, c) => (confusionMatrix[r][c] / totalSum) * 100,
    format: (v) => `${v.toFixed(1)}%`,
    tickFormat: (v) => `${v}%`,
  },
};
const modeOrder = ["raw", "row", "col", "total"];
let activeMode = "raw";

function flatCellsFor(modeKey) {
  const cellValue = modes[modeKey].value;
  const cells = [];
  for (let row = 0; row < n; row++) {
    for (let col = 0; col < n; col++) {
      cells.push({ row, col, isDiagonal: row === col, value: cellValue(row, col) });
    }
  }
  return cells;
}

// --- Layout ------------------------------------------------------------
const margin = { top: 150, right: 190, bottom: 150, left: 190 };
const availW = width - margin.left - margin.right;
const availH = height - margin.top - margin.bottom;
const gridSize = Math.min(availW, availH);
const gridLeft = margin.left + (availW - gridSize) / 2;
const gridTop = margin.top + (availH - gridSize) / 2;
const cell = gridSize / n;

// --- SVG mount -------------------------------------------------------------
const svg = d3.select("#container").append("svg").attr("width", width).attr("height", height);
const defs = svg.append("defs");

// Subtle glow on the diagonal (correct-prediction) cells for a stronger focal point.
const glow = defs
  .append("filter")
  .attr("id", "diagonal-glow")
  .attr("x", "-50%")
  .attr("y", "-50%")
  .attr("width", "200%")
  .attr("height", "200%");
glow
  .append("feDropShadow")
  .attr("dx", 0)
  .attr("dy", 0)
  .attr("stdDeviation", 5)
  .attr("flood-color", t.ink)
  .attr("flood-opacity", 0.35);

const g = svg.append("g").attr("transform", `translate(${gridLeft},${gridTop})`);
const cellsG = g.append("g").attr("class", "cells");
const labelsG = g.append("g").attr("class", "labels");

// --- Colorbar shell (updated per mode by renderMatrix) ----------------------
const barWidth = 34;
const barX = gridLeft + gridSize + 60;
const barY = gridTop;
const gradient = defs
  .append("linearGradient")
  .attr("id", "confusion-seq-gradient")
  .attr("x1", "0%")
  .attr("x2", "0%")
  .attr("y1", "100%")
  .attr("y2", "0%");
svg
  .append("rect")
  .attr("x", barX)
  .attr("y", barY)
  .attr("width", barWidth)
  .attr("height", gridSize)
  .attr("fill", "url(#confusion-seq-gradient)")
  .attr("stroke", t.inkSoft)
  .attr("stroke-width", 1.5);
const barAxisG = svg.append("g").attr("transform", `translate(${barX + barWidth},0)`);
const barAxisLabel = svg
  .append("text")
  .attr("transform", `translate(${barX + barWidth + 62}, ${barY + gridSize / 2}) rotate(-90)`)
  .attr("text-anchor", "middle")
  .attr("fill", t.inkSoft)
  .style("font-size", "14px");

// --- Render (data-join driven; re-run on every mode switch) -----------------
function renderMatrix(modeKey) {
  activeMode = modeKey;
  const mode = modes[modeKey];
  const flatCells = flatCellsFor(modeKey);
  const maxValue = d3.max(flatCells, (d) => d.value);
  const color = d3.scaleSequential(d3.interpolateRgbBasis(t.seq)).domain([0, maxValue]);

  cellsG
    .selectAll("rect.cell")
    .data(flatCells, (d) => `${d.row}-${d.col}`)
    .join("rect")
    .attr("class", "cell")
    .attr("x", (d) => d.col * cell)
    .attr("y", (d) => d.row * cell)
    .attr("width", cell)
    .attr("height", cell)
    .attr("rx", 6)
    .attr("ry", 6)
    .attr("fill", (d) => color(d.value))
    .attr("stroke", (d) => (d.isDiagonal ? t.ink : t.pageBg))
    .attr("stroke-width", (d) => (d.isDiagonal ? 4 : 2))
    .attr("filter", (d) => (d.isDiagonal ? "url(#diagonal-glow)" : null));

  labelsG
    .selectAll("text.cell-value")
    .data(flatCells, (d) => `${d.row}-${d.col}`)
    .join("text")
    .attr("class", "cell-value")
    .attr("x", (d) => d.col * cell + cell / 2)
    .attr("y", (d) => d.row * cell + cell / 2)
    .attr("text-anchor", "middle")
    .attr("dominant-baseline", "central")
    .attr("fill", (d) => (d.value / maxValue > 0.45 ? t.pageBg : t.ink))
    .style("font-size", "24px")
    .style("font-weight", (d) => (d.isDiagonal ? "700" : "500"))
    .text((d) => mode.format(d.value));

  // Colorbar: gradient stops, axis scale, and axis label follow the active mode.
  const stops = d3.range(0, 1.0001, 0.1);
  gradient
    .selectAll("stop")
    .data(stops)
    .join("stop")
    .attr("offset", (stop) => `${stop * 100}%`)
    .attr("stop-color", (stop) => color(stop * maxValue));

  const barScale = d3.scaleLinear().domain([0, maxValue]).range([barY + gridSize, barY]);
  barAxisG.call(d3.axisRight(barScale).ticks(5).tickFormat(mode.tickFormat));
  barAxisG.selectAll("text").attr("fill", t.inkSoft).style("font-size", "14px");
  barAxisG.selectAll("line").attr("stroke", t.grid);
  barAxisG.select(".domain").attr("stroke", t.inkSoft);
  barAxisLabel.text(mode.axisLabel);

  toggleG
    .select("rect")
    .attr("fill", (d) => (d === activeMode ? t.palette[0] : "none"))
    .attr("stroke", (d) => (d === activeMode ? t.palette[0] : t.inkSoft));
  toggleG
    .select("text")
    .attr("fill", (d) => (d === activeMode ? t.pageBg : t.inkSoft));
}

// --- Axis ticks (categorical class names, data-join, static across modes) ---
g.selectAll(".col-tick")
  .data(classNames)
  .join("text")
  .attr("class", "col-tick")
  .attr("x", (d, i) => i * cell + cell / 2)
  .attr("y", gridSize + 34)
  .attr("text-anchor", "middle")
  .attr("fill", t.inkSoft)
  .style("font-size", "16px")
  .text((d) => d);

g.selectAll(".row-tick")
  .data(classNames)
  .join("text")
  .attr("class", "row-tick")
  .attr("x", -16)
  .attr("y", (d, i) => i * cell + cell / 2)
  .attr("text-anchor", "end")
  .attr("dominant-baseline", "central")
  .attr("fill", t.inkSoft)
  .style("font-size", "16px")
  .text((d) => d);

// --- Axis titles -------------------------------------------------------
svg
  .append("text")
  .attr("x", gridLeft + gridSize / 2)
  .attr("y", gridTop + gridSize + 100)
  .attr("text-anchor", "middle")
  .attr("fill", t.ink)
  .style("font-size", "18px")
  .style("font-weight", "600")
  .text("Predicted Label");

svg
  .append("text")
  .attr("transform", `translate(${gridLeft - 130}, ${gridTop + gridSize / 2}) rotate(-90)`)
  .attr("text-anchor", "middle")
  .attr("fill", t.ink)
  .style("font-size", "18px")
  .style("font-weight", "600")
  .text("True Label");

// --- Normalization toggle (real click handlers; none/row/column/total) ------
const btnWidth = 140;
const btnHeight = 34;
const btnGap = 12;
const toggleTotalWidth = modeOrder.length * btnWidth + (modeOrder.length - 1) * btnGap;
const toggleX = (width - toggleTotalWidth) / 2;
const toggleY = 95;

const toggleG = svg
  .selectAll(".toggle-btn")
  .data(modeOrder)
  .join("g")
  .attr("class", "toggle-btn")
  .attr("transform", (d, i) => `translate(${toggleX + i * (btnWidth + btnGap)},${toggleY})`)
  .style("cursor", "pointer")
  .on("click", (event, d) => renderMatrix(d));

toggleG
  .append("rect")
  .attr("width", btnWidth)
  .attr("height", btnHeight)
  .attr("rx", 17)
  .attr("ry", 17)
  .attr("stroke-width", 1.5);

toggleG
  .append("text")
  .attr("x", btnWidth / 2)
  .attr("y", btnHeight / 2)
  .attr("text-anchor", "middle")
  .attr("dominant-baseline", "central")
  .style("font-size", "14px")
  .style("font-weight", "600")
  .text((d) => modes[d].label);

// --- Title -------------------------------------------------------------
svg
  .append("text")
  .attr("x", width / 2)
  .attr("y", 60)
  .attr("text-anchor", "middle")
  .attr("fill", t.ink)
  .style("font-size", "22px")
  .style("font-weight", "600")
  .text("confusion-matrix · javascript · d3 · anyplot.ai");

// Default view: raw counts (matches the spec's "none" normalization mode).
renderMatrix("raw");
Runnable source as JSON, for any HTTP client: https://api.anyplot.ai/specs/confusion-matrix/d3/code. Any spec id and library id listed in llms-full.txt fit the same URL shape; every URL below is complete and callable.
{
  "spec_id": "confusion-matrix",
  "language": "javascript",
  "library": "d3",
  "page": "https://anyplot.ai/confusion-matrix/javascript/d3",
  "hub": "https://anyplot.ai/confusion-matrix",
  "code_json": "https://api.anyplot.ai/specs/confusion-matrix/d3/code",
  "spec_json": "https://api.anyplot.ai/specs/confusion-matrix",
  "render_light_png": "https://storage.googleapis.com/anyplot-images/plots/confusion-matrix/javascript/d3/plot-light.png",
  "render_dark_png": "https://storage.googleapis.com/anyplot-images/plots/confusion-matrix/javascript/d3/plot-dark.png",
  "interactive_light_html": "https://storage.googleapis.com/anyplot-images/plots/confusion-matrix/javascript/d3/plot-light.html",
  "interactive_dark_html": "https://storage.googleapis.com/anyplot-images/plots/confusion-matrix/javascript/d3/plot-dark.html",
  "quality_score": 93.0,
  "license": "MIT",
  "guide": "https://anyplot.ai/llms.txt"
}
Part of Confusion Matrix Heatmap on anyplot.ai.