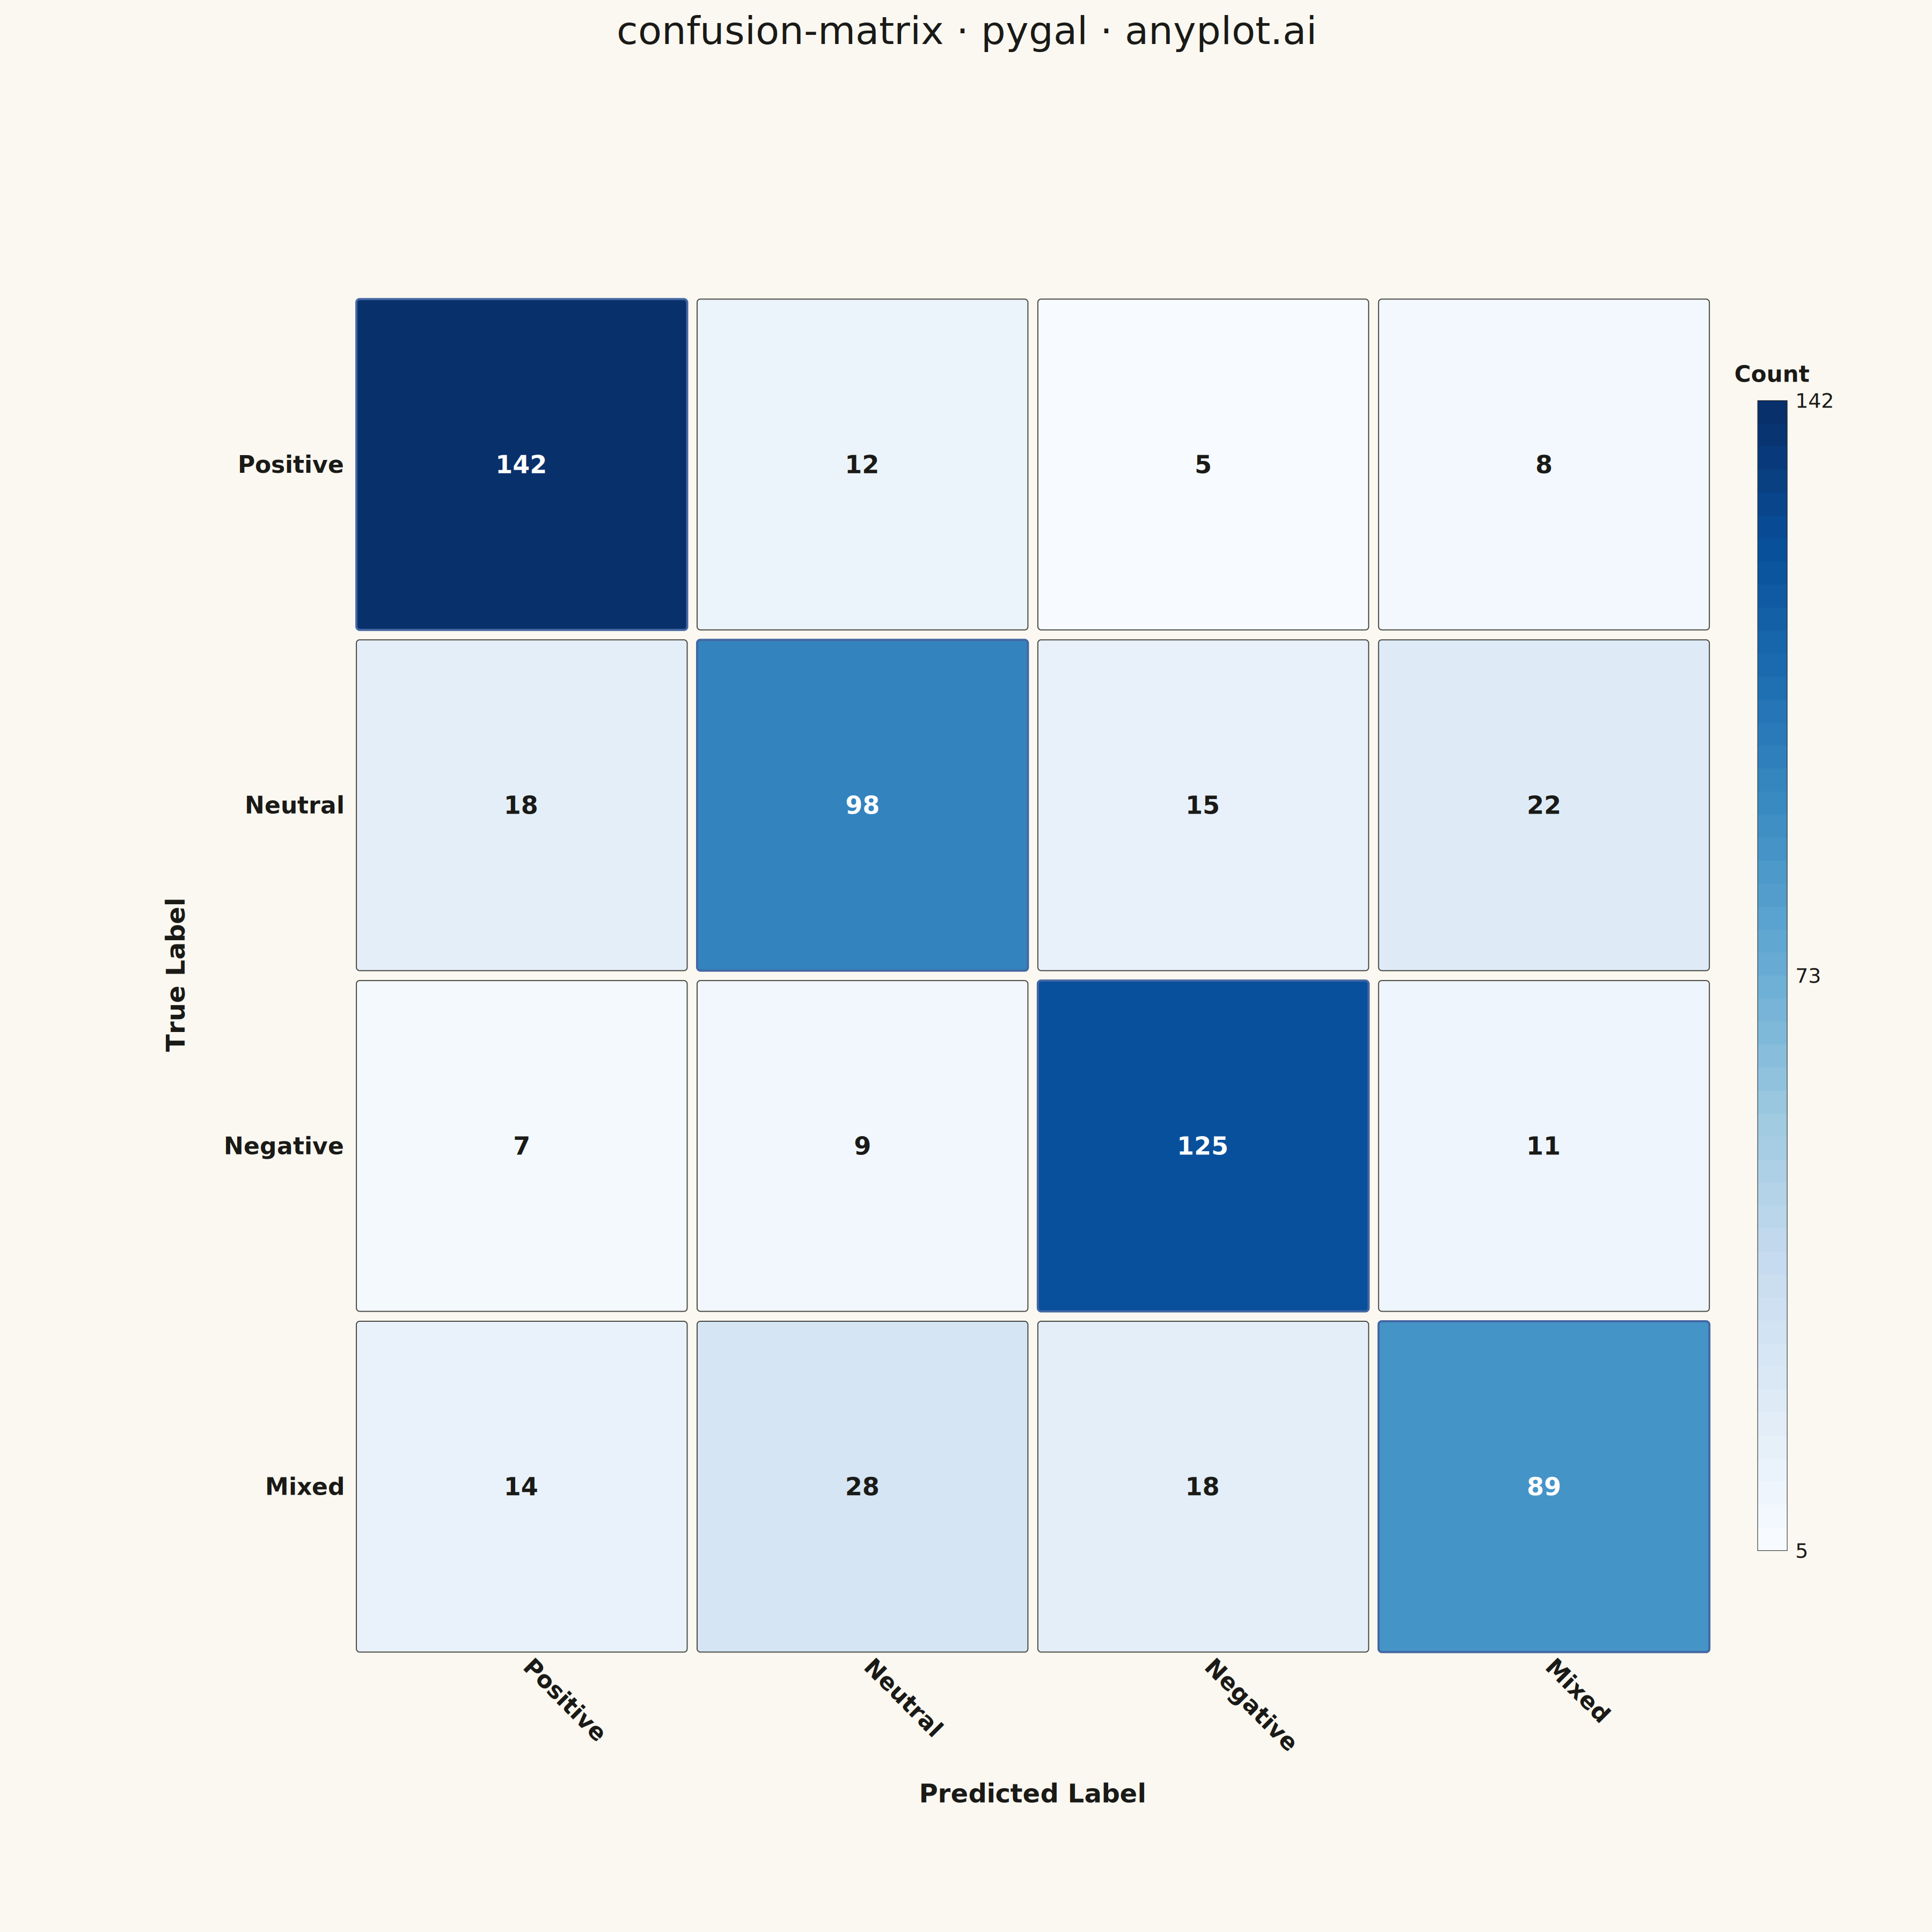
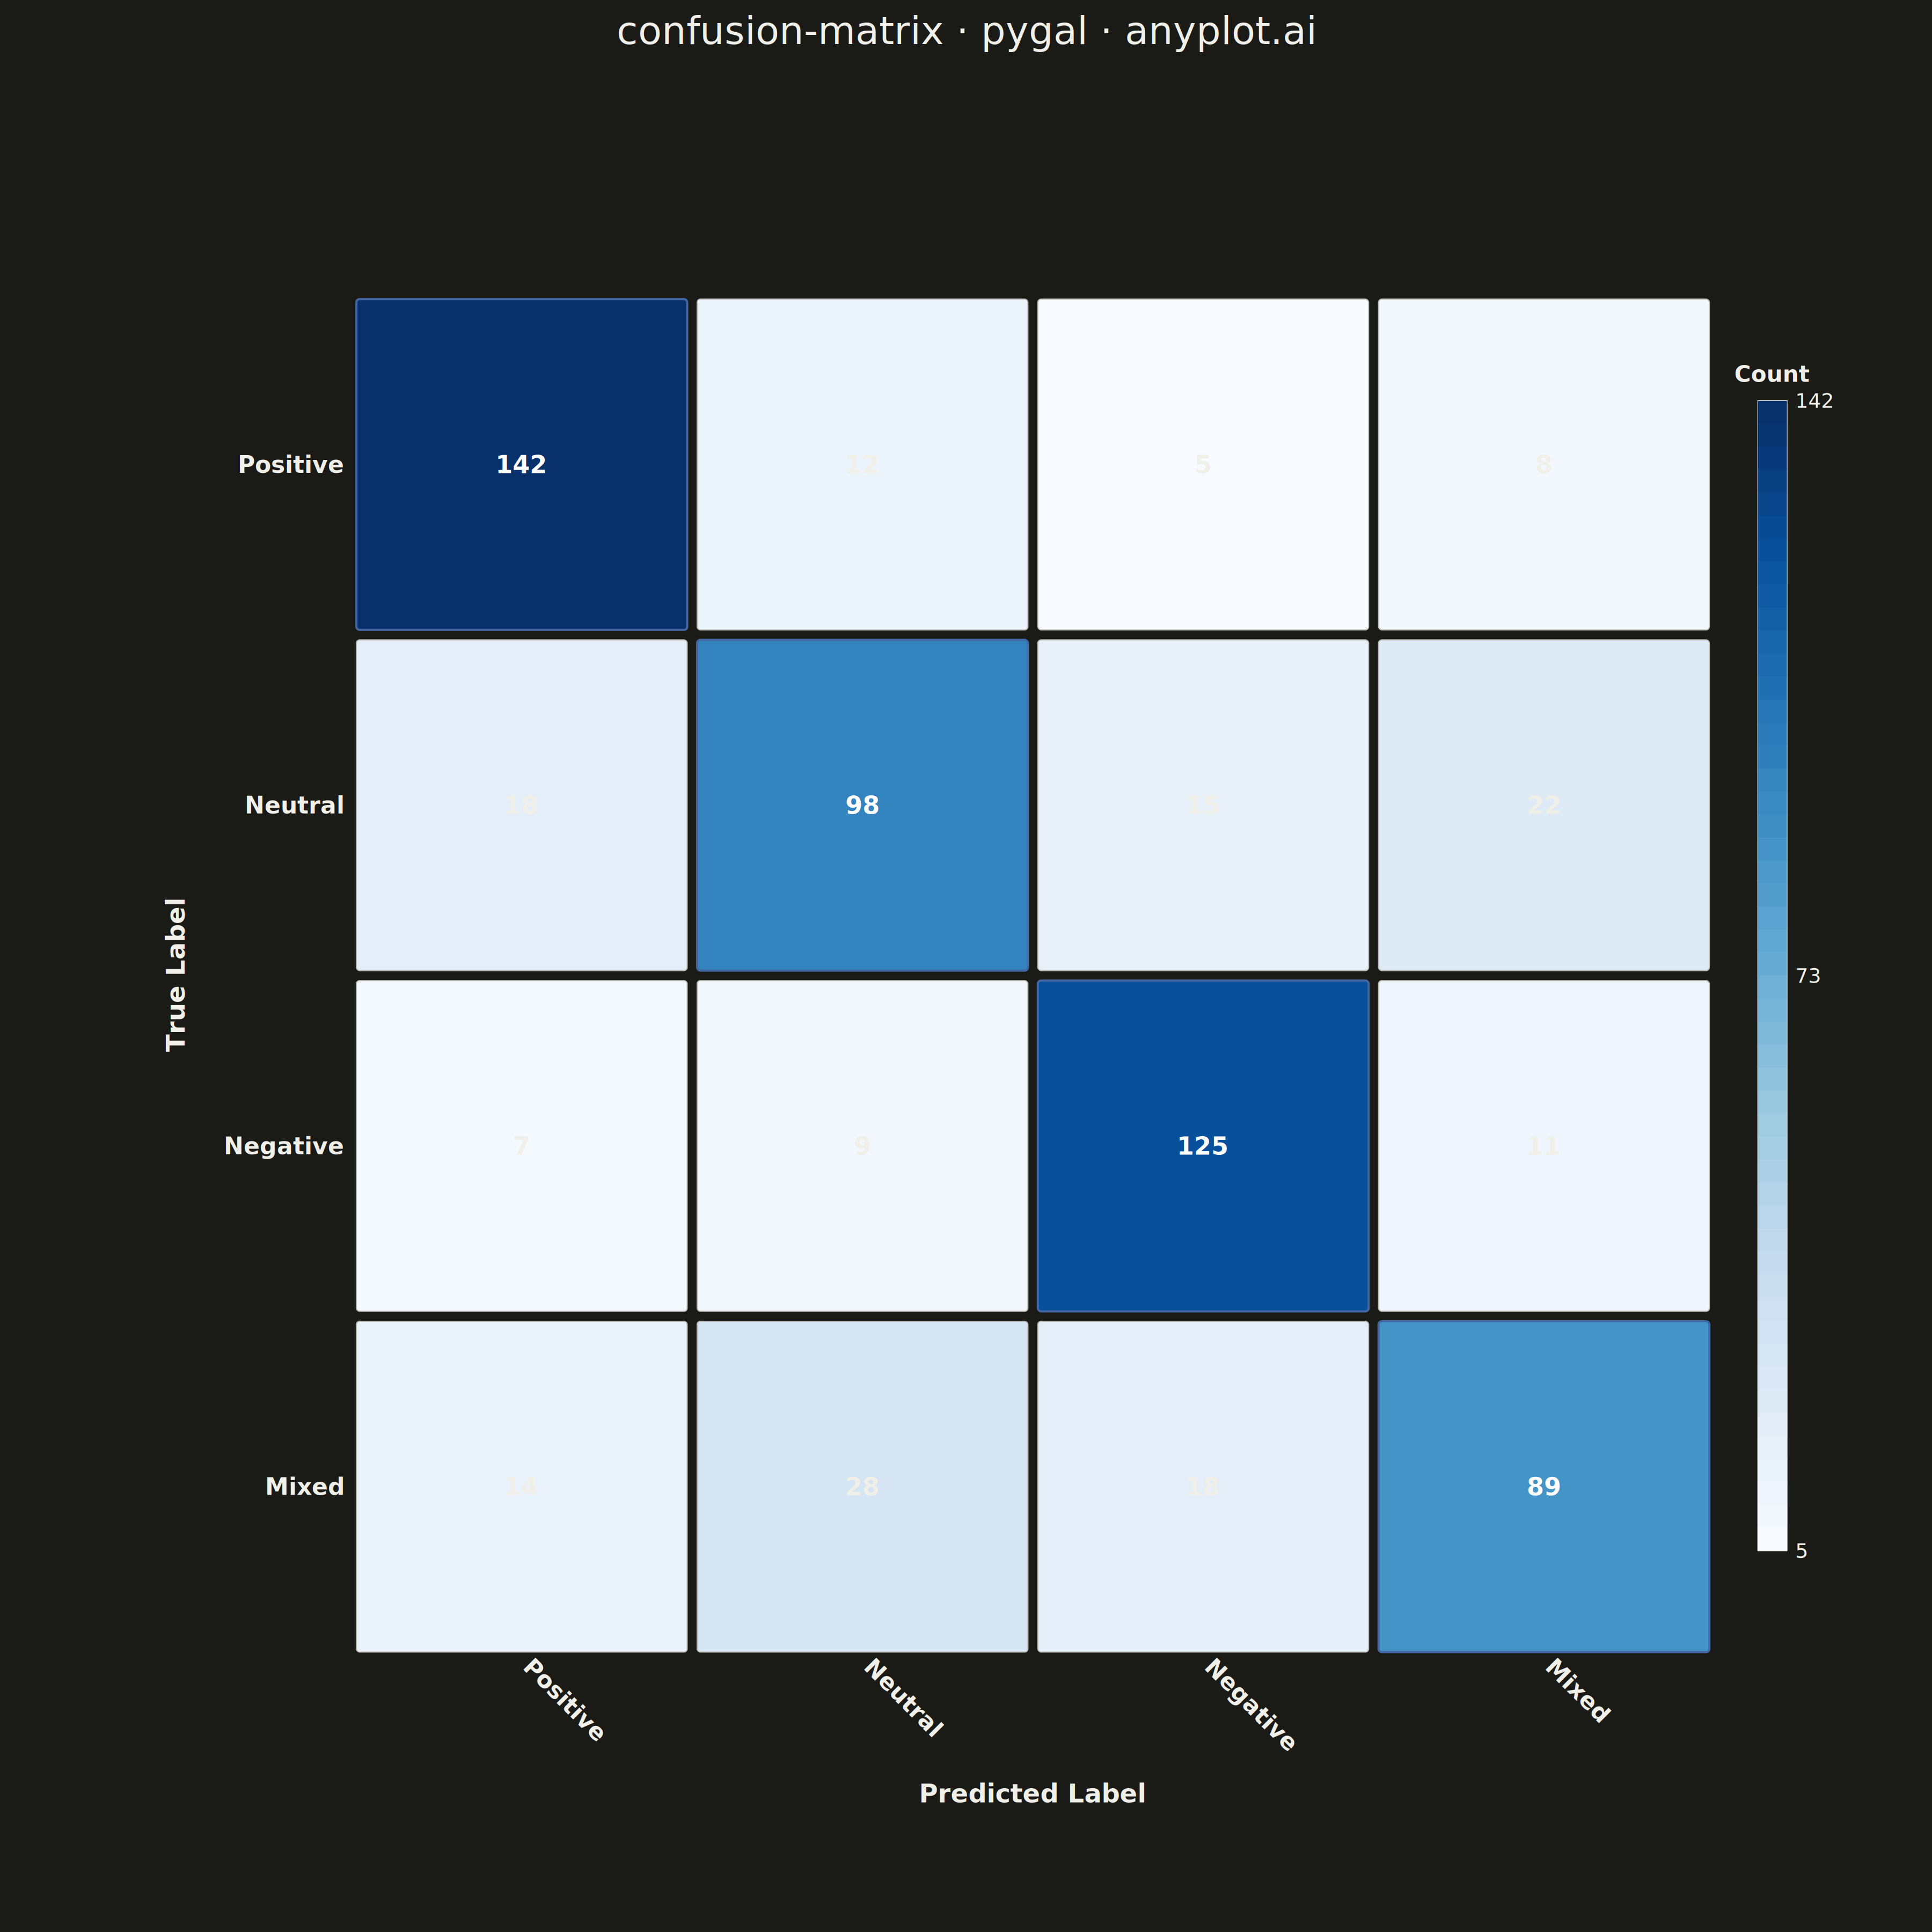
A specialized heatmap visualization for evaluating classification model performance, displaying the counts or proportions of predicted vs actual class labels. The confusion matrix reveals true positives, false positives, true negatives, and false negatives at a glance, making it essential for understanding model behavior, identifying class imbalances, and diagnosing specific misclassification patterns.
""" anyplot.ai
confusion-matrix: Confusion Matrix Heatmap
Library: pygal 3.1.0 | Python 3.13.13
Quality: 93/100 | Updated: 2026-05-09
"""

import os
import sys

import numpy as np


_cwd = sys.path[0] if sys.path[0] else "."
if _cwd in sys.path:
    sys.path.remove(_cwd)

from pygal.graph.graph import Graph
from pygal.style import Style


sys.path.insert(0, _cwd)

THEME = os.getenv("ANYPLOT_THEME", "light")
PAGE_BG = "#FAF8F1" if THEME == "light" else "#1A1A17"
INK = "#1A1A17" if THEME == "light" else "#F0EFE8"
INK_SOFT = "#4A4A44" if THEME == "light" else "#B8B7B0"
INK_MUTED = "#6B6A63" if THEME == "light" else "#A8A79F"


class ConfusionMatrixChart(Graph):
    """Custom Confusion Matrix Chart for pygal - displays classification results."""

    def __init__(self, *args, **kwargs):
        self.matrix_data = kwargs.pop("matrix_data", [])
        self.class_labels = kwargs.pop("class_labels", [])
        self.colormap = kwargs.pop("colormap", [])
        self.show_values = kwargs.pop("show_values", True)
        self.x_axis_title = kwargs.pop("x_axis_title", "Predicted Label")
        self.y_axis_title = kwargs.pop("y_axis_title", "True Label")
        super().__init__(*args, **kwargs)

    def _interpolate_color(self, value, min_val, max_val):
        """Interpolate color for smooth gradient."""
        if max_val == min_val:
            return self.colormap[-1]

        normalized = (value - min_val) / (max_val - min_val)
        normalized = max(0, min(1, normalized))

        pos = normalized * (len(self.colormap) - 1)
        idx1 = int(pos)
        idx2 = min(idx1 + 1, len(self.colormap) - 1)
        frac = pos - idx1

        c1 = self.colormap[idx1]
        c2 = self.colormap[idx2]

        r1, g1, b1 = int(c1[1:3], 16), int(c1[3:5], 16), int(c1[5:7], 16)
        r2, g2, b2 = int(c2[1:3], 16), int(c2[3:5], 16), int(c2[5:7], 16)

        r = int(r1 + (r2 - r1) * frac)
        g = int(g1 + (g2 - g1) * frac)
        b = int(b1 + (b2 - b1) * frac)

        return f"#{r:02x}{g:02x}{b:02x}"

    def _get_text_color(self, bg_color):
        """Get contrasting text color based on background brightness."""
        r, g, b = int(bg_color[1:3], 16), int(bg_color[3:5], 16), int(bg_color[5:7], 16)
        brightness = (r * 299 + g * 587 + b * 114) / 1000
        return "#FFFFFF" if brightness < 140 else INK

    def _plot(self):
        """Draw the confusion matrix."""
        if not self.matrix_data:
            return

        n_classes = len(self.matrix_data)

        all_values = [v for row in self.matrix_data for v in row]
        min_val = min(all_values)
        max_val = max(all_values)

        plot_width = self.view.width
        plot_height = self.view.height

        label_margin_left = 400
        label_margin_bottom = 350
        label_margin_top = 80
        label_margin_right = 280

        available_width = plot_width - label_margin_left - label_margin_right
        available_height = plot_height - label_margin_bottom - label_margin_top

        cell_size = min(available_width, available_height) / n_classes * 0.92
        gap = cell_size * 0.03

        grid_size = n_classes * (cell_size + gap) - gap

        x_offset = self.view.x(0) + label_margin_left + (available_width - grid_size) / 2
        y_offset = self.view.y(n_classes) + label_margin_top + (available_height - grid_size) / 2

        plot_node = self.nodes["plot"]
        cm_group = self.svg.node(plot_node, class_="confusion-matrix")

        y_title_size = 48
        y_title_x = x_offset - 320
        y_title_y = y_offset + grid_size / 2
        text_node = self.svg.node(cm_group, "text", x=y_title_x, y=y_title_y)
        text_node.set("text-anchor", "middle")
        text_node.set("fill", INK)
        text_node.set("style", f"font-size:{y_title_size}px;font-weight:bold;font-family:sans-serif")
        text_node.set("transform", f"rotate(-90, {y_title_x}, {y_title_y})")
        text_node.text = self.y_axis_title

        x_title_size = 48
        x_title_x = x_offset + grid_size / 2
        x_title_y = y_offset + grid_size + 280
        text_node = self.svg.node(cm_group, "text", x=x_title_x, y=x_title_y)
        text_node.set("text-anchor", "middle")
        text_node.set("fill", INK)
        text_node.set("style", f"font-size:{x_title_size}px;font-weight:bold;font-family:sans-serif")
        text_node.text = self.x_axis_title

        row_font_size = min(44, int(cell_size * 0.45))
        for i, label in enumerate(self.class_labels):
            y = y_offset + i * (cell_size + gap) + cell_size / 2
            text_node = self.svg.node(cm_group, "text", x=x_offset - 25, y=y + row_font_size * 0.35)
            text_node.set("text-anchor", "end")
            text_node.set("fill", INK)
            text_node.set("style", f"font-size:{row_font_size}px;font-weight:600;font-family:sans-serif")
            text_node.text = label

        col_font_size = min(44, int(cell_size * 0.45))
        for j, label in enumerate(self.class_labels):
            x = x_offset + j * (cell_size + gap) + cell_size / 2
            y = y_offset + grid_size + 30
            text_node = self.svg.node(cm_group, "text", x=x, y=y)
            text_node.set("text-anchor", "start")
            text_node.set("fill", INK)
            text_node.set("style", f"font-size:{col_font_size}px;font-weight:600;font-family:sans-serif")
            text_node.set("transform", f"rotate(45, {x}, {y})")
            text_node.text = label

        value_font_size = min(46, int(cell_size * 0.35))
        for i in range(n_classes):
            for j in range(n_classes):
                value = self.matrix_data[i][j]
                color = self._interpolate_color(value, min_val, max_val)
                text_color = self._get_text_color(color)

                x = x_offset + j * (cell_size + gap)
                y = y_offset + i * (cell_size + gap)

                stroke_color = "#4467A3" if i == j else INK_SOFT
                stroke_width = "4" if i == j else "2"

                rect = self.svg.node(cm_group, "rect", x=x, y=y, width=cell_size, height=cell_size, rx=6, ry=6)
                rect.set("fill", color)
                rect.set("stroke", stroke_color)
                rect.set("stroke-width", stroke_width)

                if self.show_values:
                    text_x = x + cell_size / 2
                    text_y = y + cell_size / 2 + value_font_size * 0.35

                    text_node = self.svg.node(cm_group, "text", x=text_x, y=text_y)
                    text_node.set("text-anchor", "middle")
                    text_node.set("fill", text_color)
                    text_node.set("style", f"font-size:{value_font_size}px;font-weight:bold;font-family:sans-serif")
                    text_node.text = str(int(value))

        colorbar_width = 55
        colorbar_height = grid_size * 0.85
        colorbar_x = x_offset + grid_size + 90
        colorbar_y = y_offset + (grid_size - colorbar_height) / 2

        n_segments = 50
        segment_height = colorbar_height / n_segments
        for seg_i in range(n_segments):
            seg_value = min_val + (max_val - min_val) * (n_segments - 1 - seg_i) / (n_segments - 1)
            seg_color = self._interpolate_color(seg_value, min_val, max_val)
            seg_y = colorbar_y + seg_i * segment_height

            self.svg.node(
                cm_group, "rect", x=colorbar_x, y=seg_y, width=colorbar_width, height=segment_height + 1, fill=seg_color
            )

        self.svg.node(
            cm_group,
            "rect",
            x=colorbar_x,
            y=colorbar_y,
            width=colorbar_width,
            height=colorbar_height,
            fill="none",
            stroke=INK,
            stroke_width="3",
        )

        cb_label_size = 38
        text_node = self.svg.node(
            cm_group, "text", x=colorbar_x + colorbar_width + 15, y=colorbar_y + cb_label_size * 0.35
        )
        text_node.set("fill", INK)
        text_node.set("style", f"font-size:{cb_label_size}px;font-family:sans-serif")
        text_node.text = str(int(max_val))

        mid_y = colorbar_y + colorbar_height / 2
        text_node = self.svg.node(cm_group, "text", x=colorbar_x + colorbar_width + 15, y=mid_y + cb_label_size * 0.35)
        text_node.set("fill", INK)
        text_node.set("style", f"font-size:{cb_label_size}px;font-family:sans-serif")
        text_node.text = str(int((min_val + max_val) / 2))

        text_node = self.svg.node(
            cm_group, "text", x=colorbar_x + colorbar_width + 15, y=colorbar_y + colorbar_height + cb_label_size * 0.35
        )
        text_node.set("fill", INK)
        text_node.set("style", f"font-size:{cb_label_size}px;font-family:sans-serif")
        text_node.text = str(int(min_val))

        cb_title_size = 42
        cb_title_x = colorbar_x + colorbar_width / 2
        cb_title_y = colorbar_y - 35
        text_node = self.svg.node(cm_group, "text", x=cb_title_x, y=cb_title_y)
        text_node.set("text-anchor", "middle")
        text_node.set("fill", INK)
        text_node.set("style", f"font-size:{cb_title_size}px;font-weight:bold;font-family:sans-serif")
        text_node.text = "Count"

    def _compute(self):
        """Compute the box for rendering."""
        n_classes = len(self.matrix_data) if self.matrix_data else 1
        self._box.xmin = 0
        self._box.xmax = n_classes
        self._box.ymin = 0
        self._box.ymax = n_classes


np.random.seed(42)

class_names = ["Positive", "Neutral", "Negative", "Mixed"]
n_classes = len(class_names)

confusion_matrix = [[142, 12, 5, 8], [18, 98, 15, 22], [7, 9, 125, 11], [14, 28, 18, 89]]

blue_colormap = ["#f7fbff", "#deebf7", "#c6dbef", "#9ecae1", "#6baed6", "#4292c6", "#2171b5", "#08519c", "#08306b"]

custom_style = Style(
    background=PAGE_BG,
    plot_background=PAGE_BG,
    foreground=INK,
    foreground_strong=INK,
    foreground_subtle=INK_MUTED,
    colors=("#009E73",),
    title_font_size=72,
    legend_font_size=48,
    label_font_size=44,
    value_font_size=38,
    font_family="sans-serif",
)

chart = ConfusionMatrixChart(
    width=3600,
    height=3600,
    style=custom_style,
    title="confusion-matrix · pygal · anyplot.ai",
    matrix_data=confusion_matrix,
    class_labels=class_names,
    colormap=blue_colormap,
    show_values=True,
    x_axis_title="Predicted Label",
    y_axis_title="True Label",
    show_legend=False,
    margin=120,
    margin_top=200,
    margin_bottom=100,
    show_x_labels=False,
    show_y_labels=False,
)

chart.add("", [0])

chart.render_to_file(f"plot-{THEME}.svg")
chart.render_to_png(f"plot-{THEME}.png")

html_content = f"""<!DOCTYPE html>
<html>
<head>
    <meta charset="utf-8">
    <title>confusion-matrix - pygal</title>
    <style>
        body {{ margin: 0; display: flex; justify-content: center; align-items: center; min-height: 100vh; background: {PAGE_BG}; }}
        .chart {{ max-width: 100%; height: auto; }}
    </style>
</head>
<body>
    <figure class="chart">
        {chart.render(is_unicode=True)}
    </figure>
</body>
</html>
"""

with open(f"plot-{THEME}.html", "w", encoding="utf-8") as f:
    f.write(html_content)
Runnable source as JSON, for any HTTP client: https://api.anyplot.ai/specs/confusion-matrix/pygal/code. Any spec id and library id listed in llms-full.txt fit the same URL shape; every URL below is complete and callable.
{
  "spec_id": "confusion-matrix",
  "language": "python",
  "library": "pygal",
  "page": "https://anyplot.ai/confusion-matrix/python/pygal",
  "hub": "https://anyplot.ai/confusion-matrix",
  "code_json": "https://api.anyplot.ai/specs/confusion-matrix/pygal/code",
  "spec_json": "https://api.anyplot.ai/specs/confusion-matrix",
  "render_light_png": "https://storage.googleapis.com/anyplot-images/plots/confusion-matrix/python/pygal/plot-light.png",
  "render_dark_png": "https://storage.googleapis.com/anyplot-images/plots/confusion-matrix/python/pygal/plot-dark.png",
  "interactive_light_html": "https://storage.googleapis.com/anyplot-images/plots/confusion-matrix/python/pygal/plot-light.html",
  "interactive_dark_html": "https://storage.googleapis.com/anyplot-images/plots/confusion-matrix/python/pygal/plot-dark.html",
  "quality_score": 93.0,
  "license": "MIT",
  "guide": "https://anyplot.ai/llms.txt"
}
Part of Confusion Matrix Heatmap on anyplot.ai.