The same plot in 14 other libraries — JavaScript: D3.js, Apache ECharts, Highcharts, MUI X Charts; Python: Altair, Bokeh, lets-plot, Matplotlib, Plotly, plotnine, Pygal, Seaborn; R: ggplot2; Julia: Makie.jl. Compare all 15 side by side: Density Contour Plot in Python, R, Julia and JavaScript.
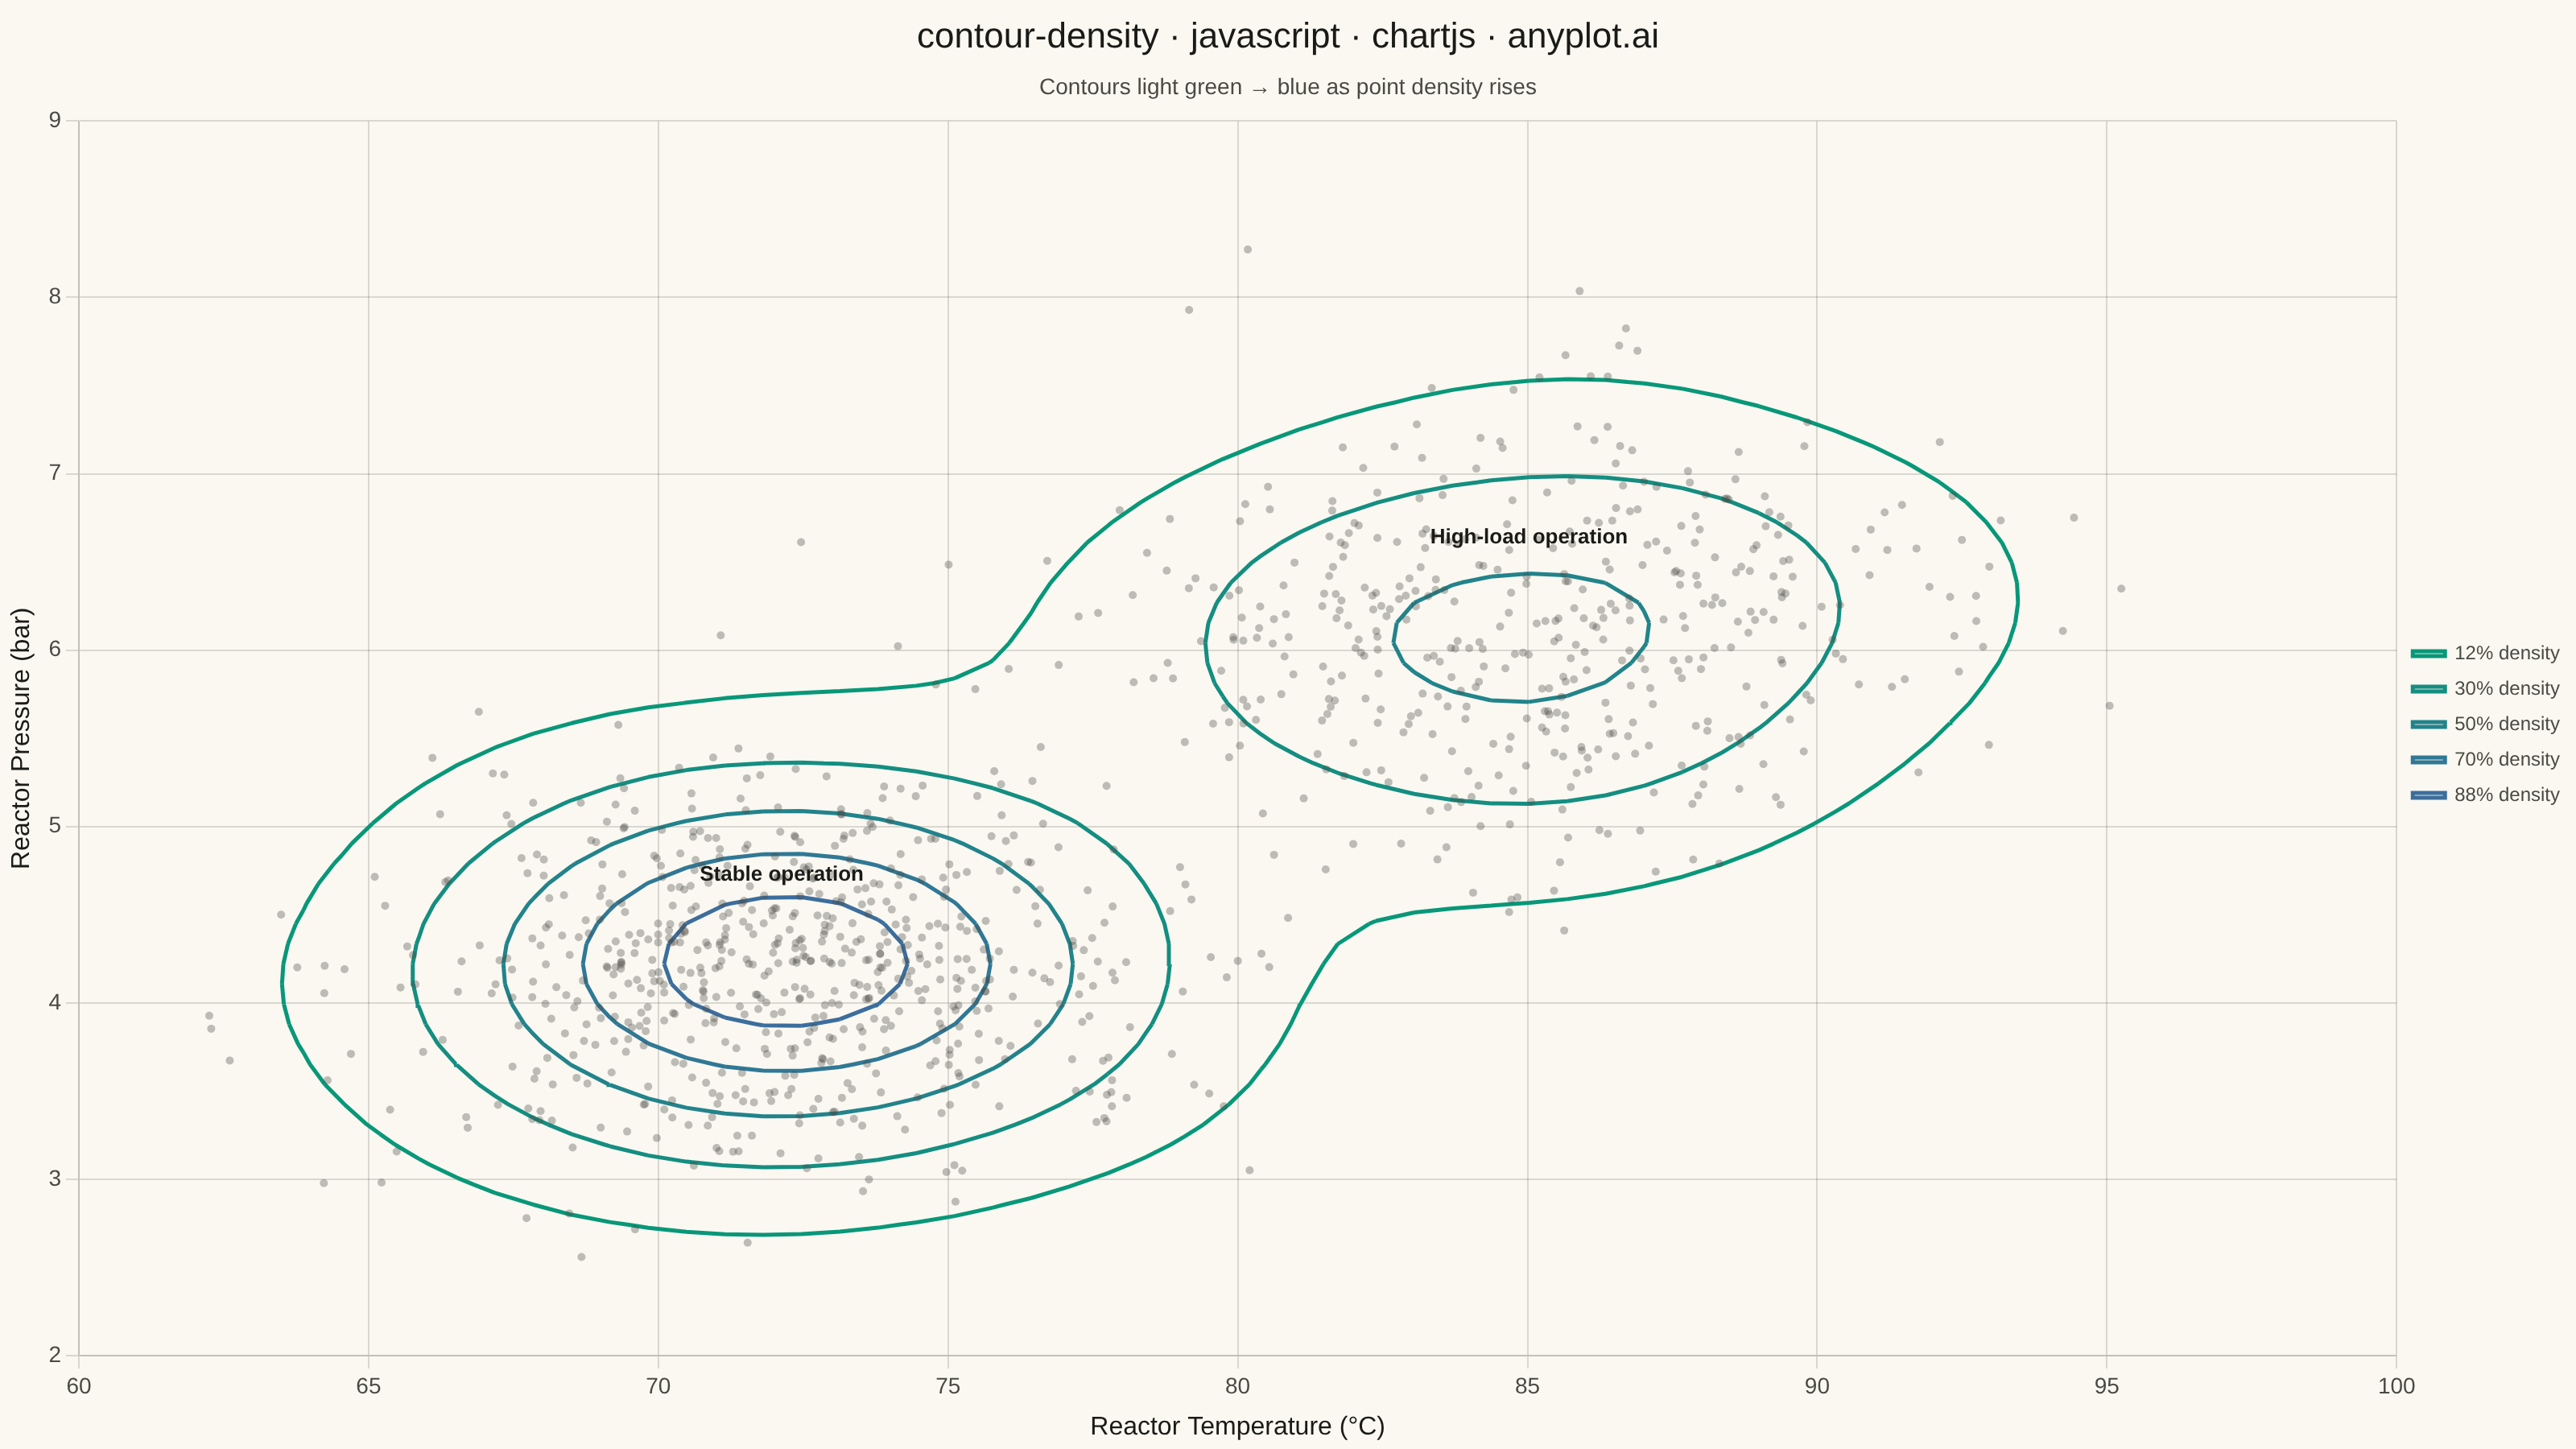
A density contour plot (also known as a 2D KDE contour plot) displays the concentration of points in a 2D scatter plot using contour lines. The contours connect points of equal density, revealing clusters, patterns, and the overall bivariate distribution shape.
// anyplot.ai
// contour-density: Density Contour Plot
// Library: chartjs 4.4.7 | JavaScript 22.23.2
// Quality: 93/100 | Created: 2026-09-04

const t = window.ANYPLOT_TOKENS;

// --- Data: reactor temperature vs. pressure readings, two operating modes ---
let seed = 42;
function lcg() {
  seed = (seed * 1103515245 + 12345) & 0x7fffffff;
  return seed / 0x7fffffff;
}
function gaussian() {
  const u1 = Math.max(lcg(), 1e-9);
  const u2 = lcg();
  return Math.sqrt(-2 * Math.log(u1)) * Math.cos(2 * Math.PI * u2);
}

const stableCount = 650;
const highLoadCount = 450;
const temperature = [];
const pressure = [];
for (let i = 0; i < stableCount; i++) {
  temperature.push(72 + gaussian() * 3.2); // stable operation
  pressure.push(4.2 + gaussian() * 0.55);
}
for (let i = 0; i < highLoadCount; i++) {
  temperature.push(85 + gaussian() * 3.8); // high-load operation
  pressure.push(6.1 + gaussian() * 0.65);
}

// Cluster centroids (sample means), used to place the operating-mode labels.
const mean = (arr) => arr.reduce((s, v) => s + v, 0) / arr.length;
const stableCentroid = {
  x: mean(temperature.slice(0, stableCount)),
  y: mean(pressure.slice(0, stableCount)),
};
const highLoadCentroid = {
  x: mean(temperature.slice(stableCount)),
  y: mean(pressure.slice(stableCount)),
};

// --- Kernel density estimate on a grid --------------------------------------
const xMin = Math.min(...temperature) - 3;
const xMax = Math.max(...temperature) + 3;
const yMin = Math.min(...pressure) - 0.5;
const yMax = Math.max(...pressure) + 0.5;
const hx = (xMax - xMin) / 14;
const hy = (yMax - yMin) / 14;

const nx = 60;
const ny = 60;
const xs = Array.from({ length: nx }, (_, i) => xMin + (i * (xMax - xMin)) / (nx - 1));
const ys = Array.from({ length: ny }, (_, j) => yMin + (j * (yMax - yMin)) / (ny - 1));

const grid = Array.from({ length: ny }, () => new Array(nx).fill(0));
for (let j = 0; j < ny; j++) {
  for (let i = 0; i < nx; i++) {
    let density = 0;
    for (let k = 0; k < temperature.length; k++) {
      const dx = (xs[i] - temperature[k]) / hx;
      const dy = (ys[j] - pressure[k]) / hy;
      density += Math.exp(-0.5 * (dx * dx + dy * dy));
    }
    grid[j][i] = density / temperature.length;
  }
}
const maxDensity = Math.max(...grid.map((row) => Math.max(...row)));

// =============================================================================
// Marching-squares geometry helpers (extract iso-density line segments)
// =============================================================================
function edgeInterp(level, va, pa, vb, pb) {
  const denom = vb - va;
  const frac = denom === 0 ? 0.5 : (level - va) / denom;
  return { x: pa.x + frac * (pb.x - pa.x), y: pa.y + frac * (pb.y - pa.y) };
}

function marchingSquares(level) {
  const segments = [];
  for (let j = 0; j < ny - 1; j++) {
    for (let i = 0; i < nx - 1; i++) {
      const a = grid[j][i]; // bottom-left
      const b = grid[j][i + 1]; // bottom-right
      const c = grid[j + 1][i + 1]; // top-right
      const d = grid[j + 1][i]; // top-left
      let idx = 0;
      if (a > level) idx |= 1;
      if (b > level) idx |= 2;
      if (c > level) idx |= 4;
      if (d > level) idx |= 8;
      if (idx === 0 || idx === 15) continue;

      const bl = { x: xs[i], y: ys[j] };
      const br = { x: xs[i + 1], y: ys[j] };
      const tr = { x: xs[i + 1], y: ys[j + 1] };
      const tl = { x: xs[i], y: ys[j + 1] };
      const bottom = () => edgeInterp(level, a, bl, b, br);
      const right = () => edgeInterp(level, b, br, c, tr);
      const top = () => edgeInterp(level, d, tl, c, tr);
      const left = () => edgeInterp(level, a, bl, d, tl);

      // Standard 16-case marching-squares table (cases 5 and 10 are the
      // ambiguous saddle points, resolved with two crossing segments).
      switch (idx) {
        case 1:
          segments.push([left(), bottom()]);
          break;
        case 2:
          segments.push([bottom(), right()]);
          break;
        case 3:
          segments.push([left(), right()]);
          break;
        case 4:
          segments.push([right(), top()]);
          break;
        case 5:
          segments.push([left(), top()], [bottom(), right()]);
          break;
        case 6:
          segments.push([bottom(), top()]);
          break;
        case 7:
          segments.push([left(), top()]);
          break;
        case 8:
          segments.push([top(), left()]);
          break;
        case 9:
          segments.push([bottom(), top()]);
          break;
        case 10:
          segments.push([left(), bottom()], [right(), top()]);
          break;
        case 11:
          segments.push([right(), top()]);
          break;
        case 12:
          segments.push([left(), right()]);
          break;
        case 13:
          segments.push([bottom(), right()]);
          break;
        case 14:
          segments.push([left(), bottom()]);
          break;
      }
    }
  }
  return segments;
}
// =============================================================================

// --- Sequential Imprint gradient (imprint_seq) for the density levels ------
function hexToRgb(hex) {
  const n = parseInt(hex.slice(1), 16);
  return [(n >> 16) & 255, (n >> 8) & 255, n & 255];
}
function lerpColor(hex1, hex2, frac) {
  const [r1, g1, b1] = hexToRgb(hex1);
  const [r2, g2, b2] = hexToRgb(hex2);
  const r = Math.round(r1 + (r2 - r1) * frac);
  const g = Math.round(g1 + (g2 - g1) * frac);
  const b = Math.round(b1 + (b2 - b1) * frac);
  return `rgb(${r}, ${g}, ${b})`;
}

const levelFractions = [0.12, 0.3, 0.5, 0.7, 0.88];
const contourDatasets = levelFractions.map((frac) => {
  const segments = marchingSquares(frac * maxDensity);
  const points = [];
  segments.forEach(([p1, p2]) => points.push(p1, p2, { x: NaN, y: NaN }));
  return {
    type: "line",
    label: `${Math.round(frac * 100)}% density`,
    data: points,
    borderColor: lerpColor(t.seq[0], t.seq[1], frac),
    borderWidth: 2.5,
    pointRadius: 0,
    fill: false,
    tension: 0,
    spanGaps: false,
  };
});

const rawReadings = {
  type: "scatter",
  label: "Process readings",
  data: temperature.map((value, i) => ({ x: value, y: pressure[i] })),
  backgroundColor: `${t.inkSoft}59`,
  borderWidth: 0,
  pointRadius: 2.5,
};

// --- Custom plugin: name the two operating-mode clusters --------------------
// Uses Chart.js's own public plugin hook (afterDatasetsDraw) — no external
// annotation package, just the core Canvas 2D API drawn onto the chart ctx.
const clusterLabelPlugin = {
  id: "clusterLabels",
  afterDatasetsDraw(chart) {
    const { ctx, scales } = chart;
    const labels = [
      { text: "Stable operation", point: stableCentroid },
      { text: "High-load operation", point: highLoadCentroid },
    ];
    ctx.save();
    ctx.font = "600 13px sans-serif";
    ctx.fillStyle = t.ink;
    ctx.textAlign = "center";
    labels.forEach(({ text, point }) => {
      const px = scales.x.getPixelForValue(point.x);
      const py = scales.y.getPixelForValue(point.y) - 55;
      ctx.fillText(text, px, py);
    });
    ctx.restore();
  },
};

// --- Mount -------------------------------------------------------------------
const canvas = document.createElement("canvas");
document.getElementById("container").appendChild(canvas);

// --- Chart ---------------------------------------------------------------------
new Chart(canvas, {
  type: "scatter",
  data: { datasets: [rawReadings, ...contourDatasets] },
  plugins: [clusterLabelPlugin],
  options: {
    responsive: true,
    maintainAspectRatio: false,
    animation: false,
    plugins: {
      title: {
        display: true,
        text: "contour-density · javascript · chartjs · anyplot.ai",
        color: t.ink,
        font: { size: 22, weight: "500" },
      },
      subtitle: {
        display: true,
        text: "Contours light green → blue as point density rises",
        color: t.inkSoft,
        font: { size: 14 },
        padding: { bottom: 12 },
      },
      legend: {
        display: true,
        position: "right",
        labels: {
          color: t.inkSoft,
          font: { size: 12 },
          boxWidth: 20,
          boxHeight: 3,
          filter: (item, data) => data.datasets[item.datasetIndex].type === "line",
        },
      },
    },
    scales: {
      x: {
        type: "linear",
        title: { display: true, text: "Reactor Temperature (°C)", color: t.ink, font: { size: 16 } },
        ticks: { color: t.inkSoft, font: { size: 14 } },
        grid: { color: t.grid },
      },
      y: {
        type: "linear",
        title: { display: true, text: "Reactor Pressure (bar)", color: t.ink, font: { size: 16 } },
        ticks: { color: t.inkSoft, font: { size: 14 } },
        grid: { color: t.grid },
      },
    },
  },
});
Runnable source as JSON, for any HTTP client: https://api.anyplot.ai/specs/contour-density/chartjs/code. Any spec id and library id listed in llms-full.txt fit the same URL shape; every URL below is complete and callable.
{
  "spec_id": "contour-density",
  "language": "javascript",
  "library": "chartjs",
  "page": "https://anyplot.ai/contour-density/javascript/chartjs",
  "hub": "https://anyplot.ai/contour-density",
  "code_json": "https://api.anyplot.ai/specs/contour-density/chartjs/code",
  "spec_json": "https://api.anyplot.ai/specs/contour-density",
  "render_light_png": "https://storage.googleapis.com/anyplot-images/plots/contour-density/javascript/chartjs/plot-light.png",
  "render_dark_png": "https://storage.googleapis.com/anyplot-images/plots/contour-density/javascript/chartjs/plot-dark.png",
  "interactive_light_html": "https://storage.googleapis.com/anyplot-images/plots/contour-density/javascript/chartjs/plot-light.html",
  "interactive_dark_html": "https://storage.googleapis.com/anyplot-images/plots/contour-density/javascript/chartjs/plot-dark.html",
  "quality_score": 93.0,
  "license": "MIT",
  "guide": "https://anyplot.ai/llms.txt"
}
Part of Density Contour Plot on anyplot.ai.