The same plot in 14 other libraries — JavaScript: Chart.js, D3.js, Apache ECharts, Highcharts; Python: Altair, Bokeh, lets-plot, Matplotlib, Plotly, plotnine, Pygal, Seaborn; R: ggplot2; Julia: Makie.jl. Compare all 15 side by side: Density Contour Plot in Python, R, Julia and JavaScript.
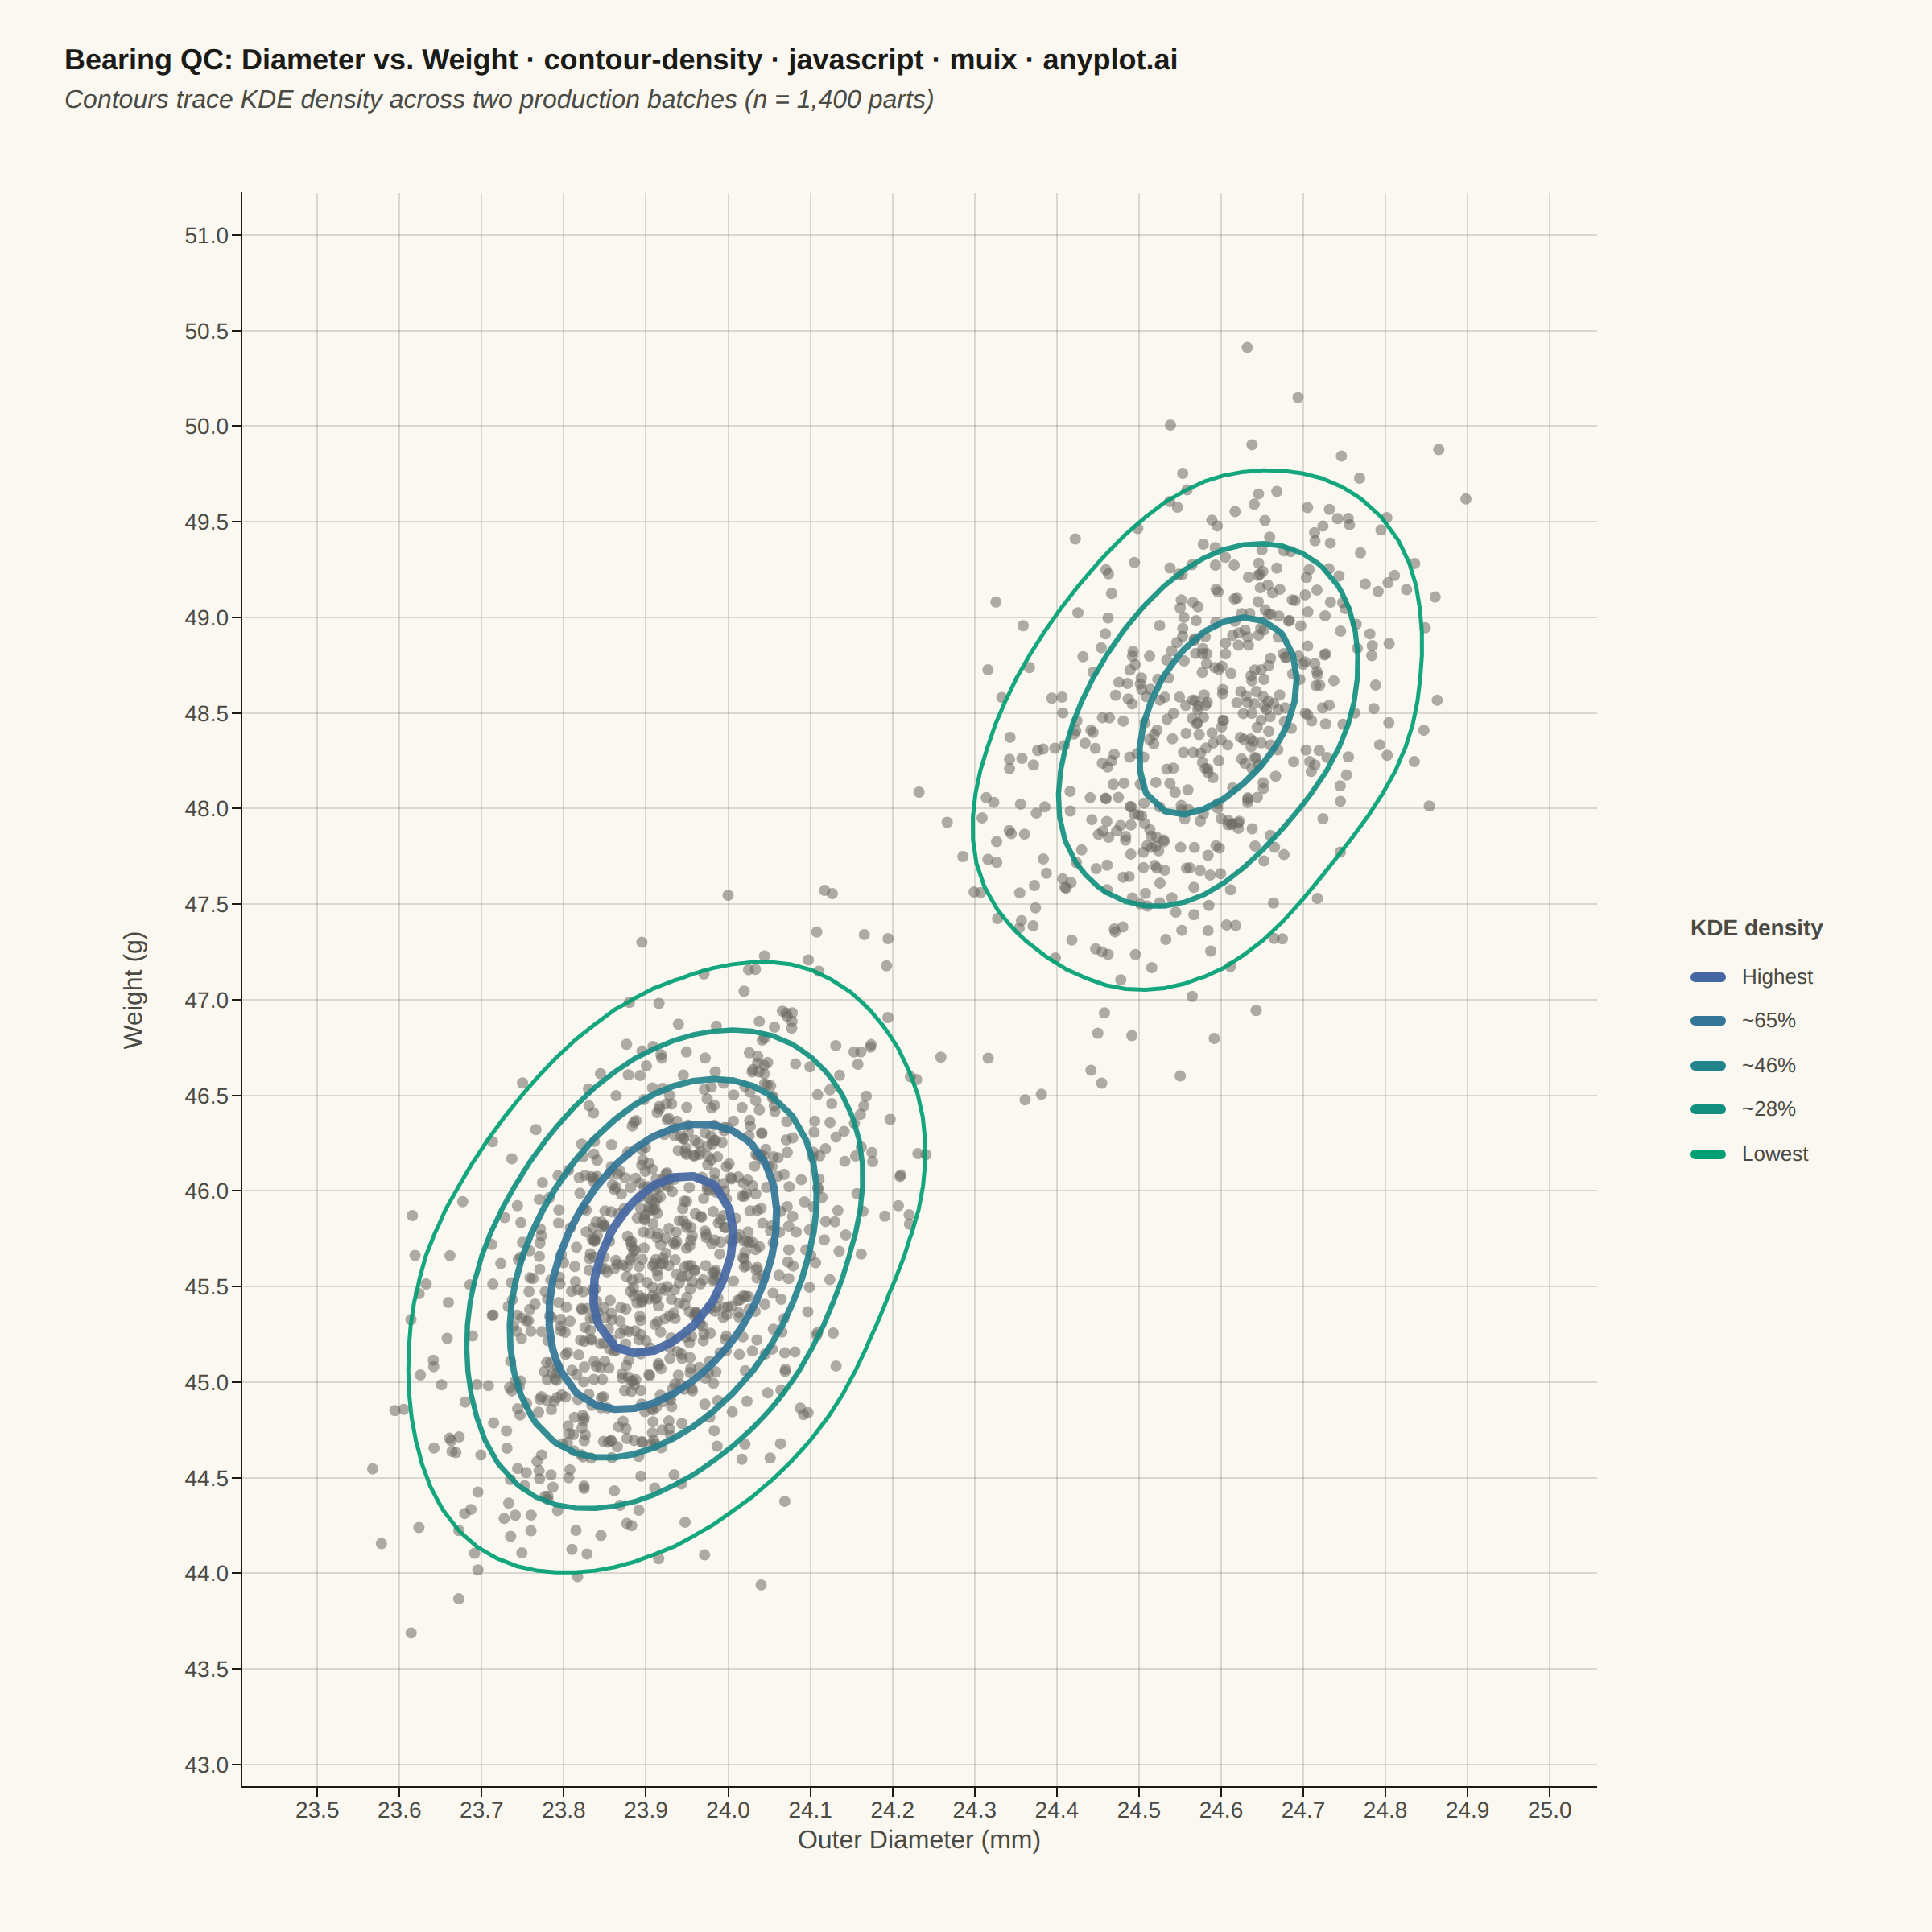
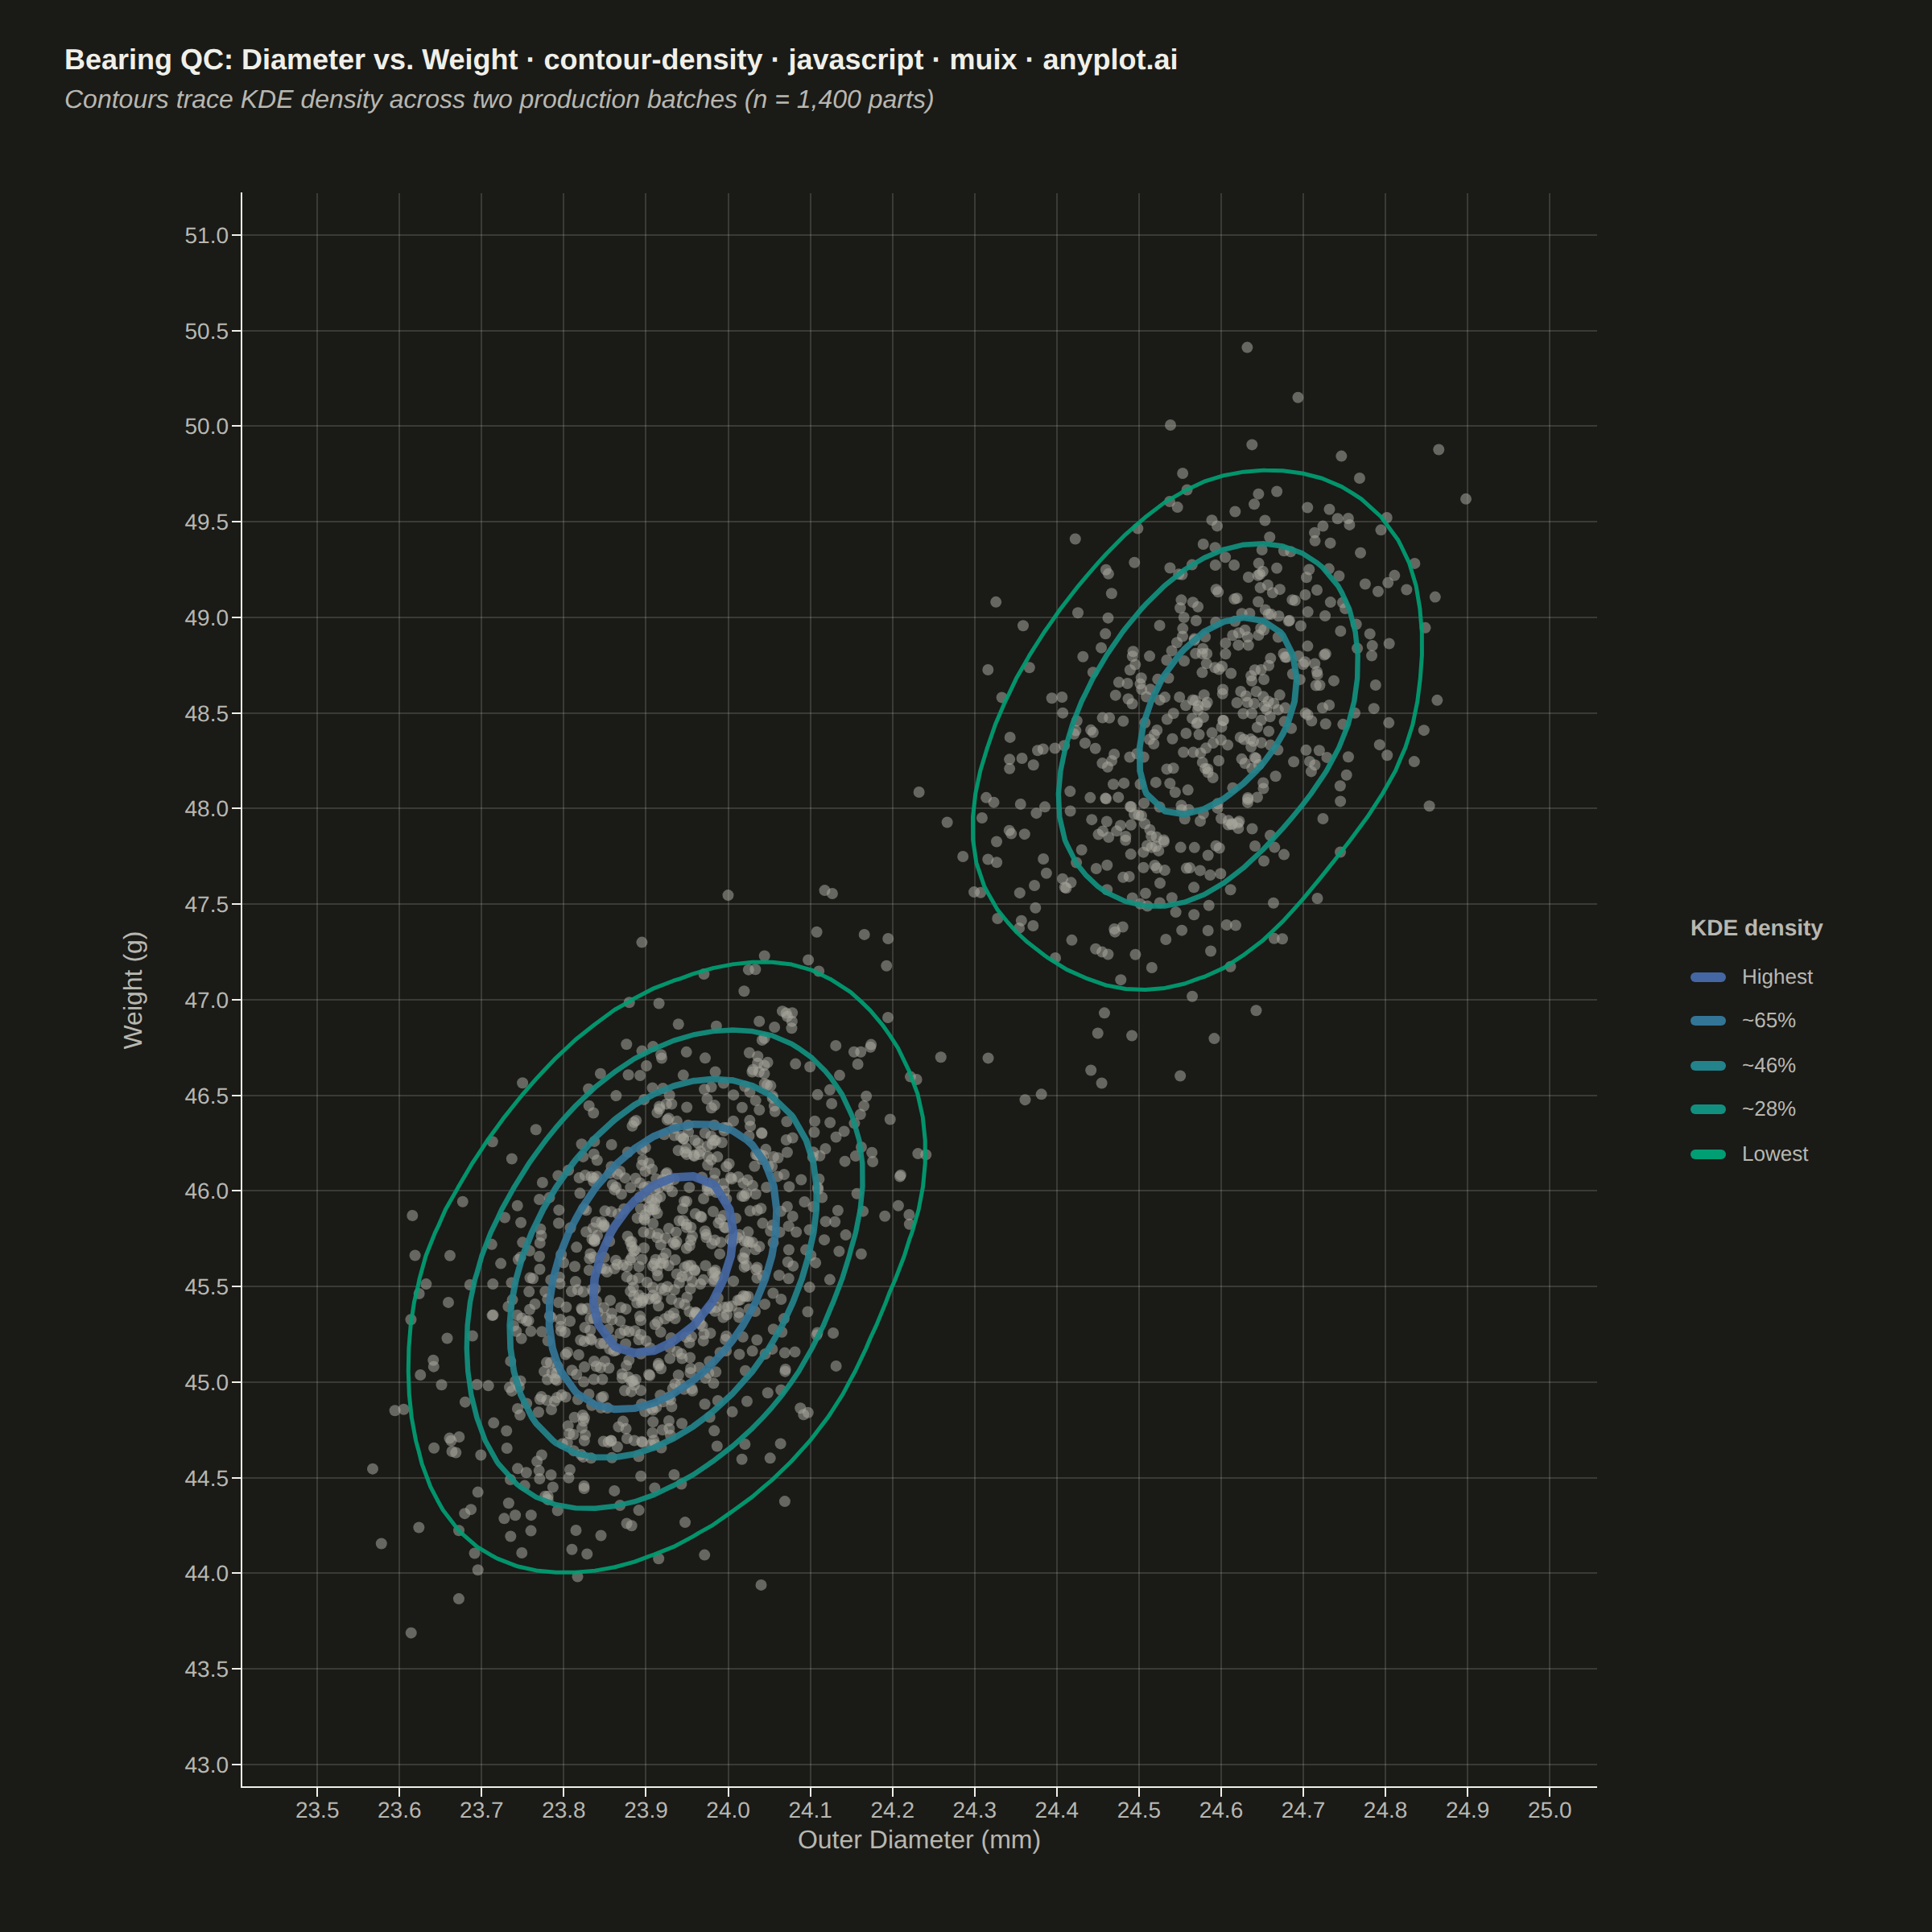
A density contour plot (also known as a 2D KDE contour plot) displays the concentration of points in a 2D scatter plot using contour lines. The contours connect points of equal density, revealing clusters, patterns, and the overall bivariate distribution shape.
// anyplot.ai
// contour-density: Density Contour Plot
// Library: muix 7.29.1 | JavaScript 22.23.2
// Quality: 93/100 | Created: 2026-09-04
//# anyplot-orientation: square
// anyplot.ai
// contour-density: Density Contour Plot
// Library: MUI X Charts | React | Node 22
// License: @mui/x-charts — MIT (community). Pro/Premium are out of scope.
// Quality: pending | Created: 2026-09-04

// MUI X community has no native contour/isoline chart. We compose one on top
// of ScatterChart: a raw sample overlay (native ScatterPlot) plus a custom
// child that draws real marching-squares contour paths from a real 2D KDE,
// using the chart's own useXScale/useYScale — the documented composition
// API, not a workaround.
import { ScatterChart } from "@mui/x-charts/ScatterChart";
import { useXScale, useYScale } from "@mui/x-charts/hooks";
import Box from "@mui/material/Box";
import Typography from "@mui/material/Typography";

const t = window.ANYPLOT_TOKENS;
// ANYPLOT_TOKENS has no tertiary "muted" anchor — derive it the same way the
// style guide defines it (theme-adaptive, used for context/behind-the-data marks).
const INK_MUTED = window.ANYPLOT_THEME === "dark" ? "#A8A79F" : "#6B6A63";

// --- Data: bearing QC measurements from two production batches ------------
// Batch A sits on-spec; batch B drifted high on both dimensions — a common
// quality-control pattern where a density contour reveals two overlapping
// process clusters that a plain scatter would bury in overplotting.
function createRng(seed: number) {
  let state = seed >>> 0;
  return () => {
    state = (1664525 * state + 1013904223) >>> 0;
    return state / 4294967296;
  };
}
const rand = createRng(42);

function randNormal() {
  const u1 = Math.max(rand(), 1e-9);
  const u2 = rand();
  return Math.sqrt(-2 * Math.log(u1)) * Math.cos(2 * Math.PI * u2);
}

function correlatedPoint(meanX: number, sdX: number, meanY: number, sdY: number, rho: number) {
  const z1 = randNormal();
  const z2 = randNormal();
  return {
    x: meanX + sdX * z1,
    y: meanY + sdY * (rho * z1 + Math.sqrt(1 - rho * rho) * z2),
  };
}

const points: { id: number; x: number; y: number }[] = [];
for (let i = 0; i < 900; i += 1) {
  const p = correlatedPoint(23.92, 0.13, 45.6, 0.7, 0.5);
  points.push({ id: points.length, x: p.x, y: p.y });
}
for (let i = 0; i < 500; i += 1) {
  const p = correlatedPoint(24.58, 0.12, 48.4, 0.65, 0.45);
  points.push({ id: points.length, x: p.x, y: p.y });
}

const diameters = points.map((p) => p.x);
const weights = points.map((p) => p.y);
const diameterMin = Math.min(...diameters);
const diameterMax = Math.max(...diameters);
const weightMin = Math.min(...weights);
const weightMax = Math.max(...weights);
const padX = (diameterMax - diameterMin) * 0.12;
const padY = (weightMax - weightMin) * 0.12;
const domainXMin = diameterMin - padX;
const domainXMax = diameterMax + padX;
const domainYMin = weightMin - padY;
const domainYMax = weightMax + padY;

// --- 2D kernel density estimate on a grid ----------------------------------
function silvermanBandwidth(values: number[]) {
  const n = values.length;
  const mean = values.reduce((a, b) => a + b, 0) / n;
  const variance = values.reduce((a, b) => a + (b - mean) ** 2, 0) / (n - 1);
  return 1.06 * Math.sqrt(variance) * n ** (-1 / 5);
}

const GRID_N = 70;
const gridX = Array.from(
  { length: GRID_N },
  (_, i) => domainXMin + (i * (domainXMax - domainXMin)) / (GRID_N - 1),
);
const gridY = Array.from(
  { length: GRID_N },
  (_, i) => domainYMin + (i * (domainYMax - domainYMin)) / (GRID_N - 1),
);
const bandwidthX = silvermanBandwidth(diameters);
const bandwidthY = silvermanBandwidth(weights);

const densityGrid = gridY.map((yv) =>
  gridX.map((xv) => {
    let sum = 0;
    for (let k = 0; k < points.length; k += 1) {
      const dx = (xv - points[k].x) / bandwidthX;
      const dy = (yv - points[k].y) / bandwidthY;
      sum += Math.exp(-0.5 * (dx * dx + dy * dy));
    }
    return sum / (points.length * bandwidthX * bandwidthY);
  }),
);
const maxDensity = Math.max(...densityGrid.map((row) => Math.max(...row)));

// --- Marching squares: extract iso-density line segments -------------------
function lerp(a: number, b: number, va: number, vb: number, threshold: number) {
  if (vb === va) return a;
  return a + ((b - a) * (threshold - va)) / (vb - va);
}

const CASE_EDGES: Record<number, [string, string][]> = {
  1: [["L", "B"]],
  2: [["B", "R"]],
  3: [["L", "R"]],
  4: [["T", "R"]],
  6: [["T", "B"]],
  7: [["T", "L"]],
  8: [["T", "L"]],
  9: [["T", "B"]],
  11: [["T", "R"]],
  12: [["L", "R"]],
  13: [["B", "R"]],
  14: [["L", "B"]],
};

function marchingSquares(xs: number[], ys: number[], grid: number[][], threshold: number) {
  const segments: [number, number, number, number][] = [];
  for (let i = 0; i < ys.length - 1; i += 1) {
    for (let j = 0; j < xs.length - 1; j += 1) {
      const x0 = xs[j];
      const x1 = xs[j + 1];
      const y0 = ys[i];
      const y1 = ys[i + 1];
      const v00 = grid[i][j];
      const v10 = grid[i][j + 1];
      const v01 = grid[i + 1][j];
      const v11 = grid[i + 1][j + 1];

      const idx =
        (v00 >= threshold ? 8 : 0) |
        (v10 >= threshold ? 4 : 0) |
        (v11 >= threshold ? 2 : 0) |
        (v01 >= threshold ? 1 : 0);
      if (idx === 0 || idx === 15) continue;

      const edgePoint = (edge: string): [number, number] => {
        if (edge === "T") return [lerp(x0, x1, v00, v10, threshold), y0];
        if (edge === "R") return [x1, lerp(y0, y1, v10, v11, threshold)];
        if (edge === "B") return [lerp(x0, x1, v01, v11, threshold), y1];
        return [x0, lerp(y0, y1, v00, v01, threshold)];
      };

      // Saddle cases (5, 10): resolve via the cell's average value so the
      // contour topology stays consistent with the smooth underlying KDE.
      const avg = (v00 + v10 + v01 + v11) / 4;
      let pairs: [string, string][];
      if (idx === 5) pairs = avg >= threshold ? [["T", "L"], ["B", "R"]] : [["T", "R"], ["L", "B"]];
      else if (idx === 10) pairs = avg >= threshold ? [["T", "R"], ["L", "B"]] : [["T", "L"], ["B", "R"]];
      else pairs = CASE_EDGES[idx];

      pairs.forEach(([e1, e2]) => {
        const [ax, ay] = edgePoint(e1);
        const [bx, by] = edgePoint(e2);
        segments.push([ax, ay, bx, by]);
      });
    }
  }
  return segments;
}

const LEVEL_FRACTIONS = [0.12, 0.28, 0.46, 0.65, 0.85];
const CONTOURS = LEVEL_FRACTIONS.map((fraction) => ({
  fraction,
  segments: marchingSquares(gridX, gridY, densityGrid, fraction * maxDensity),
}));

// --- Imprint sequential ramp (brand green → blue) --------------------------
function mixHex(hexA: string, hexB: string, ratio: number) {
  const a = parseInt(hexA.slice(1), 16);
  const b = parseInt(hexB.slice(1), 16);
  const channel = (shift: number) => {
    const av = (a >> shift) & 255;
    const bv = (b >> shift) & 255;
    return Math.round(av + (bv - av) * ratio).toString(16).padStart(2, "0");
  };
  return `#${[16, 8, 0].map(channel).join("")}`;
}

function hexToRgba(hex: string, alpha: number) {
  const n = parseInt(hex.slice(1), 16);
  return `rgba(${(n >> 16) & 255}, ${(n >> 8) & 255}, ${n & 255}, ${alpha})`;
}

// Custom mark: draws the precomputed iso-density paths in the chart's own
// pixel space via its native scale hooks — this is MUI X's documented
// composition pattern for chart types the community surface lacks natively.
function ContourLines() {
  const xScale = useXScale();
  const yScale = useYScale();
  if (!xScale || !yScale) return null;

  return (
    <g>
      {CONTOURS.map(({ fraction, segments }, level) => {
        if (segments.length === 0) return null;
        const d = segments
          .map(([x1, y1, x2, y2]) => `M ${xScale(x1)} ${yScale(y1)} L ${xScale(x2)} ${yScale(y2)}`)
          .join(" ");
        const color = mixHex(t.seq[0], t.seq[1], level / (LEVEL_FRACTIONS.length - 1));
        return (
          <path
            key={fraction}
            d={d}
            fill="none"
            stroke={color}
            strokeWidth={2.5 + level * 0.7}
            strokeOpacity={0.92}
            strokeLinecap="round"
            strokeLinejoin="round"
          />
        );
      })}
    </g>
  );
}

function DensityLegend({ height }: { height: number }) {
  const rows = LEVEL_FRACTIONS.map((fraction, level) => ({
    fraction,
    color: mixHex(t.seq[0], t.seq[1], level / (LEVEL_FRACTIONS.length - 1)),
  })).reverse();
  return (
    <Box sx={{ width: 168, height, display: "flex", flexDirection: "column", justifyContent: "center", pl: "18px" }}>
      <Typography sx={{ color: t.inkSoft, fontSize: 14, fontWeight: 600, mb: "10px", fontFamily: "inherit" }}>
        KDE density
      </Typography>
      {rows.map(({ fraction, color }, i) => (
        <Box key={color} sx={{ display: "flex", alignItems: "center", mb: "8px" }}>
          <Box sx={{ width: 22, height: 6, borderRadius: "3px", bgcolor: color, mr: "10px", flexShrink: 0 }} />
          <Typography sx={{ color: t.inkSoft, fontSize: 13, fontFamily: "inherit" }}>
            {i === 0 ? "Highest" : i === rows.length - 1 ? "Lowest" : `~${Math.round(fraction * 100)}%`}
          </Typography>
        </Box>
      ))}
    </Box>
  );
}

export default function Chart() {
  const { width, height } = window.ANYPLOT_SIZE;
  const TITLE_H = 100;
  const LEGEND_W = 168;
  const chartWidth = width - LEGEND_W;
  const chartHeight = height - TITLE_H;

  const title = "Bearing QC: Diameter vs. Weight · contour-density · javascript · muix · anyplot.ai";
  const titleSize = title.length > 67 ? Math.round(22 * (67 / title.length)) : 22;
  const contextColor = hexToRgba(INK_MUTED, 0.55);

  return (
    <Box sx={{ width, height, bgcolor: t.pageBg, display: "flex", flexDirection: "column" }}>
      <Box sx={{ height: TITLE_H, display: "flex", flexDirection: "column", justifyContent: "center", px: "40px" }}>
        <Typography sx={{ color: t.ink, fontSize: titleSize, fontWeight: 600, lineHeight: 1.25, fontFamily: "inherit" }}>
          {title}
        </Typography>
        <Typography sx={{ color: t.inkSoft, fontSize: 16, fontStyle: "italic", lineHeight: 1.3, fontFamily: "inherit", mt: "4px" }}>
          Contours trace KDE density across two production batches (n = 1,400 parts)
        </Typography>
      </Box>
      <Box sx={{ flex: 1, display: "flex", flexDirection: "row" }}>
        <ScatterChart
          width={chartWidth}
          height={chartHeight}
          skipAnimation
          disableVoronoi
          series={[
            {
              id: "sample",
              type: "scatter",
              data: points,
              color: contextColor,
              markerSize: 3.5,
              label: "Sampled parts",
            },
          ]}
          xAxis={[
            {
              scaleType: "linear",
              min: domainXMin,
              max: domainXMax,
              label: "Outer Diameter (mm)",
              labelStyle: { fontSize: 16, fill: t.inkSoft },
              tickLabelStyle: { fontSize: 14, fill: t.inkSoft },
            },
          ]}
          yAxis={[
            {
              scaleType: "linear",
              min: domainYMin,
              max: domainYMax,
              label: "Weight (g)",
              labelStyle: { fontSize: 16, fill: t.inkSoft },
              tickLabelStyle: { fontSize: 14, fill: t.inkSoft },
              // MUI X positions the rotated axis label at a fixed offset of
              // `tickFontSize + tickSize + 10` from the axis line — that offset
              // uses this deprecated prop, NOT `tickLabelStyle.fontSize` above,
              // so it must be set wide enough on its own to clear the actual
              // (wider) rendered tick-label text at every tick position.
              tickFontSize: 46,
            },
          ]}
          grid={{ horizontal: true, vertical: true }}
          margin={{ top: 20, right: 40, bottom: 90, left: 150 }}
          sx={{
            "& .MuiChartsGrid-line": { stroke: t.grid, strokeWidth: 1 },
          }}
          slotProps={{ legend: { hidden: true } }}
        >
          <ContourLines />
        </ScatterChart>
        <DensityLegend height={chartHeight} />
      </Box>
    </Box>
  );
}
Runnable source as JSON, for any HTTP client: https://api.anyplot.ai/specs/contour-density/muix/code. Any spec id and library id listed in llms-full.txt fit the same URL shape; every URL below is complete and callable.
{
  "spec_id": "contour-density",
  "language": "javascript",
  "library": "muix",
  "page": "https://anyplot.ai/contour-density/javascript/muix",
  "hub": "https://anyplot.ai/contour-density",
  "code_json": "https://api.anyplot.ai/specs/contour-density/muix/code",
  "spec_json": "https://api.anyplot.ai/specs/contour-density",
  "render_light_png": "https://storage.googleapis.com/anyplot-images/plots/contour-density/javascript/muix/plot-light.png",
  "render_dark_png": "https://storage.googleapis.com/anyplot-images/plots/contour-density/javascript/muix/plot-dark.png",
  "interactive_light_html": "https://storage.googleapis.com/anyplot-images/plots/contour-density/javascript/muix/plot-light.html",
  "interactive_dark_html": "https://storage.googleapis.com/anyplot-images/plots/contour-density/javascript/muix/plot-dark.html",
  "quality_score": 93.0,
  "license": "MIT",
  "guide": "https://anyplot.ai/llms.txt"
}
Part of Density Contour Plot on anyplot.ai.