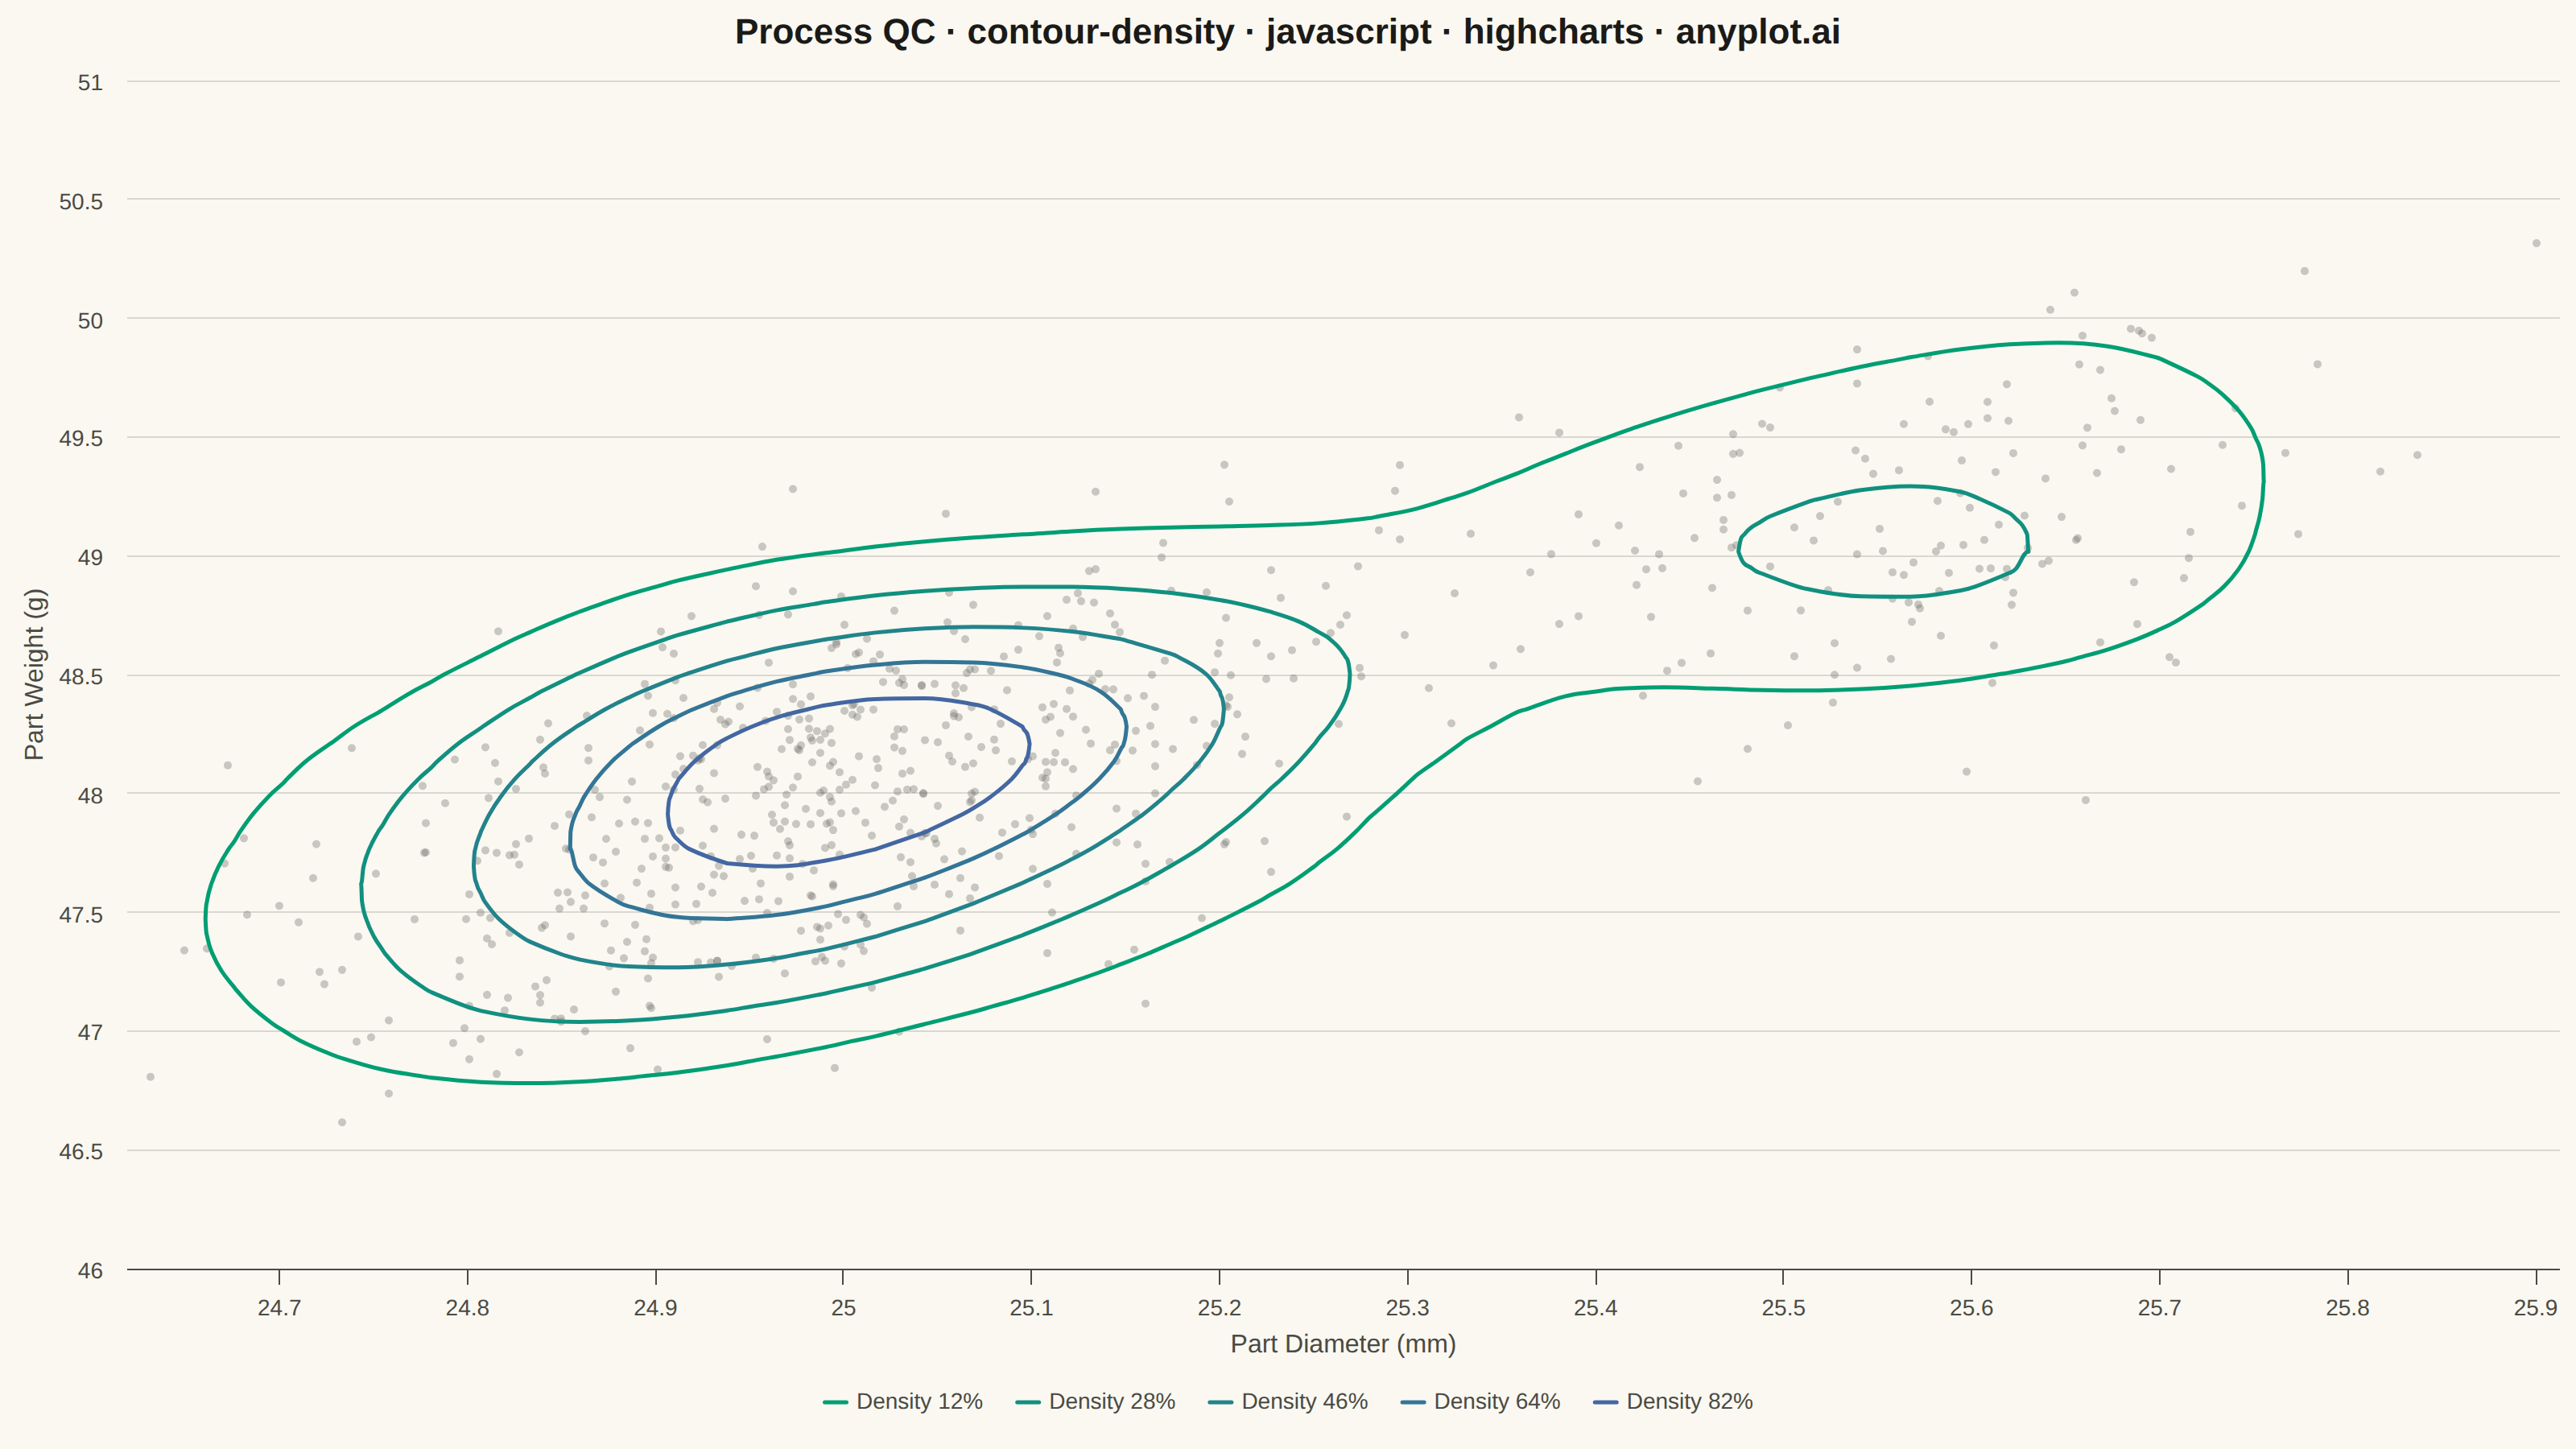
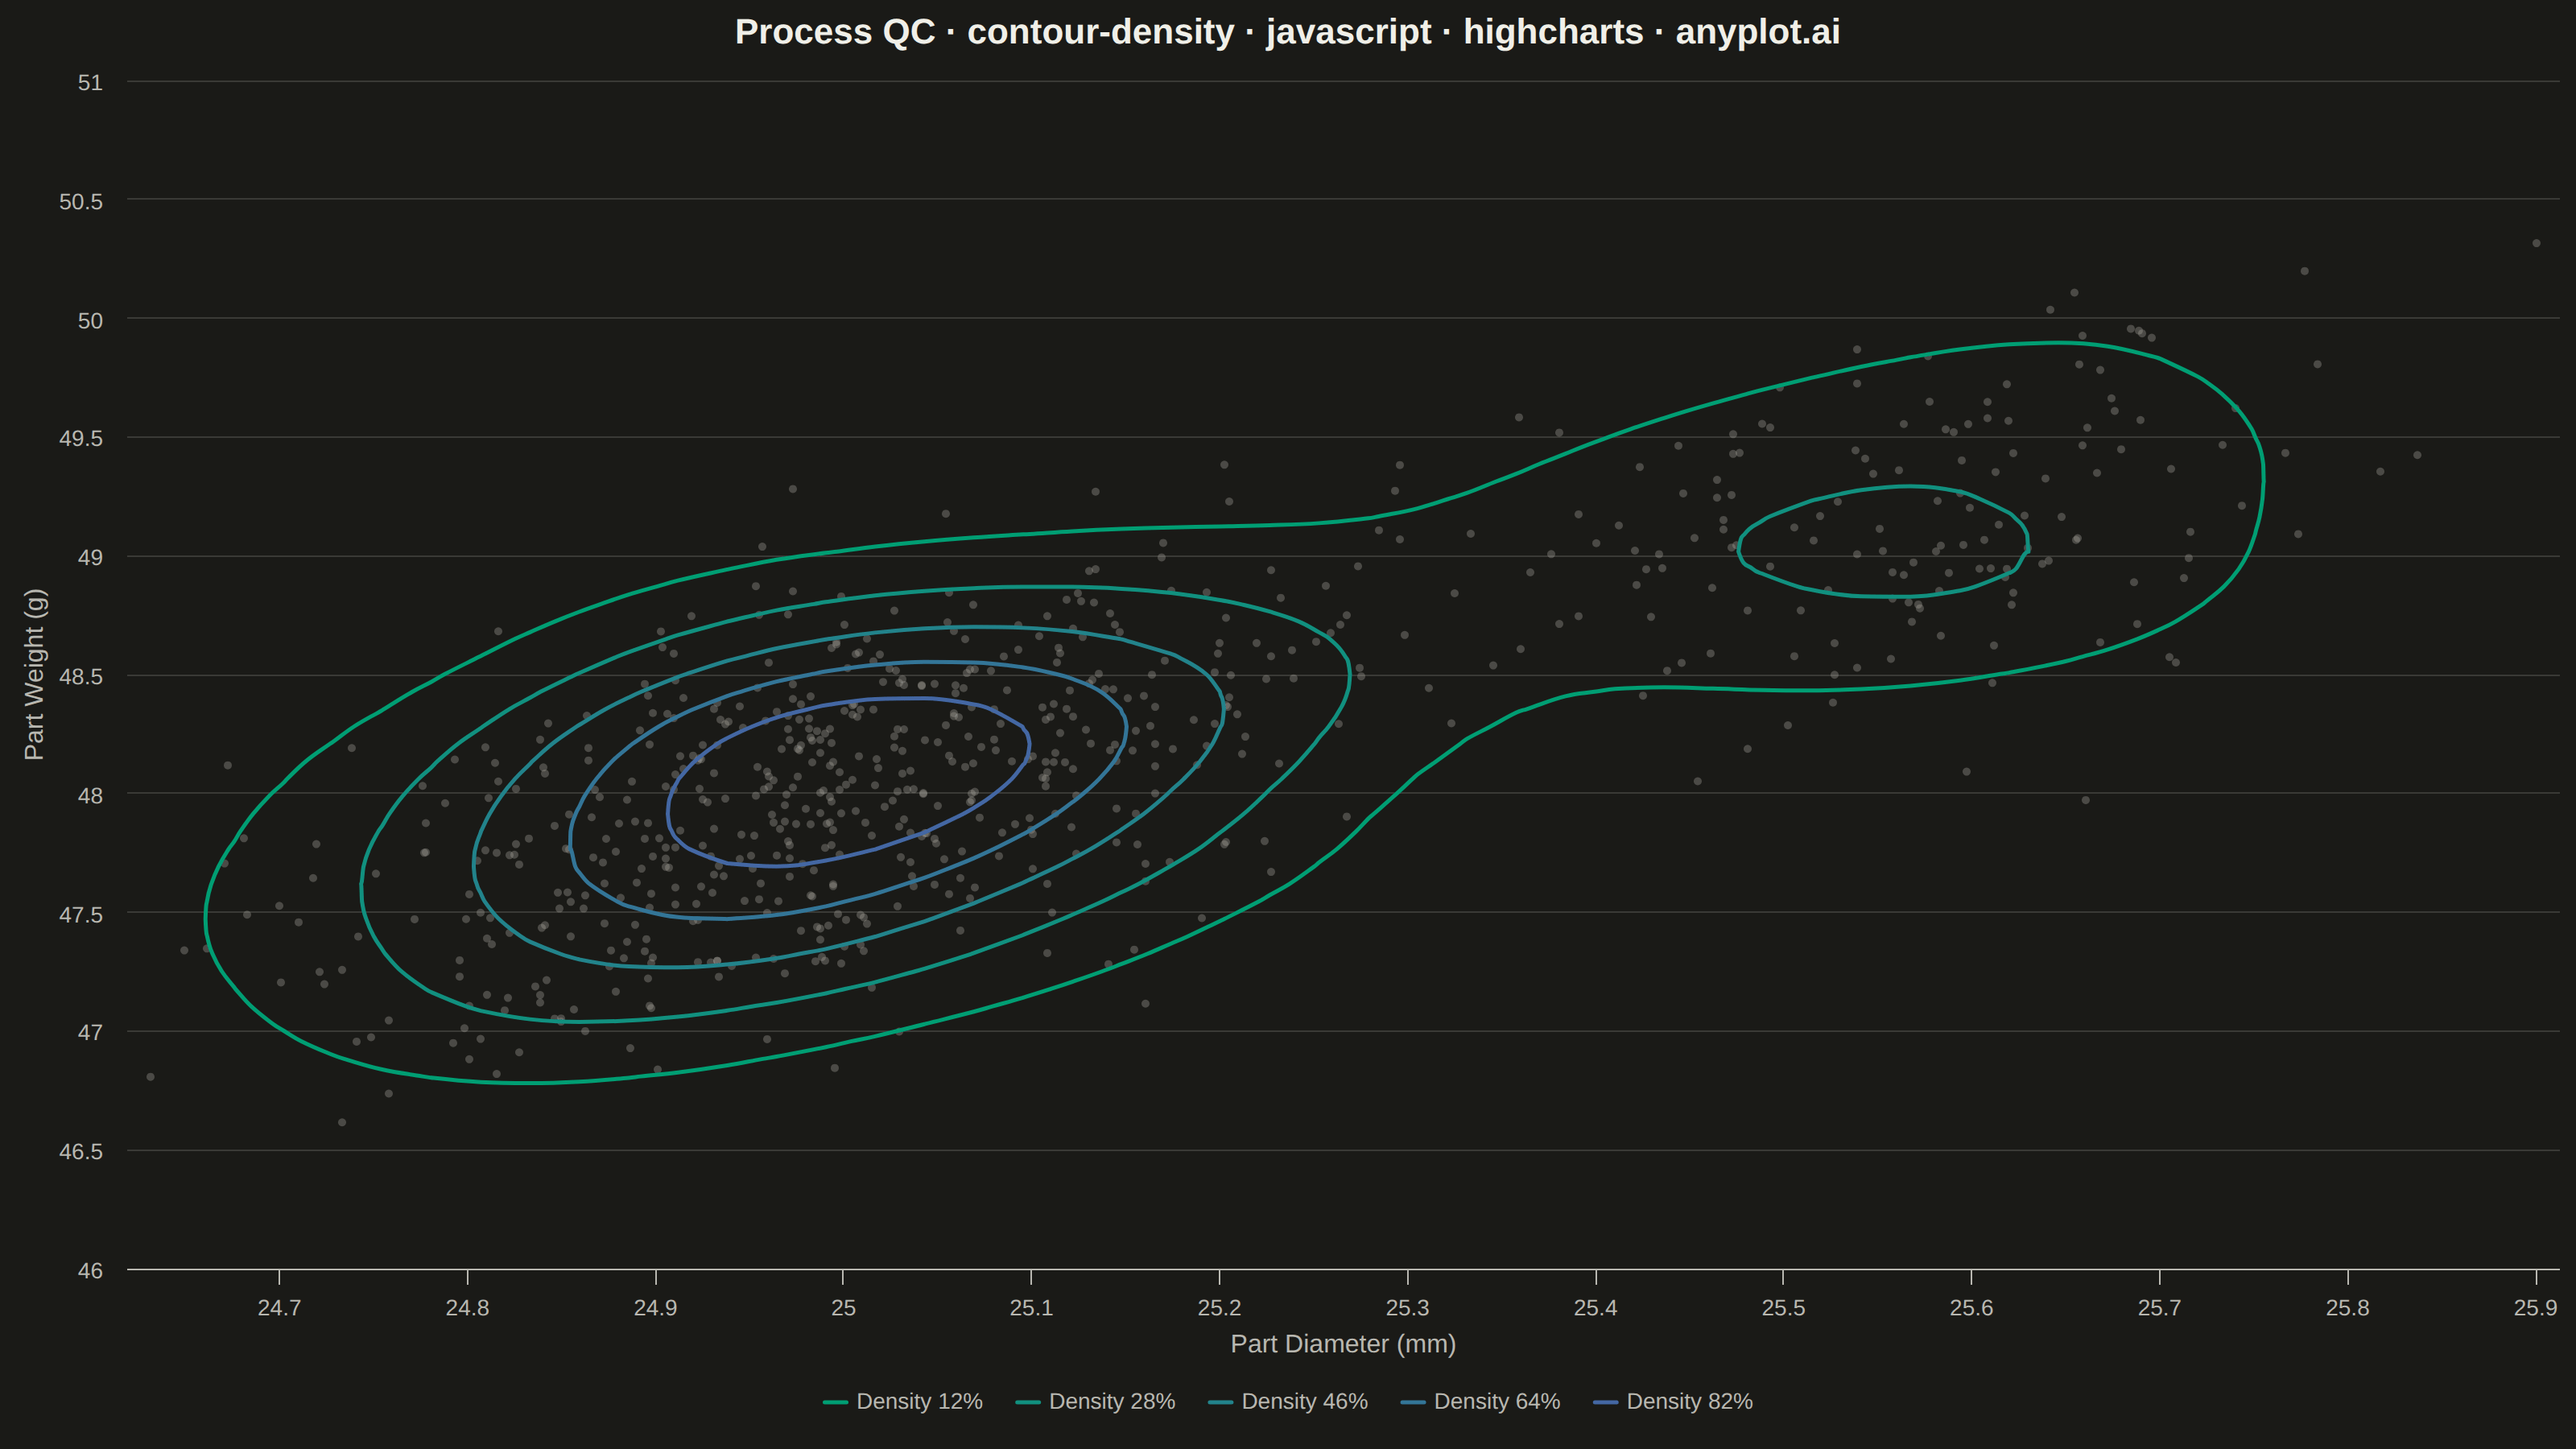
The same plot in 14 other libraries — JavaScript: Chart.js, D3.js, Apache ECharts, MUI X Charts; Python: Altair, Bokeh, lets-plot, Matplotlib, Plotly, plotnine, Pygal, Seaborn; R: ggplot2; Julia: Makie.jl. Compare all 15 side by side: Density Contour Plot in Python, R, Julia and JavaScript.
A density contour plot (also known as a 2D KDE contour plot) displays the concentration of points in a 2D scatter plot using contour lines. The contours connect points of equal density, revealing clusters, patterns, and the overall bivariate distribution shape.
// anyplot.ai
// contour-density: Density Contour Plot
// Library: highcharts 12.6.0 | JavaScript 22.23.2
// Quality: 90/100 | Created: 2026-09-04
//# anyplot-orientation: landscape

const THEME = window.ANYPLOT_THEME;
const t = window.ANYPLOT_TOKENS;
const INK_MUTED = THEME === "light" ? "#6B6A63" : "#A8A79F";

// --- Deterministic RNG (LCG) + Box-Muller normal deviates -------------------
function makeRng(seed) {
  let state = seed >>> 0;
  return function () {
    state = (state * 1664525 + 1013904223) >>> 0;
    return state / 4294967296;
  };
}
function randomNormal(rng) {
  const u1 = Math.max(rng(), 1e-12);
  const u2 = rng();
  return Math.sqrt(-2 * Math.log(u1)) * Math.cos(2 * Math.PI * u2);
}
function generateCluster(rng, n, meanX, meanY, sdX, sdY, rho) {
  const points = [];
  for (let k = 0; k < n; k++) {
    const z1 = randomNormal(rng);
    const z2 = randomNormal(rng);
    points.push({
      x: meanX + sdX * z1,
      y: meanY + sdY * (rho * z1 + Math.sqrt(1 - rho * rho) * z2),
    });
  }
  return points;
}

// --- Data: machined-part QC measurements, main batch + a tool-wear drift ---
const rng = makeRng(42);
const mainBatch = generateCluster(rng, 550, 25.0, 48.0, 0.14, 0.55, 0.55);
const driftBatch = generateCluster(rng, 150, 25.55, 49.1, 0.12, 0.45, 0.45);
const parts = mainBatch.concat(driftBatch);

// --- 2D kernel density estimate on a grid -----------------------------------
function std(values) {
  const mean = values.reduce((a, b) => a + b, 0) / values.length;
  const variance = values.reduce((a, b) => a + (b - mean) ** 2, 0) / values.length;
  return Math.sqrt(variance);
}
function computeDensityGrid(pts, gx, gy, bwX, bwY) {
  const ny = gy.length;
  const nx = gx.length;
  const grid = Array.from({ length: ny }, () => new Array(nx).fill(0));
  pts.forEach((p) => {
    for (let j = 0; j < ny; j++) {
      const dy = (gy[j] - p.y) / bwY;
      const wy = Math.exp(-0.5 * dy * dy);
      if (wy < 1e-6) continue;
      const row = grid[j];
      for (let i = 0; i < nx; i++) {
        const dx = (gx[i] - p.x) / bwX;
        row[i] += wy * Math.exp(-0.5 * dx * dx);
      }
    }
  });
  return grid;
}

const diameters = parts.map((p) => p.x);
const weights = parts.map((p) => p.y);
const n = parts.length;
const bwX = std(diameters) * Math.pow(n, -1 / 6);
const bwY = std(weights) * Math.pow(n, -1 / 6);
const xMin = Math.min(...diameters) - 3 * bwX;
const xMax = Math.max(...diameters) + 3 * bwX;
const yMin = Math.min(...weights) - 3 * bwY;
const yMax = Math.max(...weights) + 3 * bwY;

const GRID_N = 70;
const gridX = Array.from({ length: GRID_N }, (_, i) => xMin + (i * (xMax - xMin)) / (GRID_N - 1));
const gridY = Array.from({ length: GRID_N }, (_, j) => yMin + (j * (yMax - yMin)) / (GRID_N - 1));
const densityGrid = computeDensityGrid(parts, gridX, gridY, bwX, bwY);

let maxDensity = 0;
densityGrid.forEach((row) => row.forEach((v) => { if (v > maxDensity) maxDensity = v; }));

// --- Marching squares: extract iso-density contour lines from the grid -----
function buildPaths(segments) {
  const pointSegs = new Map();
  segments.forEach((seg) => {
    seg.forEach((p) => {
      if (!pointSegs.has(p)) pointSegs.set(p, []);
      pointSegs.get(p).push(seg);
    });
  });
  const visited = new Set();
  const paths = [];
  segments.forEach((seg) => {
    if (visited.has(seg)) return;
    visited.add(seg);
    const path = [seg[0], seg[1]];
    let extended = true;
    while (extended) {
      extended = false;
      const last = path[path.length - 1];
      const next = pointSegs.get(last).find((s) => !visited.has(s));
      if (next) {
        visited.add(next);
        const nextPoint = next[0] === last ? next[1] : next[0];
        path.push(nextPoint);
        extended = nextPoint !== path[0];
      }
    }
    extended = true;
    while (extended) {
      extended = false;
      const first = path[0];
      const next = pointSegs.get(first).find((s) => !visited.has(s));
      if (next) {
        visited.add(next);
        path.unshift(next[0] === first ? next[1] : next[0]);
        extended = true;
      }
    }
    paths.push(path);
  });
  return paths;
}

function marchingSquaresPaths(values, gx, gy, level) {
  const ny = values.length;
  const nx = values[0].length;

  // Shared edge crossings, computed once so neighboring cells reference the
  // same point object (exact chaining without floating-point epsilon compares).
  const hCross = [];
  for (let j = 0; j < ny; j++) {
    const row = [];
    for (let i = 0; i < nx - 1; i++) {
      const v0 = values[j][i];
      const v1 = values[j][i + 1];
      if ((v0 >= level) !== (v1 >= level)) {
        const frac = (level - v0) / (v1 - v0);
        row.push({ x: gx[i] + frac * (gx[i + 1] - gx[i]), y: gy[j] });
      } else {
        row.push(null);
      }
    }
    hCross.push(row);
  }
  const vCross = [];
  for (let i = 0; i < nx; i++) {
    const col = [];
    for (let j = 0; j < ny - 1; j++) {
      const v0 = values[j][i];
      const v1 = values[j + 1][i];
      if ((v0 >= level) !== (v1 >= level)) {
        const frac = (level - v0) / (v1 - v0);
        col.push({ x: gx[i], y: gy[j] + frac * (gy[j + 1] - gy[j]) });
      } else {
        col.push(null);
      }
    }
    vCross.push(col);
  }

  const segments = [];
  for (let j = 0; j < ny - 1; j++) {
    for (let i = 0; i < nx - 1; i++) {
      const v00 = values[j][i];
      const v10 = values[j][i + 1];
      const v11 = values[j + 1][i + 1];
      const v01 = values[j + 1][i];
      const c00 = v00 >= level;
      const c10 = v10 >= level;
      const c11 = v11 >= level;
      const c01 = v01 >= level;
      const caseIndex = (c00 ? 1 : 0) | (c10 ? 2 : 0) | (c11 ? 4 : 0) | (c01 ? 8 : 0);
      if (caseIndex === 0 || caseIndex === 15) continue;
      const edgeB = hCross[j][i];
      const edgeT = hCross[j + 1][i];
      const edgeL = vCross[i][j];
      const edgeR = vCross[i + 1][j];
      const center = (v00 + v10 + v11 + v01) / 4;
      let pairs;
      if (caseIndex === 5) pairs = center >= level ? [[edgeL, edgeT], [edgeB, edgeR]] : [[edgeL, edgeB], [edgeT, edgeR]];
      else if (caseIndex === 10) pairs = center >= level ? [[edgeL, edgeB], [edgeT, edgeR]] : [[edgeL, edgeT], [edgeB, edgeR]];
      else if (caseIndex === 1 || caseIndex === 14) pairs = [[edgeL, edgeB]];
      else if (caseIndex === 2 || caseIndex === 13) pairs = [[edgeB, edgeR]];
      else if (caseIndex === 3 || caseIndex === 12) pairs = [[edgeL, edgeR]];
      else if (caseIndex === 4 || caseIndex === 11) pairs = [[edgeR, edgeT]];
      else if (caseIndex === 6 || caseIndex === 9) pairs = [[edgeB, edgeT]];
      else pairs = [[edgeL, edgeT]]; // caseIndex 7 or 8
      pairs.forEach((pair) => segments.push(pair));
    }
  }
  return buildPaths(segments);
}

function pathsToSeriesData(paths) {
  // A bare `null` array element would get an auto-incremented index x (0, 1, 2…)
  // from Highcharts' tuple parser, corrupting the xAxis extremes. Give the gap
  // an explicit, in-range x instead.
  const data = [];
  paths.forEach((path, idx) => {
    if (idx > 0) data.push({ x: path[0].x, y: null });
    path.forEach((p) => data.push([p.x, p.y]));
  });
  return data;
}

// --- Sequential Imprint colormap for the density levels ---------------------
function hexToRgb(hex) {
  const value = parseInt(hex.slice(1), 16);
  return [(value >> 16) & 255, (value >> 8) & 255, value & 255];
}
function lerpColor(hex1, hex2, frac) {
  const a = hexToRgb(hex1);
  const b = hexToRgb(hex2);
  const r = Math.round(a[0] + (b[0] - a[0]) * frac);
  const g = Math.round(a[1] + (b[1] - a[1]) * frac);
  const bl = Math.round(a[2] + (b[2] - a[2]) * frac);
  return `rgb(${r}, ${g}, ${bl})`;
}

const levelFractions = [0.12, 0.28, 0.46, 0.64, 0.82];
const contourSeries = levelFractions.map((frac, idx) => {
  const paths = marchingSquaresPaths(densityGrid, gridX, gridY, frac * maxDensity);
  return {
    type: "spline",
    name: `Density ${Math.round(frac * 100)}%`,
    color: lerpColor(t.seq[0], t.seq[1], idx / (levelFractions.length - 1)),
    data: pathsToSeriesData(paths),
    lineWidth: 2.5,
    marker: { enabled: false },
    enableMouseTracking: false,
    showInLegend: true,
  };
});

const scatterRgb = hexToRgb(INK_MUTED);
const scatterSeries = {
  type: "scatter",
  name: "Measured parts",
  color: `rgba(${scatterRgb[0]}, ${scatterRgb[1]}, ${scatterRgb[2]}, 0.35)`,
  data: parts.map((p) => [p.x, p.y]),
  marker: { radius: 2.5, symbol: "circle", lineWidth: 0 },
  showInLegend: false,
  tooltip: { pointFormat: "Diameter: {point.x:.2f} mm<br/>Weight: {point.y:.2f} g" },
};

// --- Chart -------------------------------------------------------------------
const title = "Process QC · contour-density · javascript · highcharts · anyplot.ai";
const titleFontSize = Math.round(22 * Math.min(1, 67 / title.length));

Highcharts.chart("container", {
  chart: {
    type: "spline",
    backgroundColor: "transparent",
    animation: false,
    style: { fontFamily: "inherit" },
  },
  credits: { enabled: false },
  title: {
    text: title,
    style: { color: t.ink, fontSize: `${titleFontSize}px`, fontWeight: "600" },
  },
  xAxis: {
    title: { text: "Part Diameter (mm)", style: { color: t.inkSoft, fontSize: "16px" } },
    lineColor: t.inkSoft,
    tickColor: t.inkSoft,
    gridLineColor: t.grid,
    labels: { style: { color: t.inkSoft, fontSize: "14px" } },
  },
  yAxis: {
    title: { text: "Part Weight (g)", style: { color: t.inkSoft, fontSize: "16px" } },
    gridLineColor: t.grid,
    labels: { style: { color: t.inkSoft, fontSize: "14px" } },
  },
  legend: {
    itemStyle: { color: t.inkSoft, fontSize: "14px" },
    itemHoverStyle: { color: t.ink },
  },
  plotOptions: {
    series: { animation: false },
  },
  series: [scatterSeries, ...contourSeries],
});
Runnable source as JSON, for any HTTP client: https://api.anyplot.ai/specs/contour-density/highcharts/code. Any spec id and library id listed in llms-full.txt fit the same URL shape; every URL below is complete and callable.
{
  "spec_id": "contour-density",
  "language": "javascript",
  "library": "highcharts",
  "page": "https://anyplot.ai/contour-density/javascript/highcharts",
  "hub": "https://anyplot.ai/contour-density",
  "code_json": "https://api.anyplot.ai/specs/contour-density/highcharts/code",
  "spec_json": "https://api.anyplot.ai/specs/contour-density",
  "render_light_png": "https://storage.googleapis.com/anyplot-images/plots/contour-density/javascript/highcharts/plot-light.png",
  "render_dark_png": "https://storage.googleapis.com/anyplot-images/plots/contour-density/javascript/highcharts/plot-dark.png",
  "interactive_light_html": "https://storage.googleapis.com/anyplot-images/plots/contour-density/javascript/highcharts/plot-light.html",
  "interactive_dark_html": "https://storage.googleapis.com/anyplot-images/plots/contour-density/javascript/highcharts/plot-dark.html",
  "quality_score": 90.0,
  "license": "MIT",
  "guide": "https://anyplot.ai/llms.txt"
}
Part of Density Contour Plot on anyplot.ai.